Below is a technical analysis of gold. Please don’t shoot the analyst.
As you know, several factors could counter this trend that seems to have started, and I may be wrong. I would even say I’d be glad to be wrong.
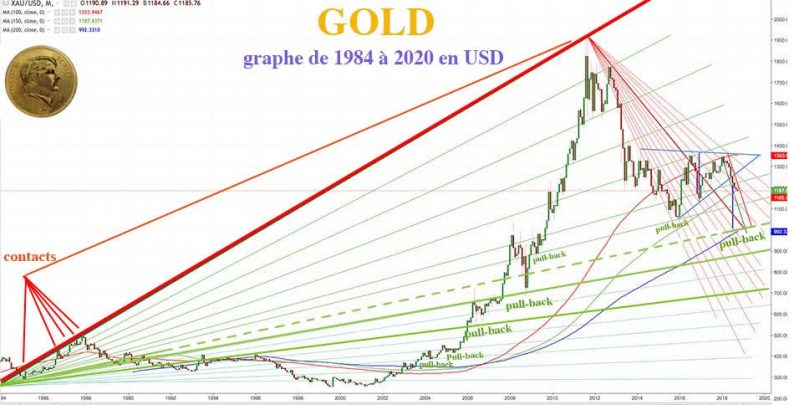
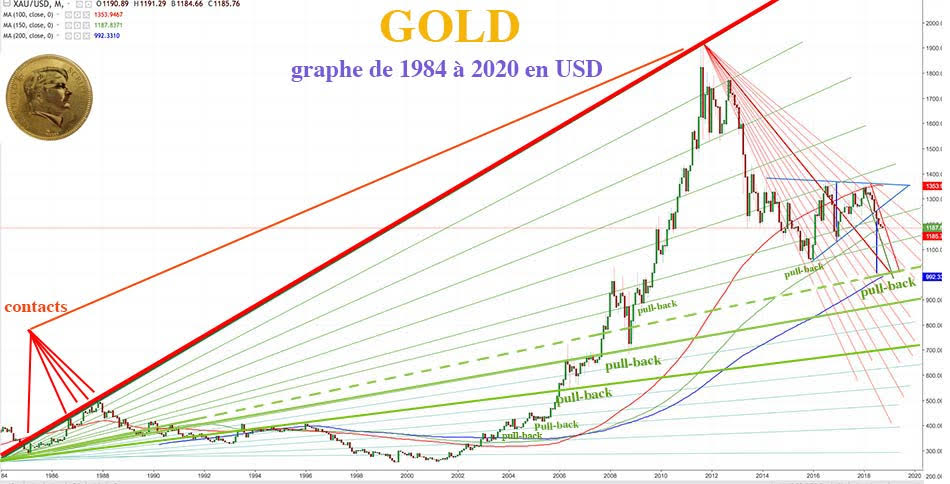
First, here is a big picture of the gold chart in US dollars, on which we can see Fibonacci fans radiating since the start of the bull market.
Curiously, we can see on this chart that the bull market started in 1984. There has been an upward push of gold, along with resistance that stopped its rise five times between 1984 and 1988, and that was tested again in 2011. The other Fibonacci fans of this rise initiated in 1984, have also been used since then.
If you look at the bullish rally that followed the severe decline in price in 2008, there is a fan (dotted line) on which there has been no pullback in 2008.
I think we’re going to get this pullback in the leg of decline to come, in order to better consolidate the rise that will follow.
The big resistance should probably be tested in the coming months, in 2019 or 2020, around $ 2,400.
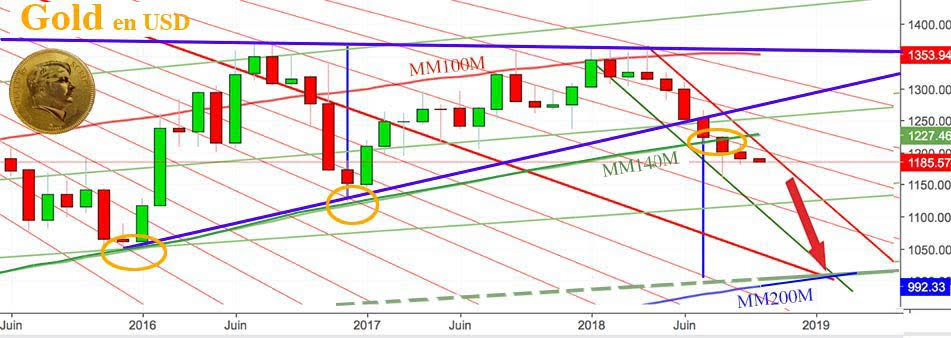
On the graph below, we can see the 100-months moving average (100mMA) has acted as resistance six times since August, 2017.
The 140mMA has acted as support in December 2016 and November 2017, but it has been broken last July.
We have to admit that the 200mMA, at the end of the year, will be superimposed with this Fibonacci fan, on which there has been no pullback in 2008 and 2009.
The 200mMA and the fan will be exactly at the same level that the one pointed by the height of the triangle, from which we got out downward.
There are thus three good reasons to think that gold will decline toward $1,000 at the end of 2018 or in the early weeks of 2019.
If we take a look at the weekly gold chart, we can see the obvious formation of a pennant flag.


Leave A Comment