
from CoreLogic
— this post authored by Andrew LePage
U.S. home prices have risen more than 6 percent over the last year but that’s only part of the challenge for home shoppers, who face mortgage payments that have risen about 12 percent year over year because of higher mortgage rates.

One way to measure the impact of inflation, mortgage rates and home prices on affordability over time is to use what we call the “typical mortgage payment.” It’s a mortgage-rate-adjusted monthly payment based on each month’s U.S. median home sale price. It is calculated using Freddie Mac’s average rate on a 30-year fixed-rate mortgage with a 20 percent down payment. It does not include taxes or insurance. The typical mortgage payment is a good proxy for affordability because it shows the monthly amount that a borrower would have to qualify for in order to get a mortgage to buy the median-priced U.S. home. When adjusted for inflation, the typical mortgage payment also puts current payments in the proper historical context.
The change in the typical mortgage payment over the past year illustrates how it can be misleading to simply focus on the rise in home prices when assessing affordability. For example, in October 2017 the U.S. median sale price was 6.3 percent higher than a year earlier in nominal terms, but the typical mortgage payment was up 12.1 percent because mortgage rates had increased by more than 0.4 percentage points over that 12-month period.
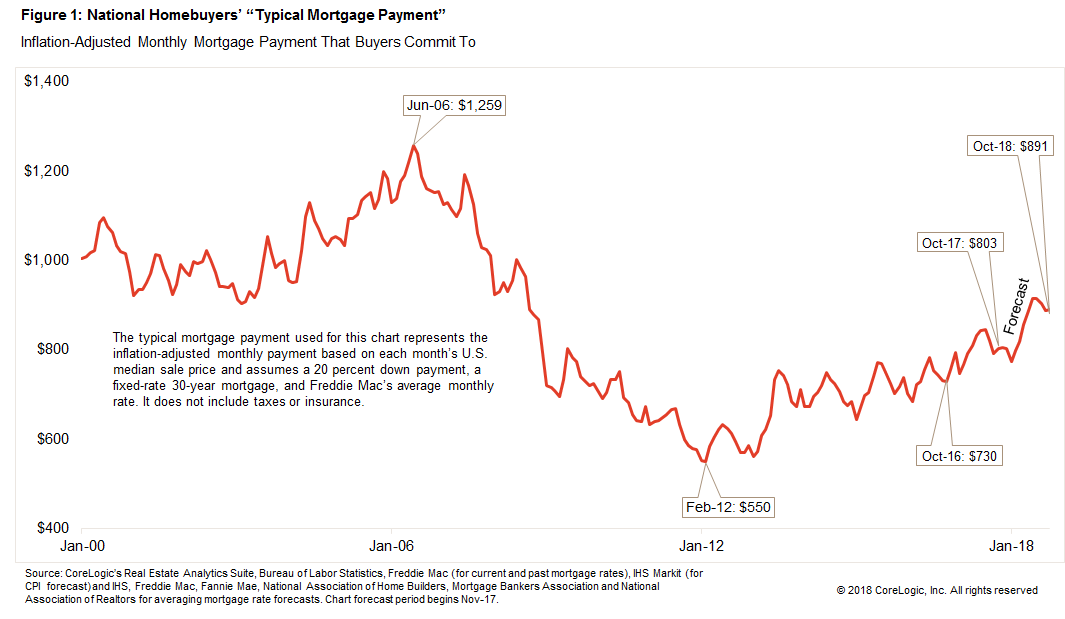
Figure 1 shows that while the inflation-adjusted typical mortgage payment has trended higher in recent years, in October 2017 it remained 36.2 percent below the all-time peak of $1,259 in June 2006. That’s because the average mortgage rate back in June 2006 was about 6.7 percent, compared with an average rate of 3.9 percent in October 2017, and the inflation-adjusted median sale price in June 2006 was $244,318 (or $199,900 in 2006 dollars), compared with a median of $212,680 in October 2017.


Leave A Comment