Housing data has come in weaker than expected across a number of indicators over the past several months, and as we discussed last night in The Closer, the Home Construction ETF (ITB) is near its worst levels versus the broad market in 6 1/2 years. With home prices relatively high, mortgage rates rising, a lack of cheap land to build on in many markets, tight labor availability, and input cost pressures, it’s not a huge surprise that homebuilders are in trouble.
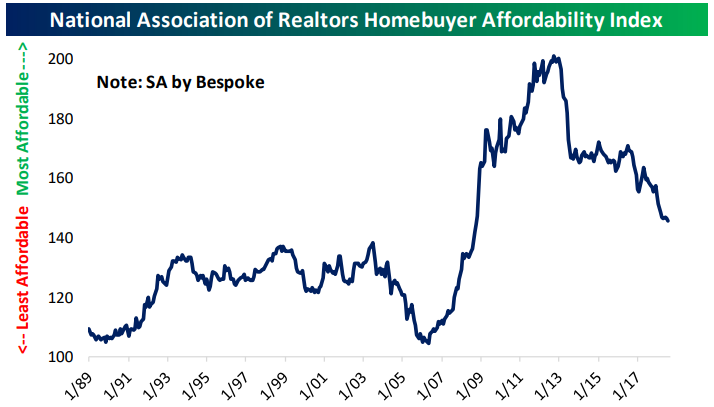
All of that said, it’s remarkable how concerned markets and pundits are about housing. Each month, the National Association of Realtors puts out an index that combines home prices with income levels and mortgage rates to deliver a bottom-line affordability number. The level of the index is arbitrary; what matters is the change or relative level. Higher readings mean housing is more affordable, lower readings mean housing is less affordable. Post-crisis, the combination of lower rates and home prices dropping much more than incomes ever did mean housing became rapidly more affordable. For those that were able to take out a mortgage (credit was obviously very tight, many households couldn’t qualify, and households were deleveraging anyways), buying a house was cheap. Since home prices bottomed in 2012, though, things have gone the other way. Relative to the immediate post-crisis period, housing is now pretty expensive. But it’s important to keep in mind that relative to rates and incomes, it’s much, much less expensive now than it was at any point from 1989 through 2009. It’s important to keep this fact in mind when reading commentary about how hard the mortgage rate increases will hit the housing market.


Leave A Comment