Shares of Nvidia (NVDA – Free Report) gained about 1.5% on Friday, extending the red-hot stock’s impressive run and lifting its three-month gains to over 25%. The Wall Street darling remains a dominant player in the gaming industry, but its ongoing rise to the top of the technology sector comes on the back of tireless advancements in autonomous driving, machine learning, and artificial intelligence.
Nvidia’s investments in these budding industries have also been paying off in the form of rapid earnings and revenue improvement, with the graphics-chip maker notching adjusted EPS expansion of 61% and sales growth of 41% in its most recent fiscal year.
One of the company’s main growth drivers has been its Datacenter segment, which includes its AI-powered DGX and Tesla products. In the latest full quarter, Nvidia witnessed Datacenter revenues of $606 million, up about 105% year over year.
But this surge has, at times, allowed Nvidia’s valuation to skyrocket into speculative growth stock territory, leading some cautious investors to declare it a bubble that is doomed to burst at the first sign of trouble.
With that said, I want to show one NVDA chart that I think every investor needs to see—regardless of whether you are bullish or bearish on the company’s future.
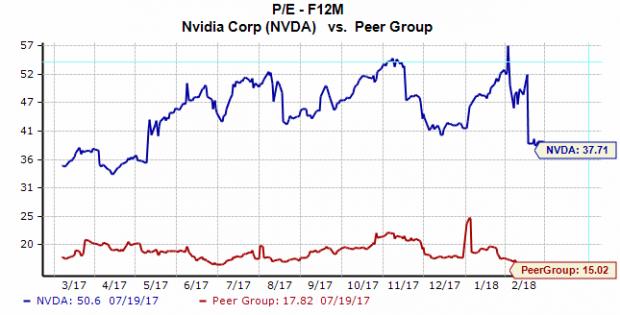
Here’s how Nvidia’s Forward P/E currently stacks up against its peer group:

Our system places seven other companies into Nvidia’s peer group: Texas Instruments (TXN – Free Report) , STMicroelectronics (STM – Free Report) , Intel (INTC – Free Report) , THK Co. (THKLY) , Sumco (SUOPY – Free Report) , Xcerra (XCRA – Free Report) , and Amtech Systems (ASYS – Free Report)
This is obviously a diverse group of stocks, with some serving as direct competitors to Nvidia in certain key businesses—and others focusing on different markets entirely. This group is not perfect for direct comparisons, but it does help show how investors value other companies in the evolving semiconductor industry.


Leave A Comment