
The end of the market correction is something that will be determined next week. There is a cycle bottoming early in the week and another on the following Monday. It’s a question of which one will be the most dominant. In order to make the analysis more clear, we’ll go directly to the weekly SPX chart.
Chart Analysis (These charts and subsequent ones courtesy of QCharts)
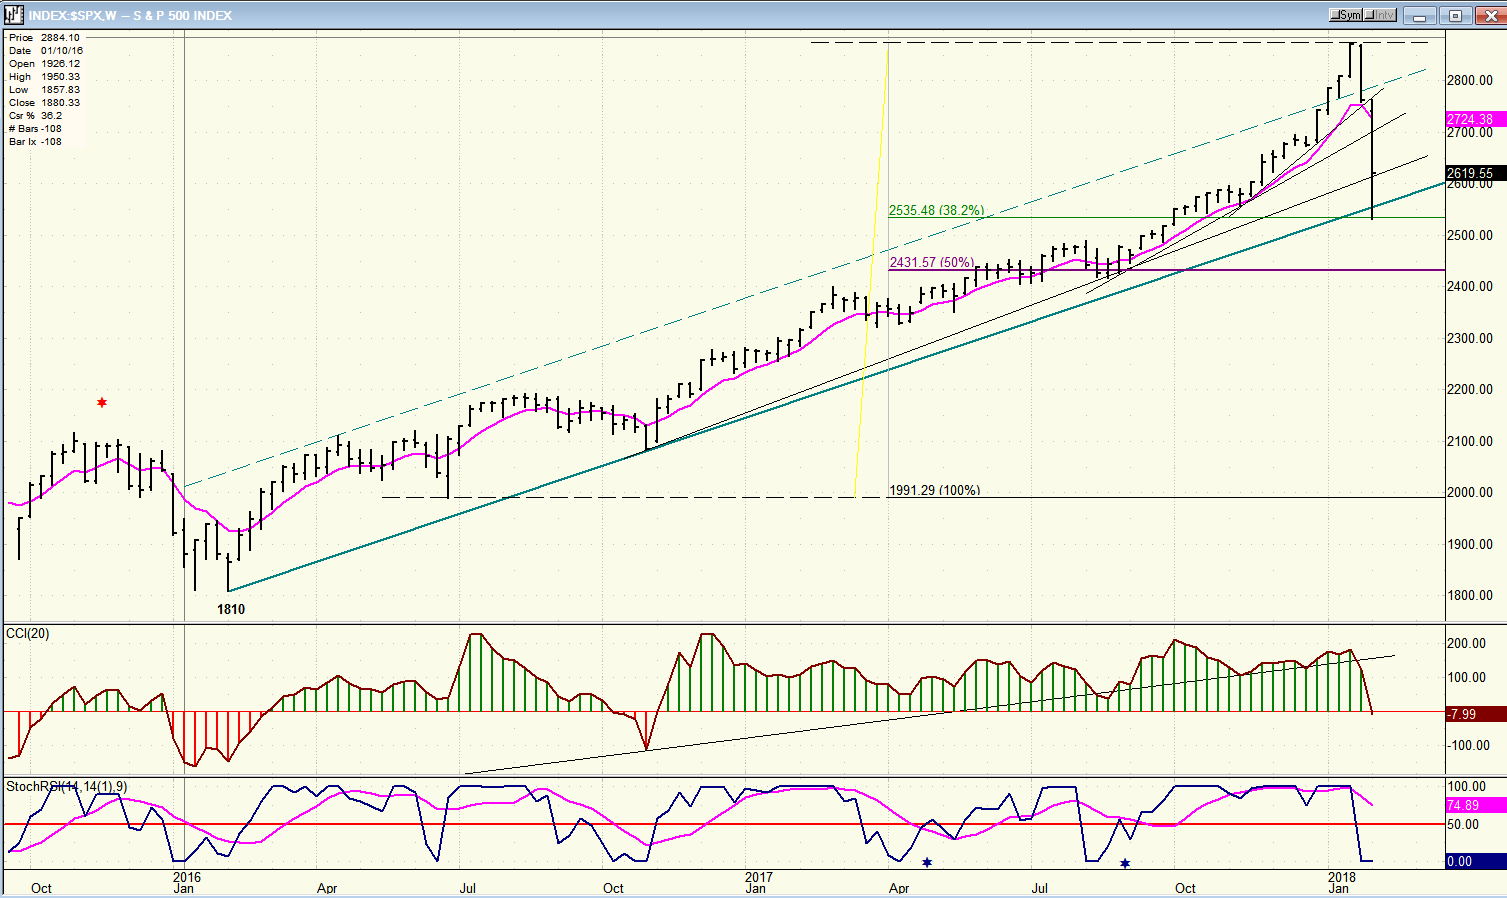
SPX weekly chart
The decline which started from 2872 had a brief pause at 2600 and found more solid support when it reached the intermediate trend line from 1810. That price level (2533) also represented a .382 retracement of the uptrend from 2000, which is the phase that we are currently correcting. So, are we done? And are we now ready to resume our uptrend? Probably not; or at least, not without retesting the 2533 low. It is also possible that we will extend the correction to a .50 retracement (down to 2434) by the following Monday; or perhaps by next month when another important cycle is due to make its low. In fact, we may not be able to attempt going for a new high (which is still the preferred scenario) until after the next 40wk cycle makes its low in May.
For now, let’s concern ourselves with near-term activity to see if we can hold at our current low of 2533 for the next few days.
SPX daily chart
Analyzing the daily chart will provide more details not available on the weekly chart. Right away, we can see why SPX found firm support at 2533. Besides the intermediate trend line and a .382 retracement, the index had previously held this level in October and, more importantly, this is the current level of the 200-DMA. It would have been disastrous if the index sliced through all that support without at least bouncing. Collectively, these various factors improve the odds that all we’ll do is re-test this level next week before moving beyond the bounce high of 2638. But this will have to be confirmed. The conditions necessary to extend the rally immediately are clearly lacking. The chart shows no price deceleration, and the steep downtrend line has not even been tested. There was some positive divergence showing in the oscillators at the low of the move, but more work will have to be done before they can signal that a reversal is about to take place.


Leave A Comment