
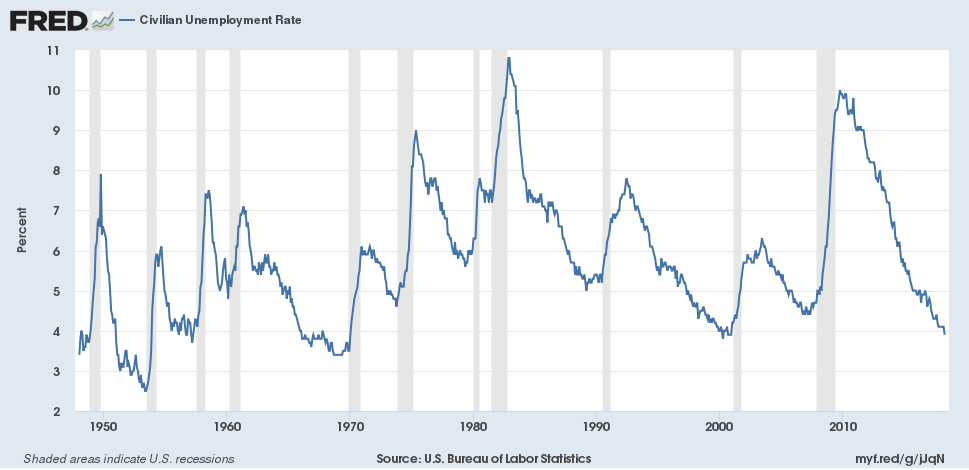
The Bureau of Labor Statistics announced yesterday that the unemployment rate was down to 3.9% in April. That’s nearly as low as it’s been any time in the last half century. Does that mean the U.S. economy faces some problems ahead?
Worries about the unemployment rate getting too low are usually framed in terms of the Phillips Curve. One simple formulation describes the Phillips Curve as a negative relation between the change in the inflation rate and the level of unemployment.
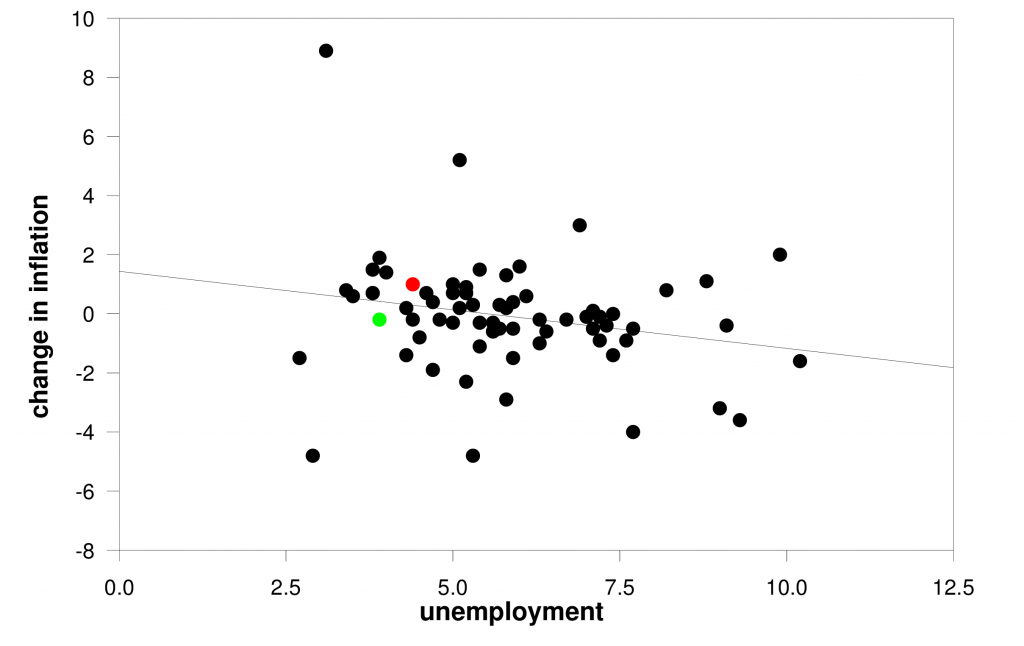
Vertical axis: year-over-year change in the inflation rate, where the inflation rate is measured as the year-over-year percent change in the quarterly implicit price deflator on personal consumption expenditures (first quarter to first quarter, 1949-2018). Horizontal axis: unemployment rate in April of each year. Red dot is 2017 and green is 2018. OLS regression line has R2 of 5% and Newey-West t-statistic (with 2 lags) of -1.96.
That estimated relation says that if the unemployment rate was at 5.5%, inflation this year would be expected to be the same as last year. With unemployment at 3.9%, inflation this year would be expected to be 0.4% higher than the year before. But in fact, inflation over the last year was 0.2% lower than it had been the year before, as represented by the green dot in the figure.
As I’ve simple formulation, that kind of miss is pretty much par for this relation. Indeed, the standard error of estimate for the regression is 1.9. In other words, when the unemployment rate is at 3.9%, we expect this year’s inflation rate to be 0.4% higher than the year before, plus or minus 3.8%.
Still, if the claim of the fitted Phillips Curve is accurate, it certainly means we could not stay at 3.9% unemployment forever. If we were to try to do it for 5 years in a row, for example, it would predict an inflation rate at the end of 5 years that would be 2% higher than when we started. We could easily live with 2.4% inflation. But 4% inflation would be a problem.


Leave A Comment