
Litecoin has been shaken by the crypto-crash that currencies experienced last week: it plunged after the big rally. Yet like bitcoin, the long Christmas weekend gave LTC some time to rest, consolidate and look for a new direction.
Looking at the charts, it still hasn’t decided on a new technical direction. The digital currency is confined to a narrowing triangle or wedge. This narrowing range does not narrow forever. Eventually, the price takes a specific direction and goes all in.
LTC/USD wedge
Here is how it looks on the chart. A description follows:
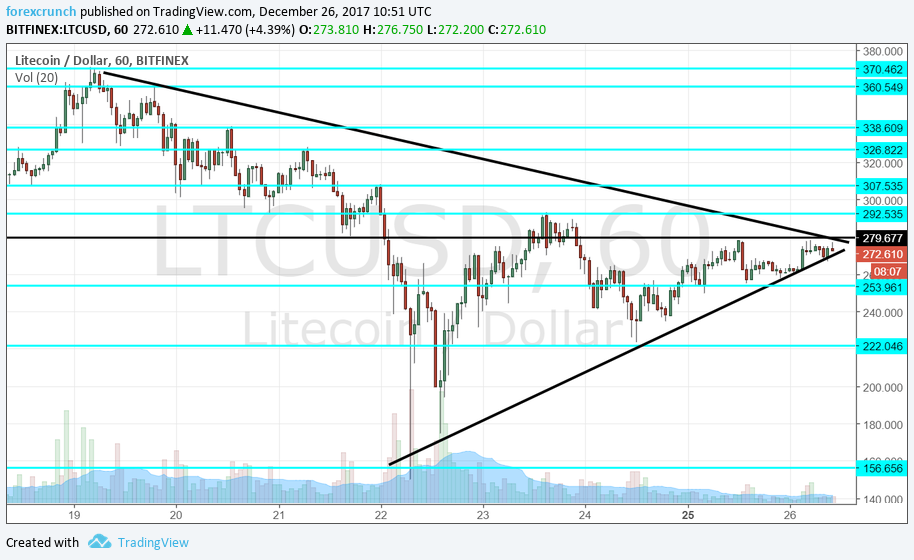
Uptrend resistance begins from the all-time high of $370.50 that was seen on December. From there, we have a series of higher lows: 360, 340, 325, 303, 290, and most recently, 280 dollars, which is already a double top.
The fact that we do not have another lower high is a bullish sign. The bleeding may have stopped and perhaps coin could make a break above $280.
Looking at uptrend support, the crash point of $155 that was seen on Friday is clearly the low point. Another swing low at 176 was recorded on the same day and since then we have a string of higher lows that form this wedge. Contrary to the downtrend resistance line, we do not have any lower lows nor any double bottom. LTC/USD finds it harder to fall back to lower ground.
All in all, the technical lines point to a potential explosion in the price, and there seems to be more room to the upside than to the downside.


Leave A Comment