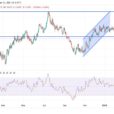
SPX has popped to resistance at the top of a ‘W’ pattern and halted there. This is a valid termination point. The chart however, has higher levels where the bounce, which was anticipated since before the Tinder Box post, can terminate. The 2000 area, 2040 and a measurement of the ‘W’ to around 2120 are the next levels.
As it is, the bounce has gone high enough to get CNBC and Cramer to start rethinking the well publicized bearishness.

Momentum leader, BTK is getting killed today folks, that ain’t bullish. Indeed, I took a small loss on Gilead, letting a minor profit slip away.

Meanwhile, the bombed out gold and energy sectors are doing well. I think there is more than just the usual small bounce going on here, but we’ll have to evaluate it on the fly. Volume preceded price as it is supposed to do. I am not heavily exposed the miners, but have enough of the quality items to suffice for now. The key would be a change of trend and then a ‘buy the pullbacks’ regime might work well.


The above are charts from NFTRH and NFTRH+ updates, respectively. Indeed, here’s the bigger view of XLE, per an NFTRH+ ‘look ahead’ update several weeks ago. It never (as yet) got down to the ‘no brainer’ 55 level. But the daily above puts that in doubt for the near to intermediate-term.

Just a snapshot of a few items in today’s infinitely interesting markets.


Leave A Comment