A general review of the current status across different asset markets. This is not our usual comprehensive, forward-looking NFTRH analysis, but it is an up to the minute summary (as of yesterday afternoon).
Precious Metals
Gold, silver and gold stock indexes/ETFs made what I had thought were bear flags yesterday, but today’s reversal painted them as short-term bounce patterns (‘W’ with a higher low in the miners and silver).
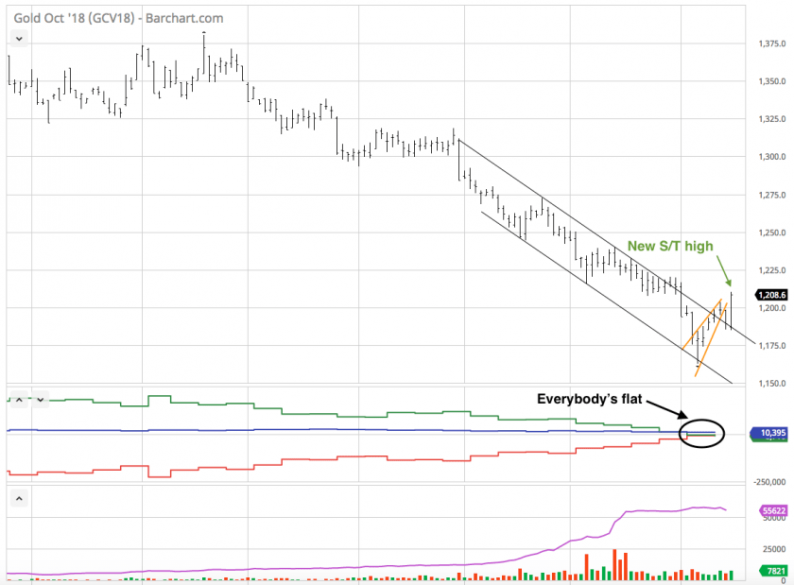
This chart of gold (courtesy of Barchart.com) shows a flag breakdown, whipsaw and new closing high for the short-term move. As we’ve noted for weeks now, the Commitments of Traders (CoT) is in a contrary bullish alignment with large Specs all but wrung out of the market (they were fleeced again; don’t believe hype about their increased shorting being some sort of conspiracy). All in all, not bad for the relic. The bounce lives on.

Silver (switching back to our regular charting platform, stockcharts.com) is not in quite as good a CoT situation (not shown here) but it’s not bad either. It is constructive for a bounce, at least. A nice whipsaw sees silver close above this week’s previous closing highs. It too repaired any issue from its flag and is constructive for a continued bounce.

The 30 minute GDX chart used in this morning’s post shows the whipsaw below the upper support of a nice looking bottom pattern (green shaded) and bounce back above. Are we filling this gap and declining again? It’s possible this morning’s gap will fill short-term, but the bounce should continue at some point. There are a couple upper gaps that can fill as well, after all. As will be noted below, the fundamentals are not in order for the sector.

Let’s switch to the HUI index for a daily gold stock view. The close above all of the week’s previous highs after the flag reversal is positive and implies coming near-term upside. No brainer resistance is noted and should be well respected if the fundamentals do not come in line. There are however, lower data points that could limit the move as well. For those we use long-term charts.


Leave A Comment