The S&P 500 ended the session with a fractional decline. The pre-market economic release of weekly jobless claims was a bit disappointing. Today’s seasonally adjusted 276K new claims was a 16K rise over the previous week and the largest weekly increase since the 19K rise at the end of February. The S&P 500 hit its 0.31% intraday high in the opening minutes and then sold off to its -0.57% intraday low about an hour later. The index then made a couple of attempts to rise above yesterday’s closing price but ended with a -0.11% loss for the session.
The yield on the 10-year note closed at 2.26%, up 1 bps from yesterday’s close.
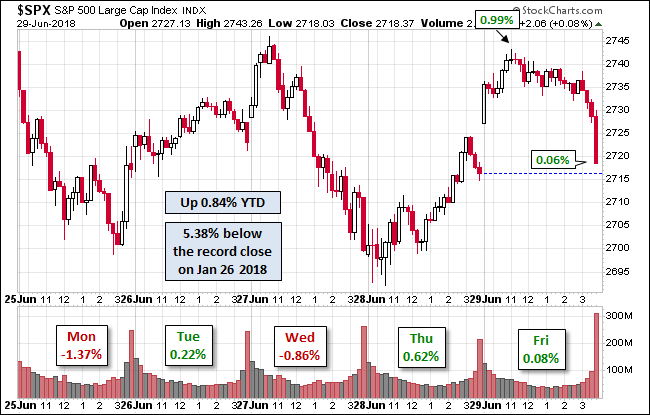
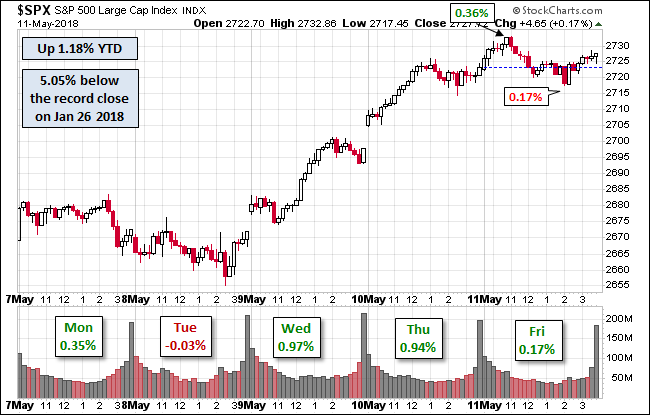
Here is a snapshot of past five sessions.

Here is a daily chart of the index. Trading volume today was again unremarkable.
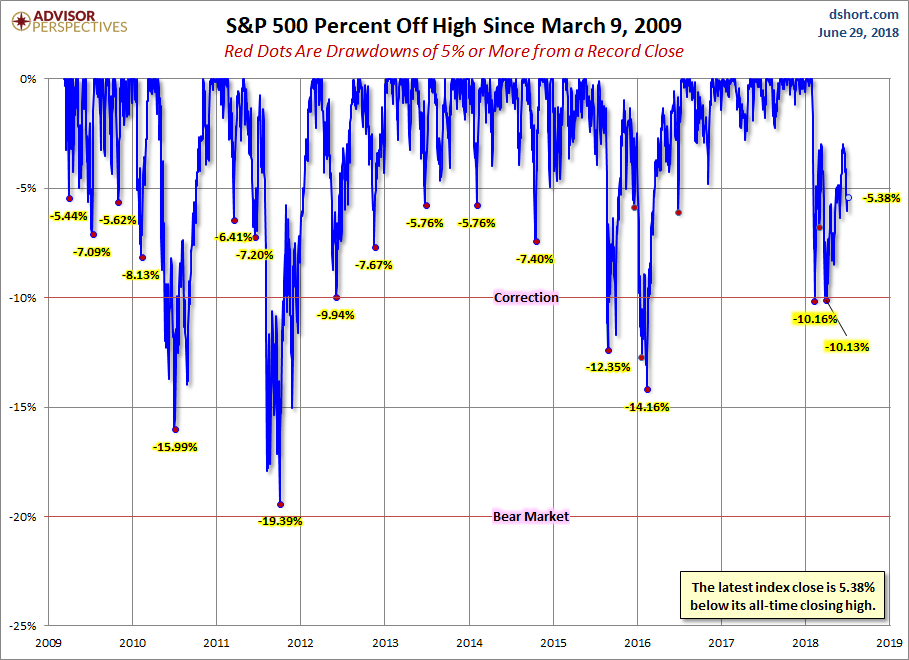
A Perspective on Drawdowns
Here’s a snapshot of selloffs since the 2009 trough.
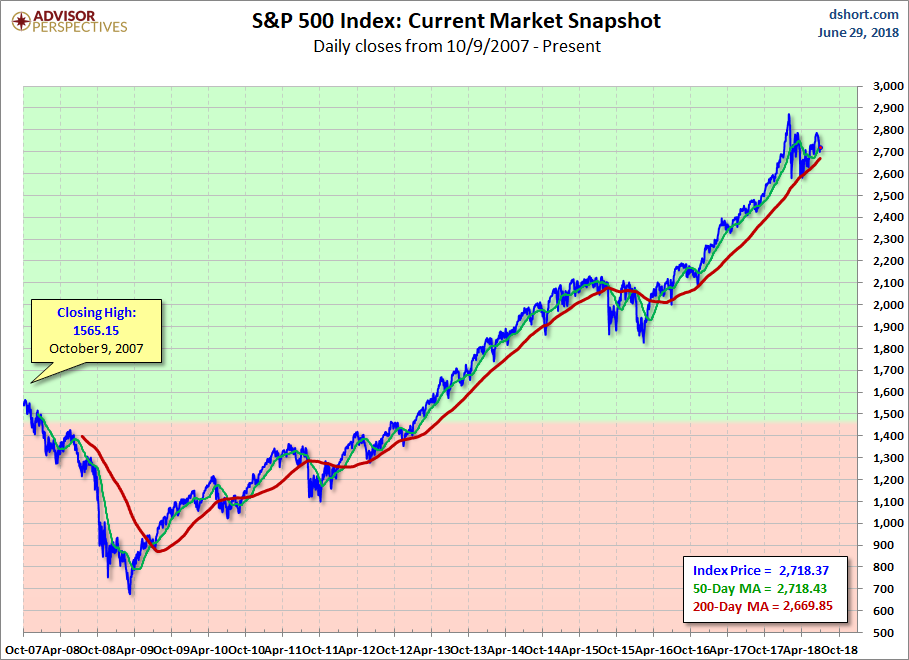
For a longer-term perspective, here is a log-scale chart base on daily closes since the all-time high prior to the Great Recession.

Here is the same chart with the 50- and 200-day moving averages. The 50 crossed below the 200 on August 28th.


Leave A Comment