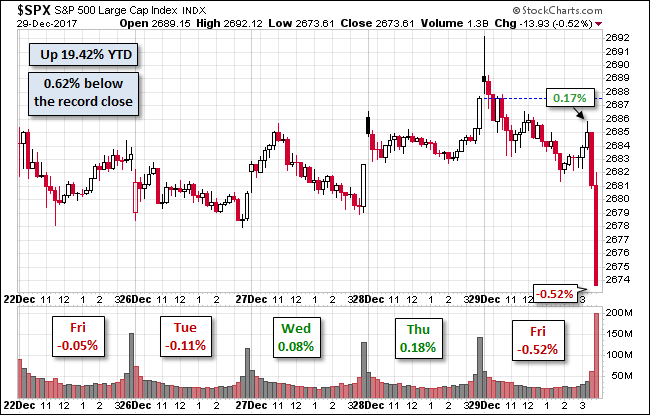
The S&P 500 closed out 2017 with a gain of 19.42% and 62 record highs. Week-over-week saw a loss of 0.36%, showing a lack of a “Santa Rally”, but we still have the first few trading days of the year to find out. We will see if the passage of the tax bill causes any gains in the first few days of 2018.

The U.S. Treasury puts the closing yield on the 10-year note at 2.43%.
Here is a daily chart of the S&P 500. Today’s selling puts the volume 36% below its 50-day moving average.

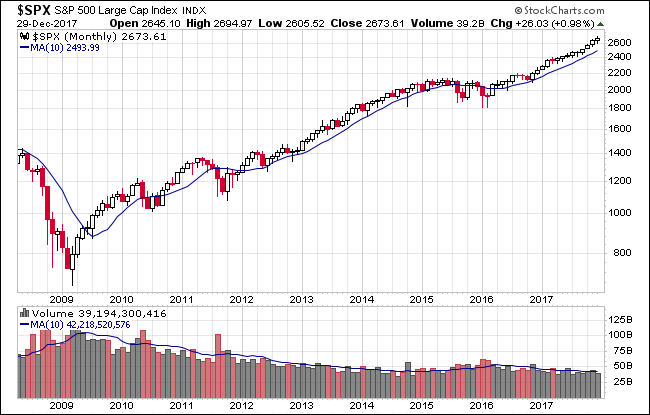
Here’s a monthly snapshot of the index going back to December 2008.
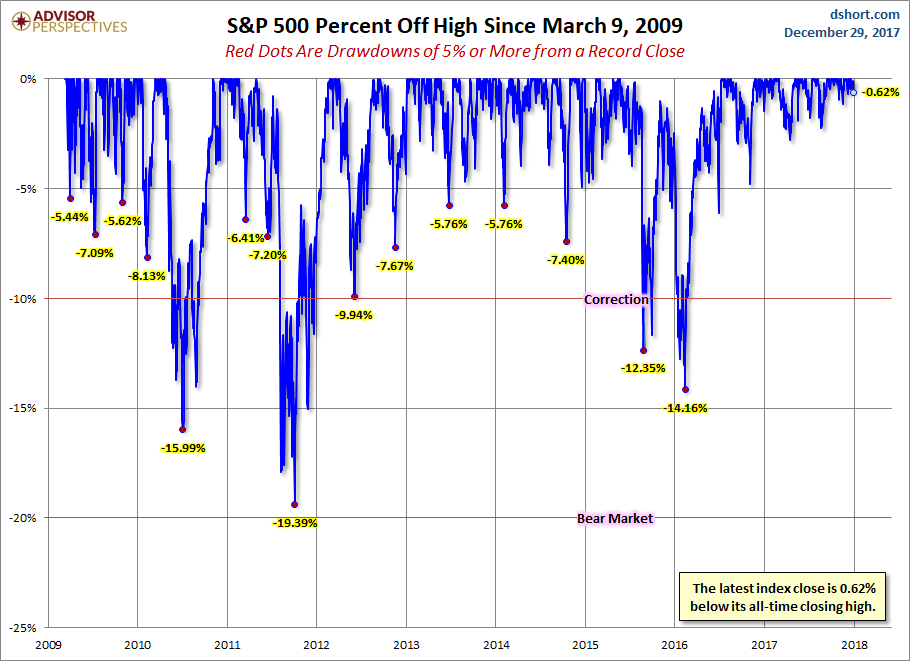
A Perspective on Drawdowns
Here’s a snapshot of record highs and selloffs since the 2009 trough.
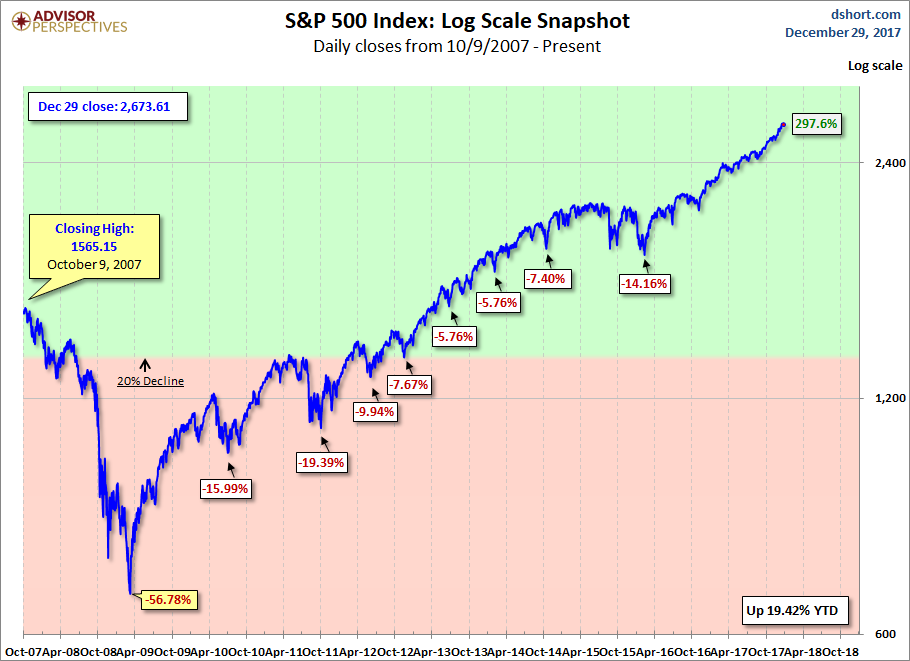
Here is a more conventional log-scale chart with drawdowns highlighted.
Here is a linear scale version of the same chart with the 50- and 200-day moving averages.

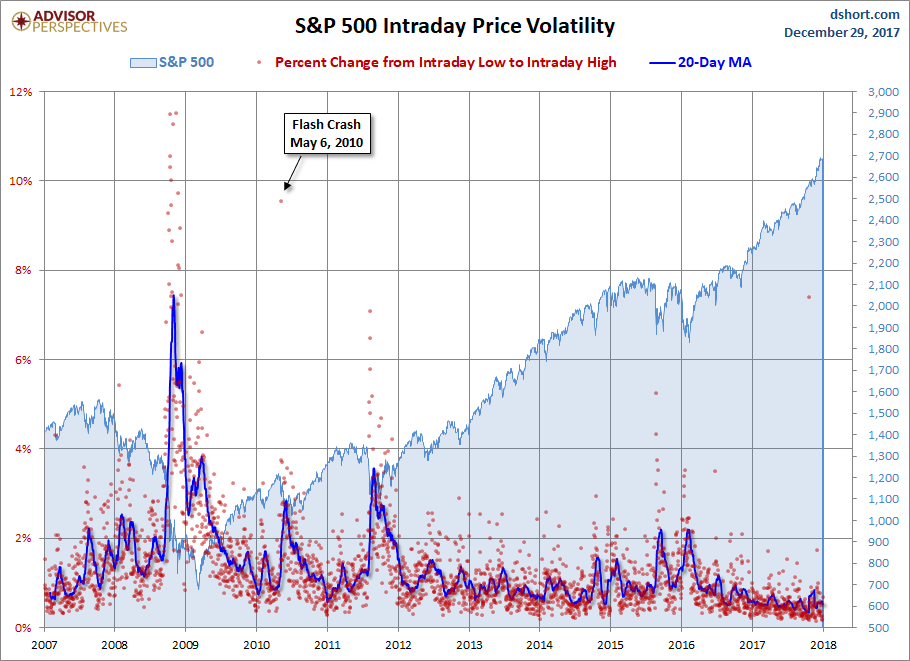
A Perspective on Volatility
For a sense of the correlation between the closing price and intraday volatility, the chart below overlays the S&P 500 since 2007 with the intraday price range. We’ve also included a 20-day moving average to help identify trends in volatility.


Leave A Comment