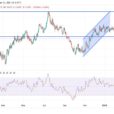
VIX pulled back from its highest level since February, closing above its Cycle Top at 19.67 while showing a loss for the week. The Cycles Model shows another likely surge in strength for the VIX through the next week.
(FoxNews) U.S. stocks are off to another volatile day of trading Wednesday, with the Dow giving up 400 points on the day. While the trading action has most investors taking huge losses, the VIX volatility index and its derivatives have produced major gains in the past week.
In the past week, the VIX is up nearly 60 percent, and the BRCL BK IPTH S&P 500 VIX SH FTRS ETN (NYSE: VXX) is up 18.6 percent. The VIX is a measure of the amount of volatility options traders are pricing in over the month ahead.
SPX closes above Long-term support
SPX bounced off its 2.5-year trendline, closing just above Long-term support/resistance at 2765.98. Failure at the trendline implies a continuation of the sell signal. The Cycles Model now implies a powerful decline with increased volatility that may last through late October.
(Bloomberg) Package maker Sealed Air Corp. fell the most in six months Thursday after saying higher raw material costs would crimp the bottom line. A few days earlier it was rising freight outlays at Fastenal Co., where $1.1 billion of market value was erased. On Oct. 9, paint maker PPG Industries Inc. mentioned rising expenses. The shares cratered.
From railroads to retailers, signs of price pressures are starting to show at U.S. industrial companies, contributing to the worst October start for the S&P 500 since 2008. Equities have had their three worst sessions since April in the space of eight days, narrowly escaping a fourth straight down week thanks to a Thursday rally.
NDX closes beneath Long-term support
NDX tested the underside of its 2.5-year trendline and failed, closing beneath Long-term support at 7118.70. This may have negative consequences as the next support may be the 7-year Ending Diagonal trendline at 6250.00. The weakest part of the Presidential Cycle often occurs in October. The Cycles Model agrees that October may be especially hard on stocks.
(ZeroHedge) In the latest Flow Show report from BofA’s Michael Harnett, the Chief Investment Strategist notes that, as expected, there was a major flow capitulation during the last week following the worst rout in the market since February. To wit, there was a massive $15.8BN outflow from equities, coupled with $8.1BN out of bonds.
Broken down by category, there were big outflows from US stocks ($14.8BN), mutual equity funds ($15.5bn) and, of course, Europe where some $4.8Bn fled following the latest Italian turmoil. Credit was not spared either with a “huge” $6.2 billion in IG bond redemptions, one week after what was already record outflow from investment grade.
Meanwhile, the recent reversal in investment sentiment continues with $11Bn in outflows from financials over the past 7 months, after $32bn in inflows since 1/17; in just the past 4 weeks there have been $2Bn in tech redemptions after $42Bn in inflows since January.
High Yield Bond Index bounces off the trendline
The High Yield Bond Index appears to have bounced off its long-term trendline to close beneath Short-term support at 201.47. Should it decline further beneath the trendline, a sell signal may be confirmed beneath Long-term support at 194.08. High yield bonds are also anticipating further weakness through the end of the month.
(Zacks) Junk bond ETFs have had a muted run lately with popular funds SPDR Barclays High Yield Bond ETF (JNK– Free Report) ) and iShares iBoxx $ High Yield Corporate Bond ETF (HYG – Free Report) ) shedding about $1.28 billion and $1.27 billion in assets since the start of October (as of Oct 16, 2018). The funds have lost about 0.14% and 0.02% in the past week (as of Oct 12, 2018). According to TrimTabs Investment Research, high-yield bond exchange-traded funds saw $4.1 billion of funds gushing out in the five trading sessions through Thursday. The outflows marked around 10% of the overall junk bond ETF market, per an article published on MarketWatch. That outflows represented the largest week-long outflow for high-yield ETFs since TrimTabs has been tracking the data


Leave A Comment