(T2108 measures the percentage of stocks trading above their respective 40-day moving averages [DMAs]. It helps to identify extremes in market sentiment that are likely to reverse. To learn more about it, see my T2108 Resource Page. You can follow real-time T2108 commentary on twitter using the #T2108 hashtag. T2108-related trades and other trades are occasionally posted on twitter using the #120trade hashtag. T2107 measures the percentage of stocks trading above their respective 200DMAs)
T2108 Status: 39.9%
T2107 Status: 19.2%
VIX Status: 22.3
General (Short-term) Trading Call: bullish
Active T2108 periods: Day #3 over 20%, Day #2 over 30% (overperiod), Day #47 under 40%, Day #51 below 50%, Day #66 under 60%, Day #407 under 70%
Commentary
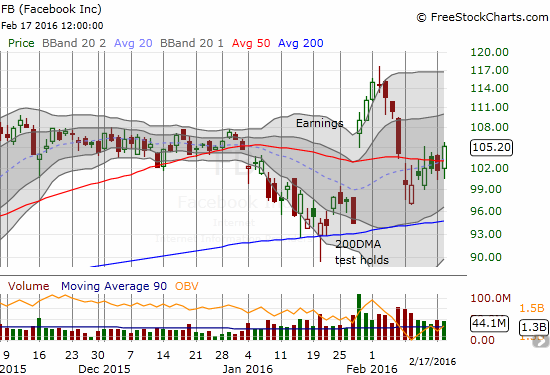
On January 28, 2016, Facebook (FB) gained 15.5% in a post-earnings move that I described as “full bull.” The bullishness of the day was confirmed when T2108 finally exited an excruciating oversold period the following day. I am calling this day: “Full Bull (FB) Part Two” because FB has recovered from a near complete reversal of all its post-earnings gain to close above its 50-day moving average. This bullish move comes after six straight trading days testing and retesting resistance at the 50DMA only to get turned back.

This close-up of Facebook (FB) shows how the stock almost gave up its entire monster post-earnings gain and then struggled mightily to fight 50DMA resistance. The close above resistance positions FB to make a fresh run to regain its post-earnings luster.
The road ahead to confirm FB’s bullish move will not (should not?) be nearly as easy as Full Bull Part One. On the positive side, T2108 soared for a third straight day demonstrating broad participation in this current bounce from oversold trading conditions. At 39.9%, T2108 closed exactly at the peak of December’s bounce from oversold conditions.
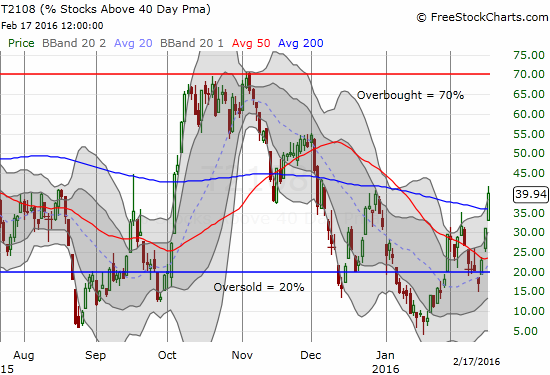
T2108 is putting on an impressive display of strength. Can it now hurdle over critical resistance and FINALLY close above 40%?


Leave A Comment