
(T2108 measures the percentage of stocks trading above their respective 40-day moving averages [DMAs]. It helps to identify extremes in market sentiment that are likely to reverse. To learn more about it, see my T2108 Resource Page. You can follow real-time T2108 commentary on twitter using the #T2108 hashtag. T2108-related trades and other trades are occasionally posted on twitter using the #120trade hashtag. T2107 measures the percentage of stocks trading above their respective 200DMAs)
T2108 Status: 19.1% (briefly exited oversold period with a high of 20.3%)
T2107 Status: 23.7%
VIX Status: 28.4
General (Short-term) Trading Call: Bullish
Active T2108 periods: Day #7 below 20% (oversold), Day #8 under 30%, Day #31 under 40%, Day #71 under 50%, Day #88 under 60%, Day #286 under 70%
Reference Charts (click for view of last 6 months from Stockcharts.com):
S&P 500 or SPY
SDS (ProShares UltraShort S&P500)
U.S. Dollar Index (volatility index)
EEM (iShares MSCI Emerging Markets)
VIX (volatility index)
VXX (iPath S&P 500 VIX Short-Term Futures ETN)
EWG (iShares MSCI Germany Index Fund)
CAT (Caterpillar).
Commentary
T2108 made an effort to end the oversold period at six days, but my favorite technical indicator could not quite close the deal. After reaching a high of 20.3%, T2108 fell back to close at 19.1%.
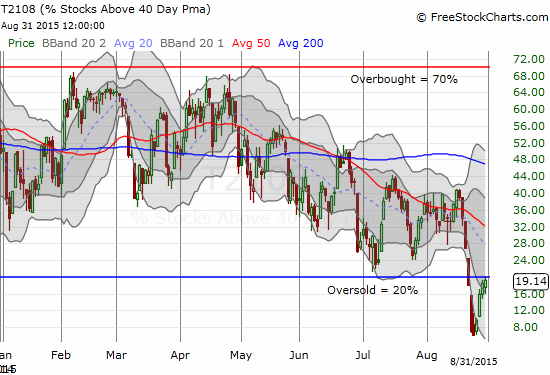
T2108 briefly peaks over the oversold horizon
It was a strange day for T2108 to make a run at ending the oversold period. The S&P 500 (SPY) was never up for the day and closed down 0.8%. Ditto for the NASDAQ (QQQ).

The S&P 500 runs out of gas and leaves behind a topping “small body” doji. Buyers will need to step up quickly.
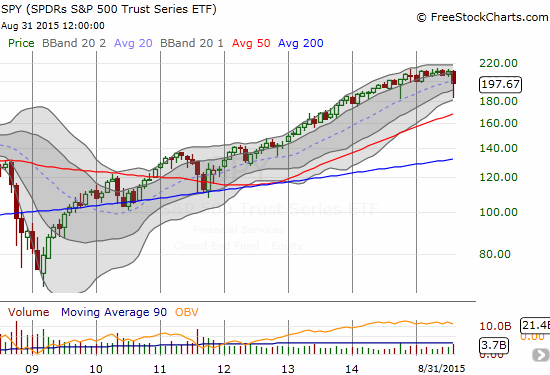
This monthly view puts August’s sell-off into proper perspective. The month now looks like the “natural” conclusion to a year of waning momentum.

The NASDAQ (QQQ) suffered the same kind of pullback as the S&P 500.


Leave A Comment