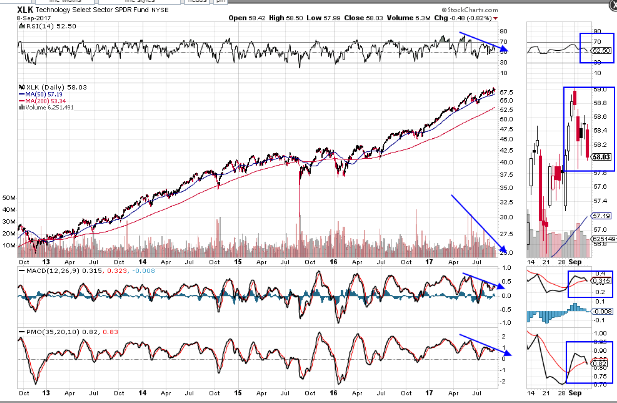
The Technology ETF (XLK) is close to forming a “SELL” signal. Two of the three technical indicators on the Daily chart below have done so, as of Friday’s close, while the RSI threatens to join the MACD and PMO if it crosses below the 50 level. Price action this week, following its all-time high made last Friday, has been overly bearish.
Watch for a potential retest of the 50-day moving average around 57.00, or lower to, even, the 200 MA around 53.00, on signs of escalating weakness.

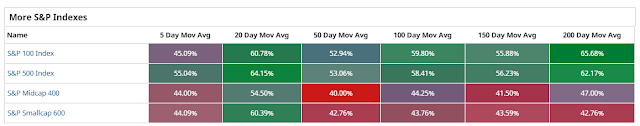
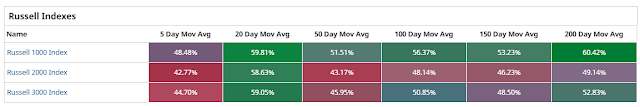
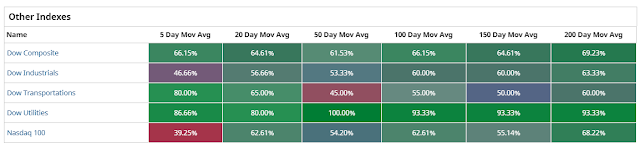
Furthermore, there has been an erosion in the percentage of stocks above a variety of moving averages in the Nasdaq 100 Index, since I last reported on this data a week ago here, as shown on the following tables.
The rest of the Major Indices shown have also faced a reduction, with the exception of the Dow Transports and Dow Utilities Indices, and, to a lesser extent, the Dow 30 Index, which have firmed up a bit…indicating that market participants shed riskier asset-buying in favour of less risk this week.


Leave A Comment