Note: This commentary has been updated to include this morning’s release of Nonfarm Employment for December.
Official recession calls are the responsibility of the NBER Business Cycle Dating Committee, which is understandably vague about the specific indicators on which they base their decisions. This committee statement is about as close as they get to identifying their method.
There is, however, a general belief that there are four big indicators that the committee weighs heavily in their cycle identification process. They are:
The Latest Indicator Data
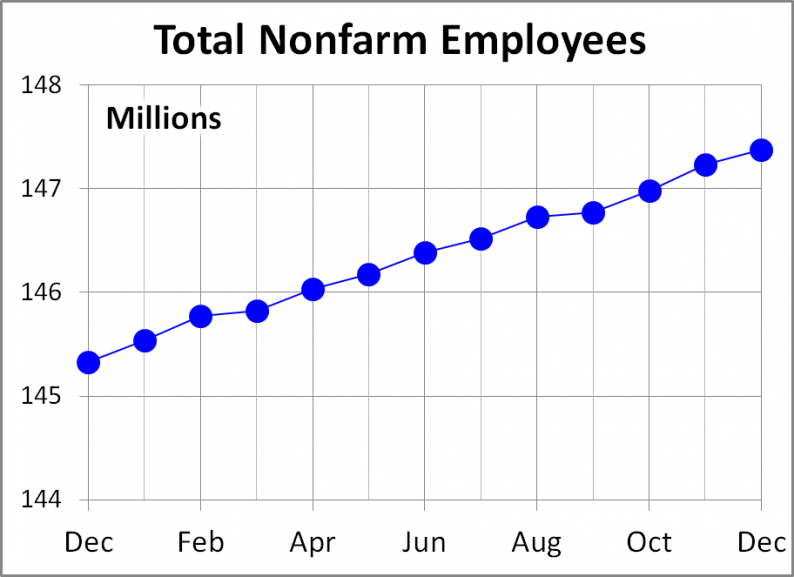
This commentary has been updated to include this morning’s release of Nonfarm Employment. December’s 148K increase in total nonfarm payrolls was accompanied by annual revisions going back to January 2013. The unemployment rate remained at 4.1%. The Investing.com consensus was for 190K new jobs and the unemployment rate to remain at 4.1%.
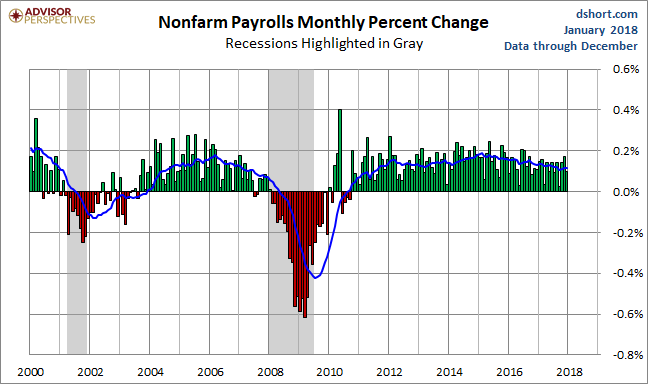
The chart below shows the monthly percent change in this indicator since the turn of the century, a period that includes two recessions. The latest 0.10% MoM increase is lower than the 0.14% absolute change since the end of the last recession. We’ve included a 12-month moving average to help visualize the trend.
The Problem of Revisions
At first glance, this indicator appears to have a strong correlation with the business cycle. However, there is a major problem with this assumption: The data in this survey of business establishments undergo multiple revisions. The initial monthly estimate is subject to a first and second revision, subsequent benchmark revisions and annual revisions that stretch back many years (the most recent includes revisions back as far as February 1990). The cumulative size of the revisions is quite stunning, much of which is owing to the “hindsight” of those annual revisions.


Leave A Comment