Falling between the Christmas and New Year’s holidays, not much of newsworthy note happened for the S&P 500 during the fourth week of December 2017 and the final week of that year.

Consequently, the S&P 500 mostly moved sideways during Week 4 of December 2017 before dipping by 0.5% to close at 2,673.61 on Friday, 29 December 2017, the last trading day of 2017. Most of that decline happened during the last half hour of the day’s trading, suggesting that it wasn’t motivated by much more than opportunistic year-end profit taking during a week that featured very light trading volumes.
The headlines of the week that was point to a very slow week for market-moving news indeed.
Tuesday, 26 December 2017
Wednesday, 27 December 2017
Thursday, 28 December 2017
Friday, 29 December 2017
Finally, Barry Ritholtz provides a succinct summary of the positives and negatives for the U.S. economy and markets in the year ending fourth and final week of December 2017.
Wrapping Up 2017 in a Bow
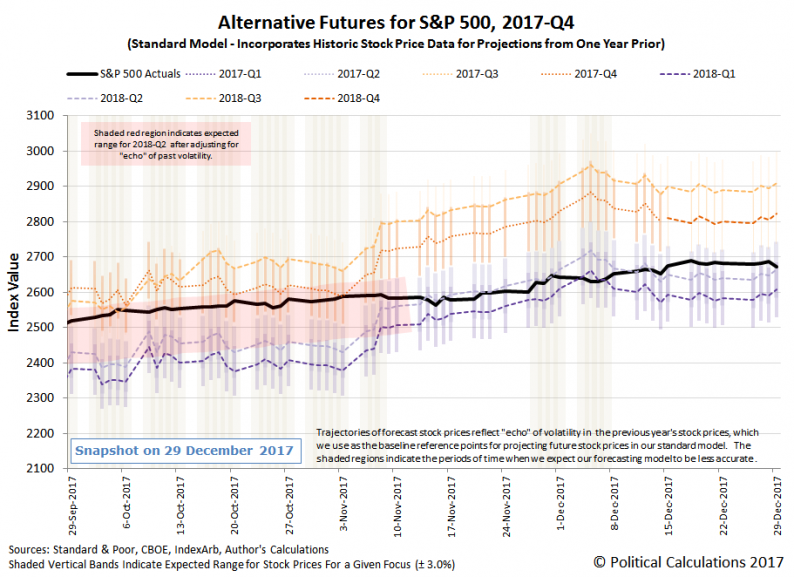
The alternative futures charts that we present each week show the actual trajectory that the S&P 500 takes with respect to the backdrop of where our dividend futures-based model projects that they would be depending upon where stock prices are in the present and have been in the recent past, as well as how far into the future investors, might be looking on any given day.


Leave A Comment