On Thursday, the Conference Board released the latest leading and coincident economic indicators. There are 2 reasons there are some of my favorite statistics. First, they organize 14 economic indicators in an easy-to-understand format. Second, they have a long history of accurately predicting the overall pace of growth. A combined reading of the Conference Board’s LEI/CEI release and the long leading indicators points to an economy that will continue to grow mildly for the foreseeable future.
The Long Leading Indicators
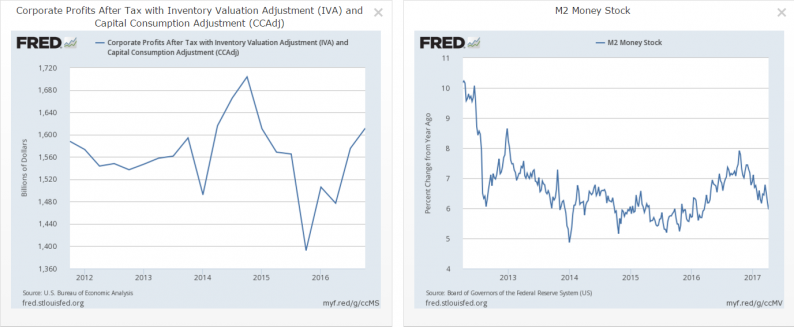
There are 4 leading indicators, starting with corporate profits and M2’s Y/Y growth.

Starting in mid-2014, corporate profits (left chart) declined for 4 consecutive quarters. This drop’s damage – which was caused by OPECs opening of the production spigot in an attempt to drive American fracking companies out of the market — was contained within 2 sectors: oil and basic materials.But since oil’s price stabilization, energy profits have rebounded, contributing to macro-level corporate profit increases in 3 of the last 4 quarters.In addition, M2 (right chart) continues to grow at a solid pace, indicating there is ample liquidity for the economy.
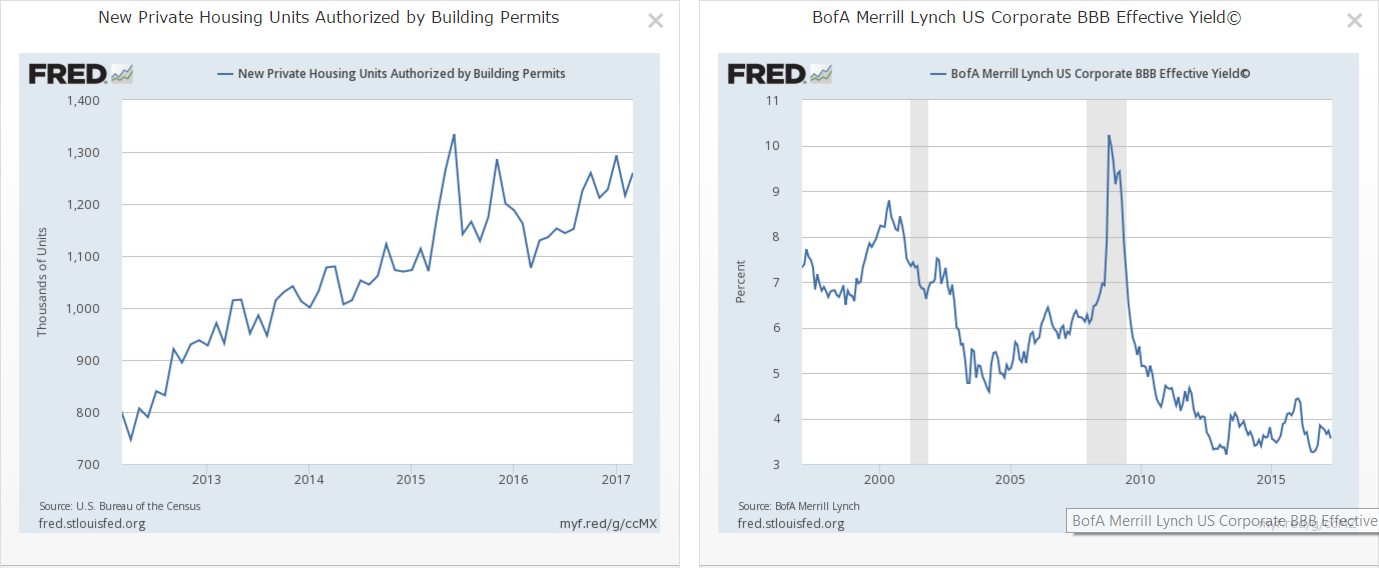
Building permits (left graph) are in a mini-uptrend that started at the beginning of 2016.However, the overall level of permit activity has fluctuated between 1.1 and 1.3 million since mid-way through 2015. BBB bond yields (right chart) are still trading near the low-end of the post 2009 range, indicating investors still believe these lower-rate companies are still worthwhile investments.
The Leading Indicators
The LEIs Rose .4% M/M and were up 2.4% on a rolling, 6-month basis. The best part, however, is the breadth of the advance:
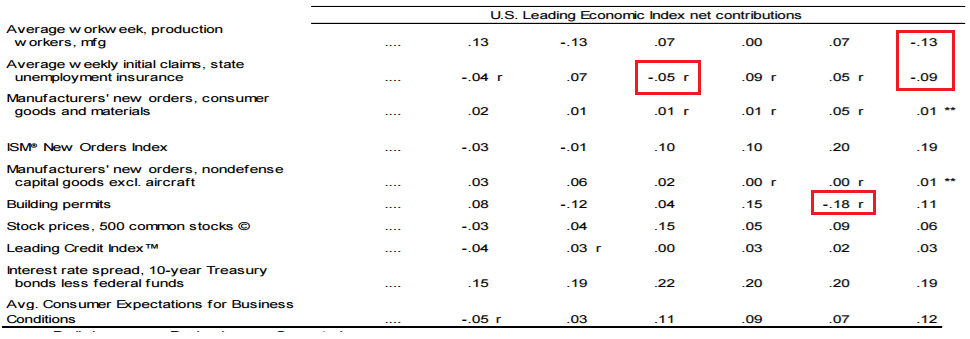
In the last 4 months, the smallest number of components that have increased is 8.This means each component is helping to move the economy forward – a healthy development.
The Coincident Indicators
The following graph shows the 5 most important coincident indicators:


Leave A Comment