
My Weekend report will be in 2-3 posts and this is simply the first that will cover the USD and Gold.
As longer Cycles typically dominate shorter ones, this update will provide both longer and shorter views on the USD and Gold. Why the two together? Obviously due to the negative correlation. No correlation works all the time, however, and I fully expect to see periods where the USD and Gold rise and perhaps fall together. That said, the correlation has been fairly strong over the past year so I find it best to sometimes cover these assets together.
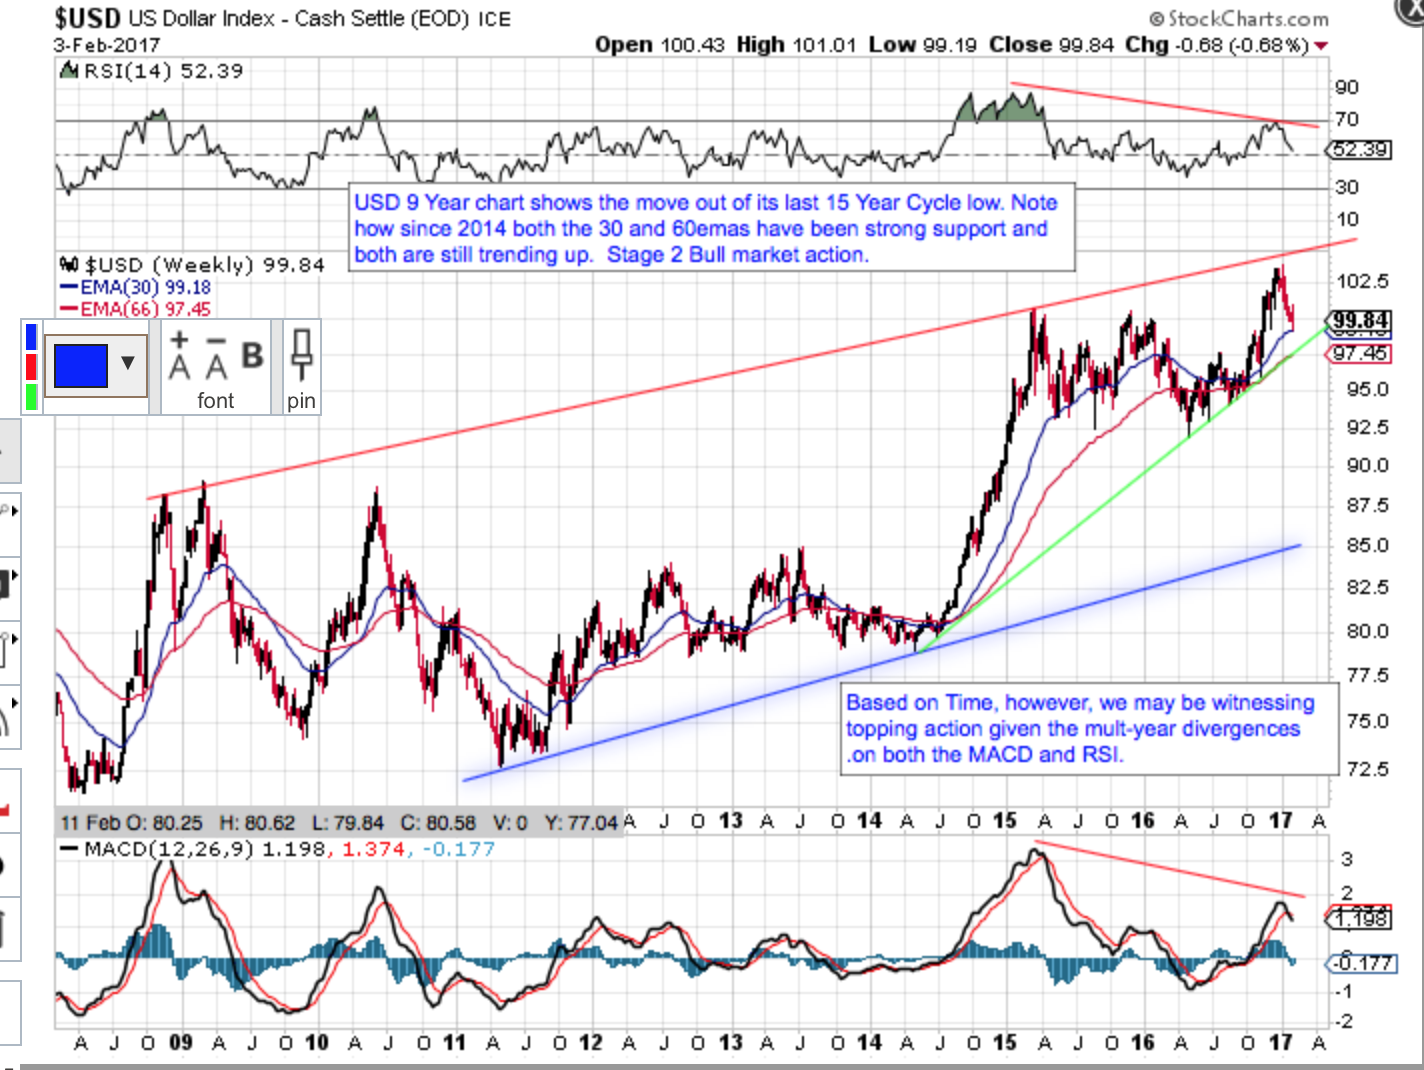
USD Longer Cycles: According to Weinstein’s Price Based Market Stage Model, I have the USD in “Stage 2 Bull” for all of its longer Cycles (i.e. Yearly, 3 Year Cycle and 15 Year Super Cycle). Nearer term, I have it looking for a short term Trading or Daily Cycle low (TCL or DCL). Based on TIME, however, we may be very close to its 15 Year Super Cycle top (now in year 9 of the move out of its last 15 year Low)
My first long 4 year weekly USD chart clearly shows Price above both the 30 wema nd 66 wema. Both EMAs are trending up confirming Stage 4 Bull Market.Based on Time, however, I am expecting the USD to find its 15 Year Super Cycle top in 2017. It may have already topped or it may have one more push left.
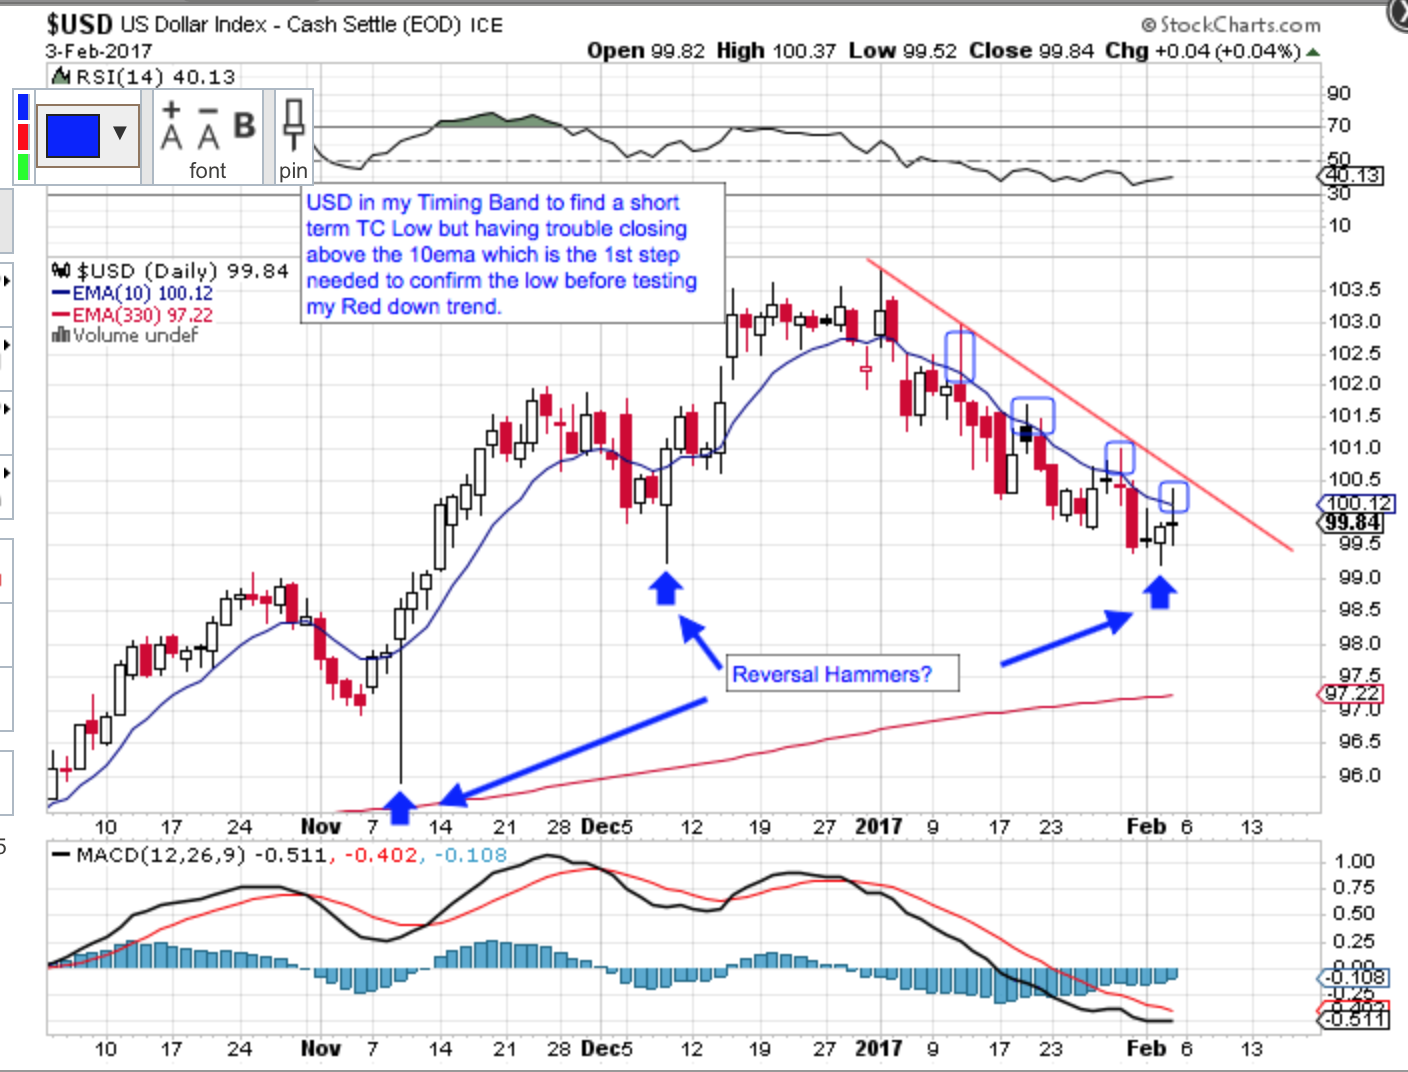
My second chart is a short term daily showing I am expecting a short term Trading Cycle low at any time. Was Thursday’s reversal hammer the initial signal? Time will tell but the next step is a close above the 10ema.
Gold’s Longer Cycles: While my bias is to have Gold in a Bull Market, gold is at a critical point in its move out of the December YCL. According to Weinstein’s Price Based Market Model, Gold is most like in “Stage 1 Basing.” You could also argue either Stage 4 Bear or Stage 2 Bull but based on the Price action against these weekly ema’s on my first 3 year chart, Gold is at a critical stage that will solidify one of these stages over the next 3-4 weeks.


Leave A Comment