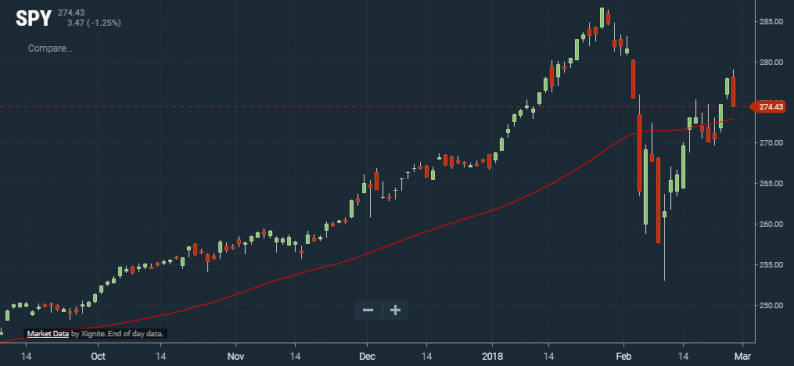
As shown in the chart below pulled from our interactive Chart Tool (available to anyone), the S&P 500 remains just above its 50-day moving average.
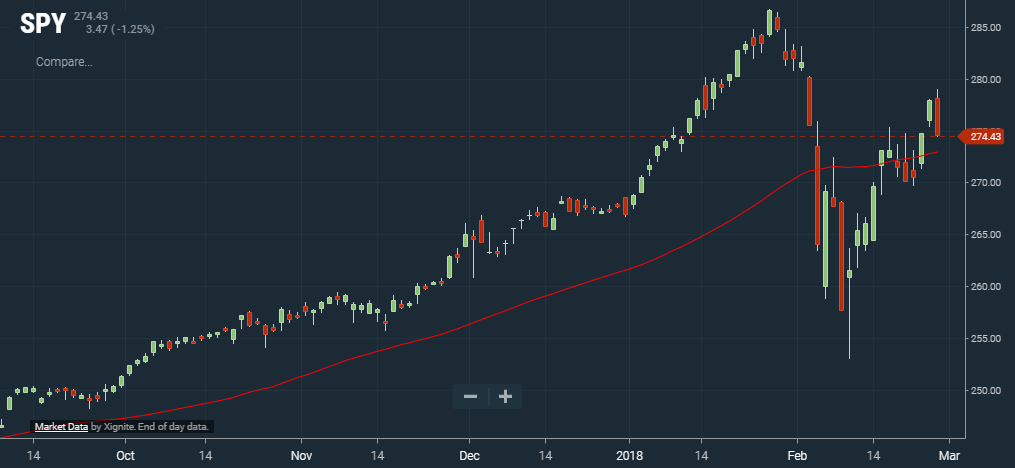
The percentage of stocks in the S&P 500 that are trading above their 50-day moving averages remains below the 50% mark, however, which is a sign of weak breadth relative to where the broad index is trading.

The Technology and Financial sectors — which account for roughly 40% of the S&P 500 — are keeping breadth levels for the broad market afloat. As shown below, 78% of Tech stocks are above their 50-DMAs, while 64% of Financial stocks are above their 50-DMAs. There are seven sectors that currently have weaker breadth readings than the 46% level for the S&P 500. These include sectors like Energy, Real Estate, Consumer Staples, Consumer Discretionary, and Materials.


Leave A Comment