
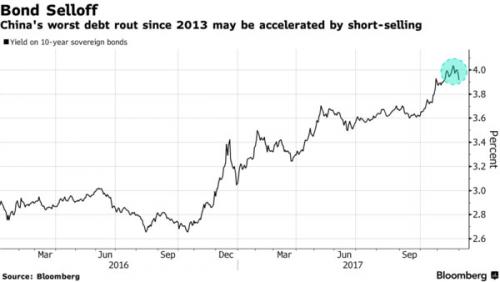
Until a modest dip in Chinese bond yields in the past two days, 10y CGB and 10y policy bank bond yields soared by 40bps and 70bps, respectively, over the last 2 months. In fact, Chinese government notes are headed for the worst selloff since 2013, with the 10-year yield surging 86bps this year to 3.92%, and the yield of 10y CDB bonds rose above 5%. This bond rout and sharp spike in rates, caught the market by surprise, as the economic growth actually slowed in October and inflation is still below 2%.
What happened to drive up interest rates so sharply?
The most likely answer is also the simplest one: after years of aggressive debt expansion, leading up to October’s Party Congress, China finally unleashed a sharp, aggressive deleveraging, which has finally been appreciated by the market in recent weeks, resulting in the biggest plunge in many local stocks in the past year, as well as a flurry of recent crashes in both Hong Kong and the mainland.
How to determine if this is correct? As Deutsche Bank observes, financial sector leverage can be measured by the gap between broad credit and M2 growth. The gap has narrowed significantly, reflecting the ongoing deleveraging process (Figure 1). More importantly, the inverted credit-M2 gap is a good leading indicator for bond yield, with a lag of about 3 months (Figure 2).

The next question is what’s the link between financial sector leverage and bond yield? The answer is that when the financial sector leveraged up, smaller banks (city and rural commercial banks) aggressively expanded their balance sheet through wholesale funding, and increased holdings of longer-term safe assets. The shadow banking sector also increased exposure to bonds, mainly through asset management funds. Small banks and fund houses together accounted for 82% of the incremental holdings in CGBs and policy bank bonds between 2014 and 2017 (Figure 3). In the deleveraging process, small banks and asset management funds become less expansionary (Figure 4).


Leave A Comment