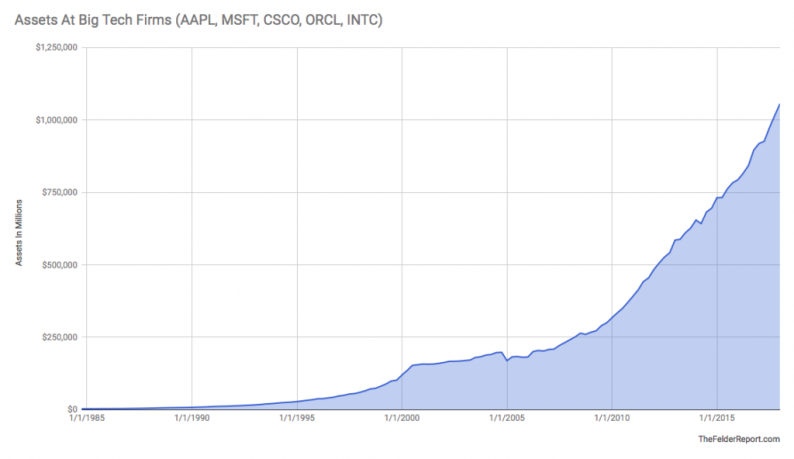
Many have marveled at the massive amount of cash built up on the balance sheets of big tech companies in recent years. It’s truly astounding and almost incomprehensible. When you put together the assets of Apple, Microsoft, Cisco, Oracle and Intel the total recently surpassed a $1 trillion. (To put this astronomical number into perspective, one million seconds is equal to 12 days. A billion seconds is 31.7 years and a trillion seconds is 31,709.8 years.)

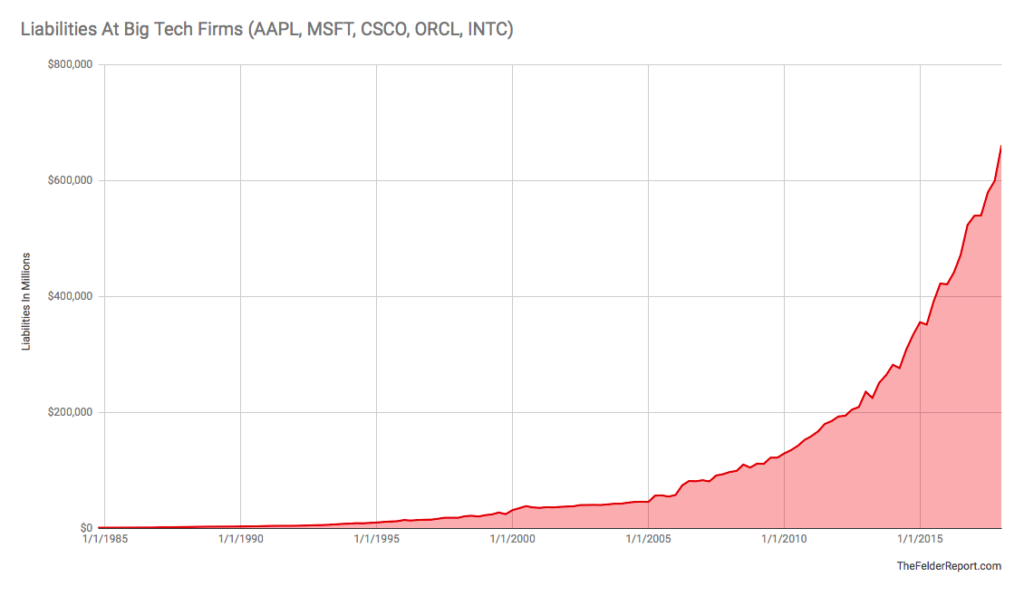
However, few have also noticed just how much debt these companies have built up at the same time. While it has not yet reached a trillion dollars the total liabilities at these companies have grown much faster than total assets. In fact, over the past five years the growth in liabilities (22.9% compound average growth rate per year) has nearly doubled the growth in assets (12.5%).
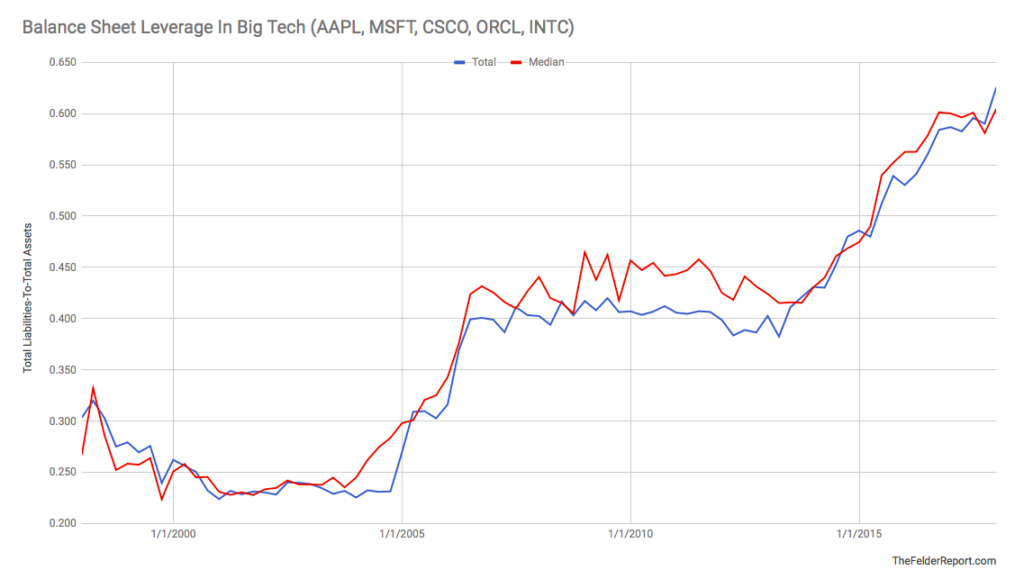
The result is that balance sheet leverage among big tech is higher than ever before. Since the peak of the dotcom bubble balance sheet leverage at these companies, as measured by total liabilities-to-total assets, has actually doubled. And this trend can be seen, not just in the group as a whole, but in each individual company within it, as well.
Perhaps most striking is the example of the company with the most cash of all: Apple. While most ogle the zeroes on the asset side of the company’s balance sheet the liability side has grown so much faster that balance sheet leverage at the company is now just as great as it was when it found itself in severe distress 20 years ago.
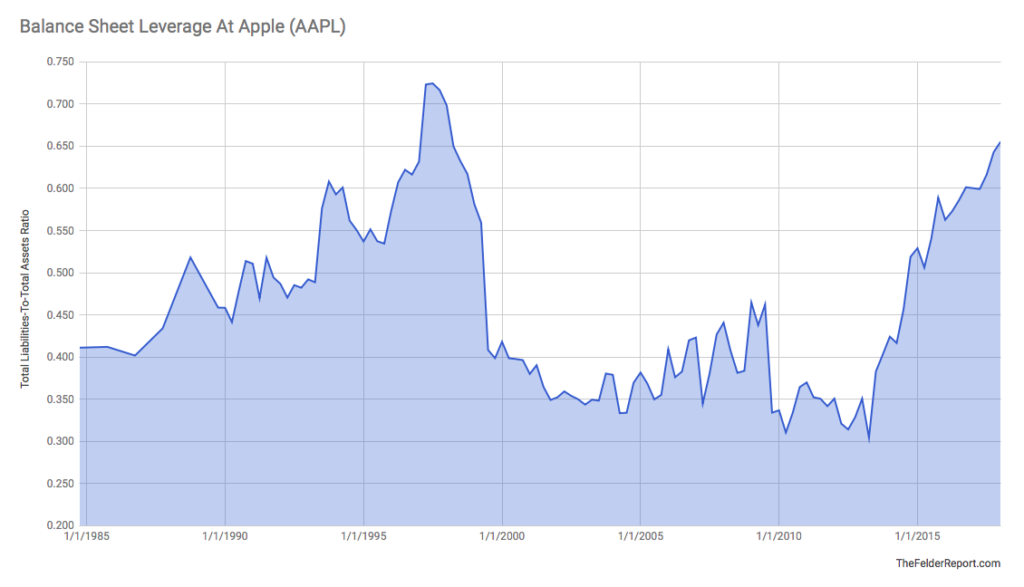
Now I’m not suggesting Apple is at all distressed today. I’m just pointing out that the amazing cash pile it and others have managed to build up in recent years has been greatly offset by the amount of debt they have taken on. And this may be the single greatest difference between the tech bubble and today. Back then equity financing was the name of the game; today these companies use the credit markets to retire equity.


Leave A Comment