
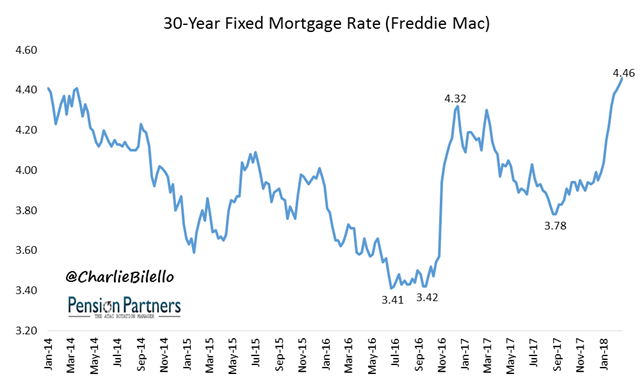
U.S. Mortgage Rates have risen for 9 consecutive weeks, hitting their highest levels since January 2014.
Source Data: Freddie Mac
That certainly seems like a sharp increase, but is 4.46% high?
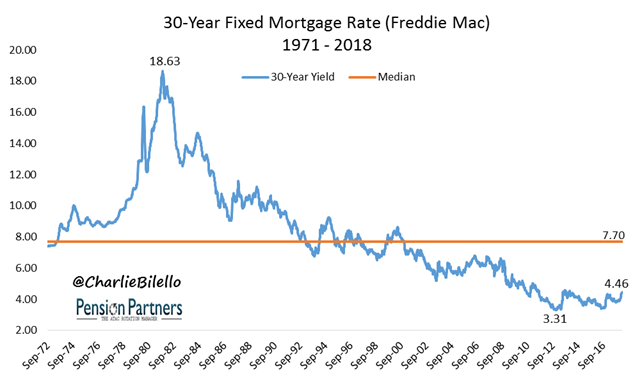
Only when compared to recent history, which includes the all-time low in yields from November 2012 (3.31%). In a historical context, mortgage rates today are still quite low.
How low? Lower than 85% of monthly data points going back to 1971. The median 30-year Mortgage Rate over that time: 7.70%.
Source Data: Freddie Mac
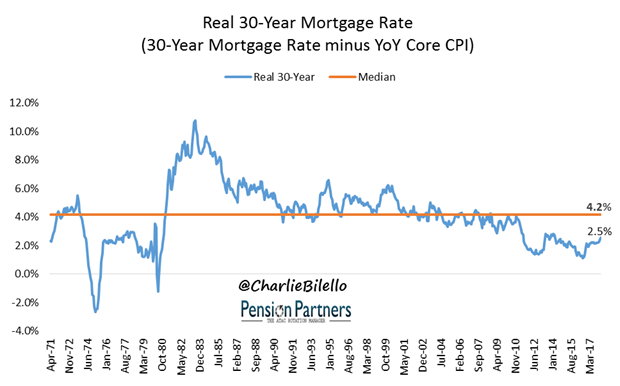
After adjusting for inflation, real mortgage rates (at 2.5%) are also well below the historical median (4.2%).
Source Data: Freddie Mac, FRED
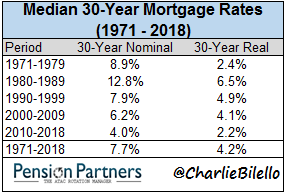
In the current decade, we’ve seen the lowest mortgage rates in history.
Source Data: Freddie Mac, FRED
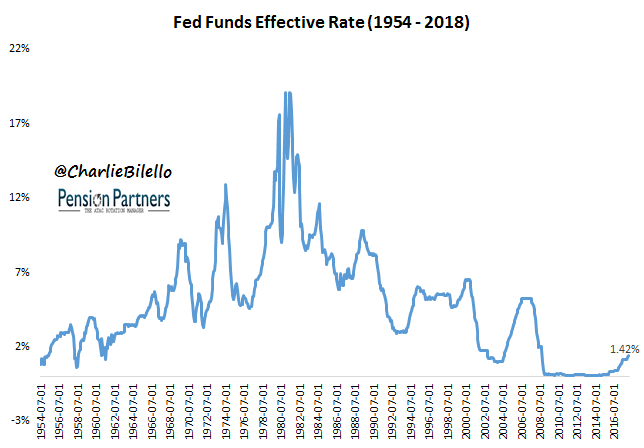
Why? After the housing collapse and financial crisis, the Federal Reserve made a recovery in home prices one of its primary objectives. They held the Fed Funds Rate at 0% for a record seven years (December 2008 to December 2015) and have since hiked rates at the slowest pace in history. Low short-term rates have pulled down longer-term Treasury rates, which in turn have pulled down mortgage rates.
Source Data: FRED
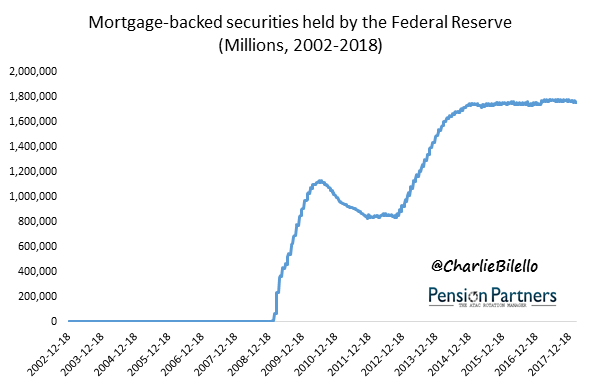
The Fed also purchased over $1.75 trillion of mortgage bonds in 3 separate rounds of quantitative easing, further suppressing mortgage rates. Until a few months ago, they had been reinvesting 100% of maturing bonds.
Source Data: FRED
For 2018, the Fed has laid out plans to gradually reduce its mortgage holdings: $8 billion a month in January, $12 billion a month by April, and a maximum of $20 billion a month by October. At a pace of $20 billion per month, it would take over 7 years for the Fed to unwind all of its mortgage holdings.
Nevertheless, this slow reduction in the Fed’s balance sheet combined with higher short-term rates (Fed plans to hike 3 more times in 2018) could put additional upward pressure on mortgage rates.
Which leads us to the central question many are asking…


Leave A Comment