WTI crude prices managed to scramble back up to pre-API-tumble levels ahead of DOE’s data dump this morning with all eyes on gasoline inventories, which did not disappoint showing a small draw (in line with expectations) along with crude’s draw which was roughly in line with API and expectations. Production continues to rise to highest since July 2015.
API
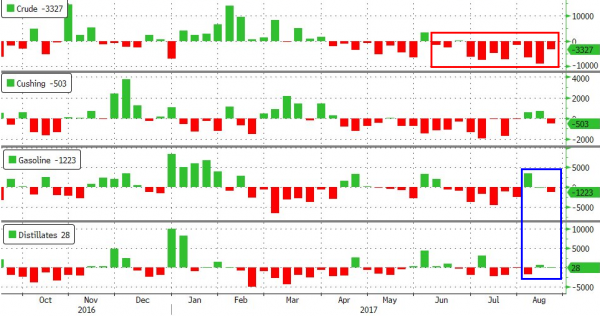
DOE
Builds in products (gasoline and distillates) according to API is weighing on markets (and a big shift from last week’s massive crude draw), but DOE data showed a draw for gasoline (in line with expectations) and a draw for crude (in line with expectations)

Total Crude Oil Inventories dropped to the lowest since Jan 2016… But as is very clear, remains dramatically over-stocked relative to pre-2015 norms…

One crucial data point that Bloomberg’s Javier Blas notes: total U.S. oil stocks (which includes crude, refined products and the volatile “other oils” category) were unchanged last week. That’s not what the bulls need.
Amid all the bluster, we found it ironic that Crude imports from Venezuela climbed 52 percent to 987,000 barrels a day, also the most since April.
U.S. Fuel Demand Fell 0.72% in Past Four Weeks
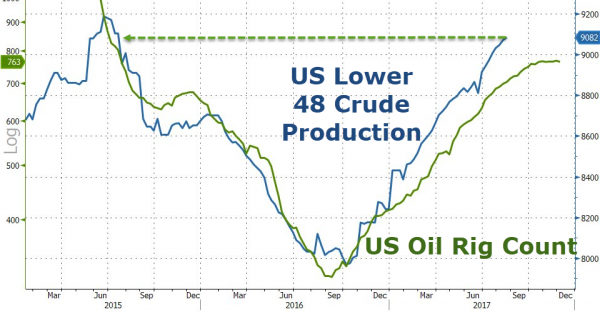
Despite stabilization in rig counts, US crude production continues to trend higher, jumping to its highest since July 2015 last week…
A weak dollar and some BTFDing in stocks managed to scramble WTI up to the pre-API levels ahead of the DOE data… (NOTE: futures puked a little right before the print). After the data, the machines were confused but the trend for now is higher as $48 stops are run…


Leave A Comment