Many clients are asking about our video the other night called “Short Term Bull, Longer Term Trapdoor” asking how did we know? In tonight’s video we show you the exact market analysis that led to the call. And watch tonight’s
August 31, 2017
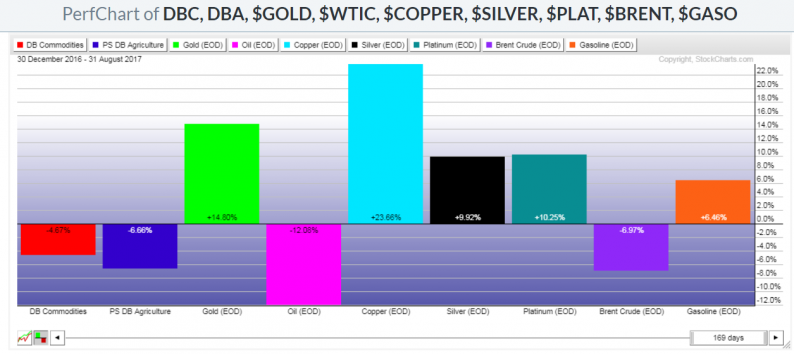
The following Year-to-Date and 2-Week graphs show which commodities (and commodity ETFs) have gained and lost the most (in terms of percentage) during those two time periods. The second graph illustrates the massive 18.92% gains made in Gasoline during these past two weeks…no doubt, in anticipation of, and with respect to,

On Thursday, share markets in India ended marginally higher. The BSE Sensex closed higher by 84 points and the NSE Nifty finished up 34 points. The Nifty50 settled the August series of derivatives contract above 9,900 thanks to gains in information technology stocks, realty stocks and automobile stocks. Adani Ports, Wipro and Tata
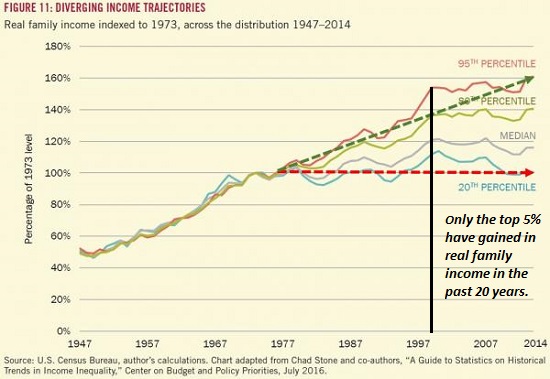
Despite all the happy talk about “recovery” and higher growth, wages have gone nowhere since 2000–and for the bottom 20% of workers, they’ve gone nowhere since the 1970s. Gross domestic product (GDP) has risen smartly since 2000, but the share

Today’s stock picks Long Ferrari (RACE) Long IHS Markit (INFO) Short Metlife (MET)
Since its founding in 1999, the New America Foundation – an important voice in policy debates on the American left – has received more than $21 million from Google, from its parent company’s executive chairman, Eric Schmidt, and from his
Are Millennials Hurting? One of the biggest worries some people for the stock market is that baby boomers retiring will take money out of the stock market causing valuations to fall from their current lofty heights. Obviously, the next generation

Friday morning’s jobs report is a fairly important news event – – – one on the calendar, at least, as opposed to these (ultimately meaningless) missile attack threats from the lunatics in North Korea. I’ll be watching the ES most
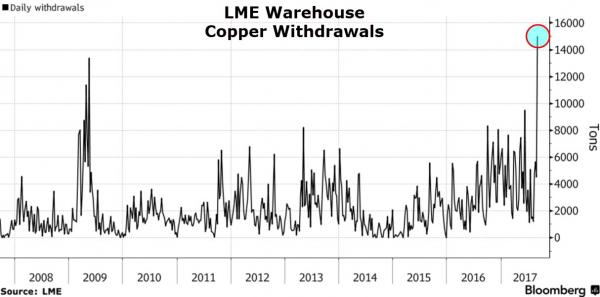
Buyers withdrew more copper from the London Metal Exchange’s global warehouse network on Wednesday than at any time since daily records began in 1996, extending a 19-day drop. As Bloomberg notes, while the net decline in percentage terms was also the biggest since
Most Active Equity Options And Strikes For The End Of Day, August 31, 2017