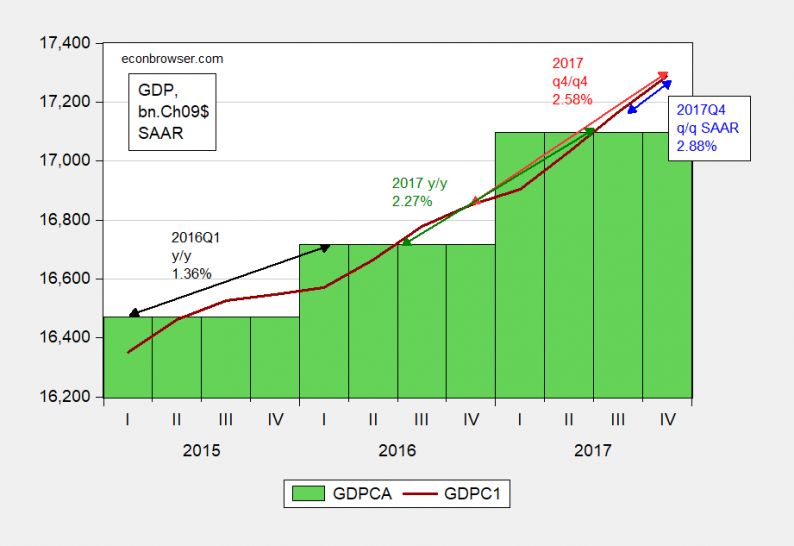
Why do reported growth rates differ for the same variable? Refer to the last three years of GDP data to see… Figure 1: Quarterly GDP, SAAR, FRED series GDPC1 (blue line), annual, FRED series GDPCA (green bars), in billions of Chained
April 19, 2018

I’d say short the blasted things, but they have earnings next week and a slew of housing numbers coming out, as well. And that is simply too risky to be taking a short position on. If you are associated with

The Federal Reserve has been determined to create “Wealth Effects” throughout the economy since 2008, which has left the majority of Main Street on the sidelines. The Fed’s objective was to make American households feel wealthier by pushing up the

Who noticed this one tiny thing on Bitcoin’s price chart: the rounded bottom in March/April of 2018? It is a small but extremely powerful signal, and it suggests that Bitcoin is back in a bull market in 2018! Many try to
It’s February of 2016 and the stock market has rallied over 250% off the 2008 lows in an almost uninterrupted bull market. But some cracks appeared to be showing. China was looking wobbly and the market had flash crashed a

The Conference Board Leading Economic Index (LEI) for the U.S improved this month – and the authors say “labor market components made negative contributions in March and bear watching in the near future.” Analyst Opinion of the Leading Economic Index
Stocks Rally Slightly On Wednesday This week has been great for equities as they rallied Wednesday again. It was a much smaller rally than the prior two days as the S&P 500 was up 0.08%. The chart below is my basic

Yesterday, for the umpteenth time in the last few years, we exposed the clear manipulation of VIX at the futures settlement auction – spiking VIX to favor the record long positioning of VIX futures speculators. With stocks quietly drifting sideways ahead

Bear markets are terrible for permabulls who just buy and hold forever. The stock market tanks 40%+ and it takes years for the stock market to recover to its previous all-time high. During those years these permabulls are underwater with massive
Cornflakes and milk may or may not be getting more expensive, but some higher-profile things are rocking like it’s 1979. Houses, for example: Home prices just took the biggest jump in four years (CNBC) – Homebuyers, hold onto your wallets.