
The bears lost an opportunity when they failed to sustain Bitcoin (BTC) below the $25,000 level this week. That may have attracted buying from the bulls who are attempting to start a recovery in Bitcoin and select altcoins.
Additionally, BlackRock’s application to launch a Bitcoin spot price exchange-traded fund and the sustained strength in the United States equities markets may have helped improve crypto sentiment. Bitcoin is on track to finish the week with a minor gain of 2% and institutional buying in the Grayscale Bitcoin Trust reduced its discount to Bitcoin spot from 44% on June 13 to 36.6%, according to CoinGlass data.

The strategy may be different for long-term investors who may use the dips to strong support levels to acquire the cryptocurrencies of their choice. It is prudent to adopt a staggered buying approach as a runaway rally is unlikely.
Let’s look at the top-5 cryptocurrencies that are trying to start a recovery in the short term.
Bitcoin price analysis
Bitcoin turned up sharply on June 15, trapping the aggressive bears who may have gone short on a break below $25,250. That may have caused a short squeeze in the near term, which propelled the price to the 20-day exponential moving average ($26,403).
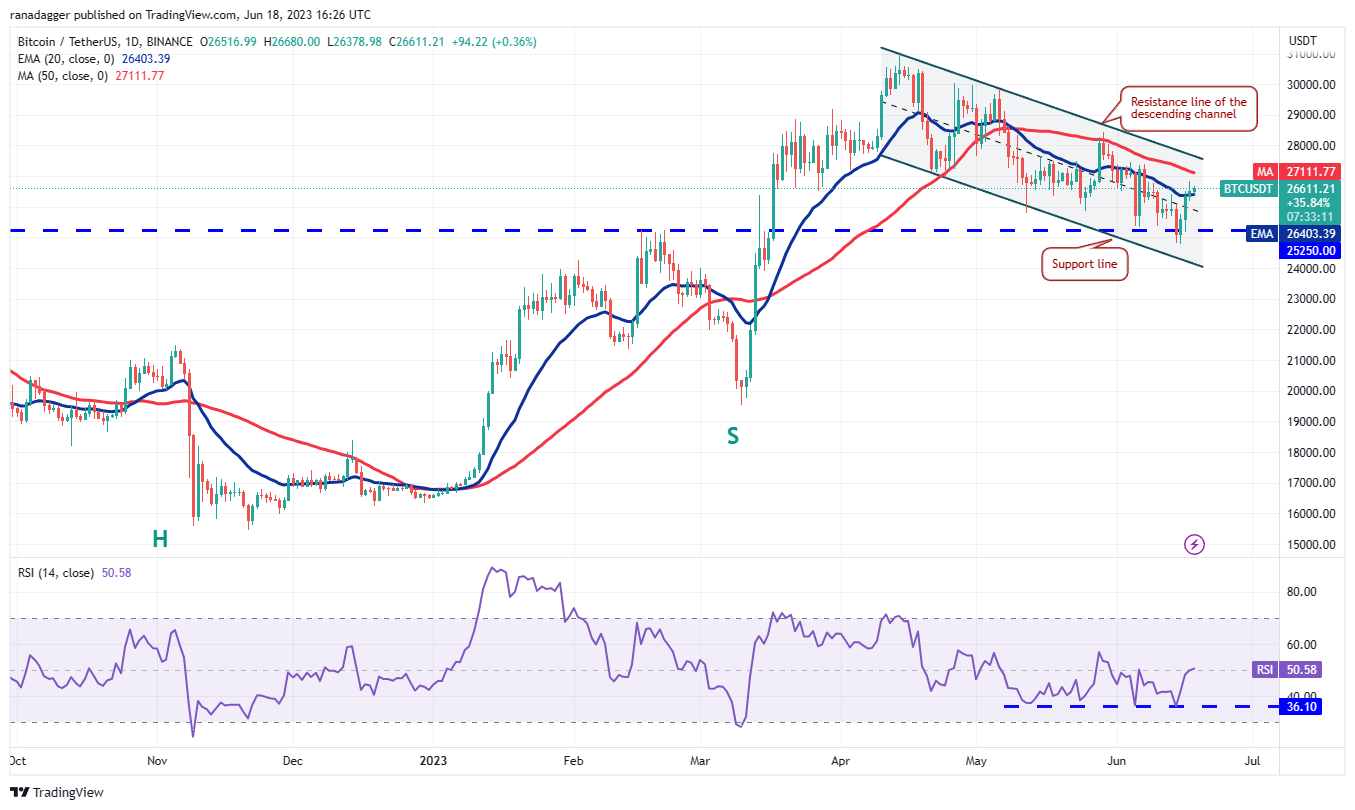
However, the bears are likely to have other plans as they will try to offer stiff resistance in the zone between the 20-day EMA and the resistance line of the descending channel. If the price turns down from this zone, the BTC/USDT pair may remain inside the channel for a while longer.
But if bulls drive the price above the channel, the pair will signal a potential trend change in the near term. The pair could then surge toward $31,000.
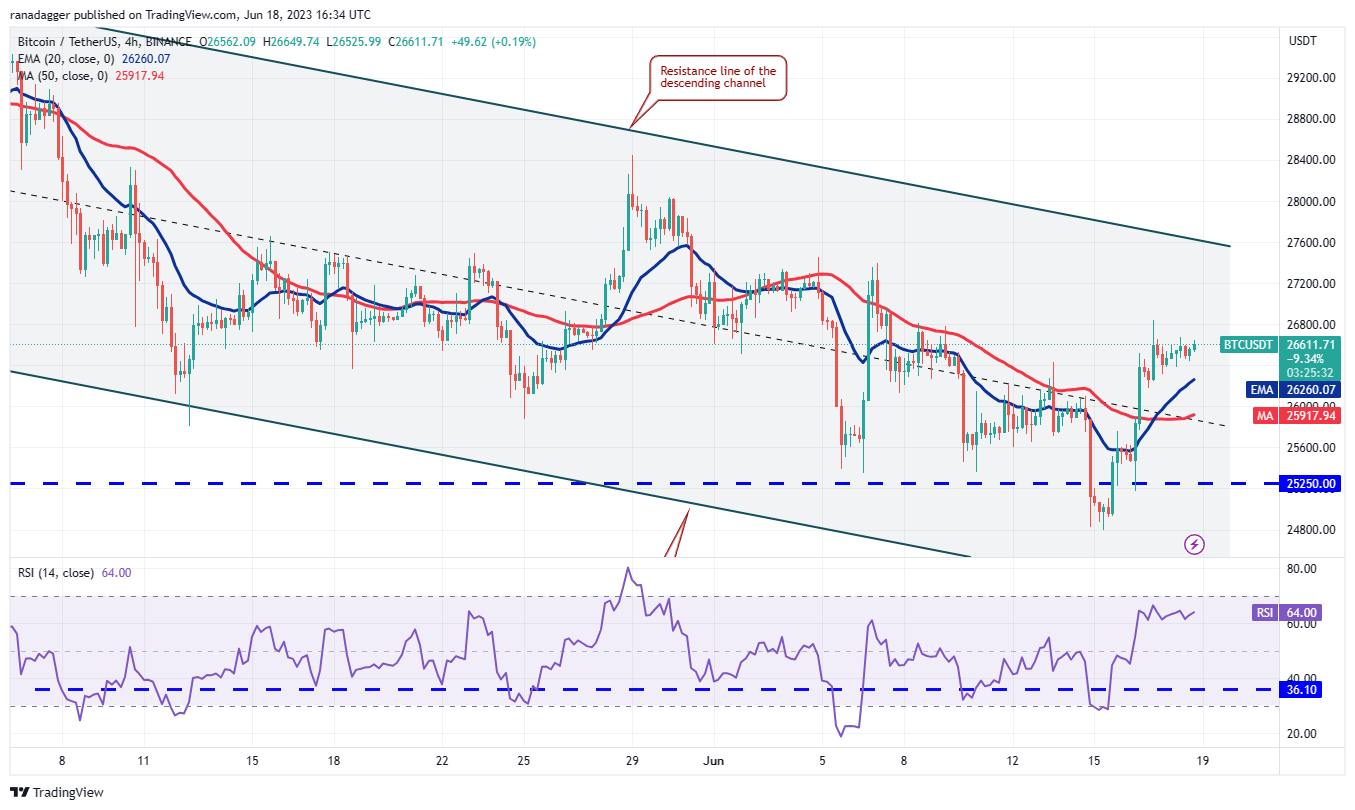
This positive view will invalidate in the short term if the price turns down and breaks below the 20-EMA. That could pull the price down to the 50-simple moving average and eventually to the strong support zone between $25,250 and $24,800. A break below this zone may intensify selling.
BNB price analysis
BNB (BNB) has been in the thick of things for the past few days but a positive sign is that the bulls did not allow the price to break the $220 support. This indicates demands at lower levels.
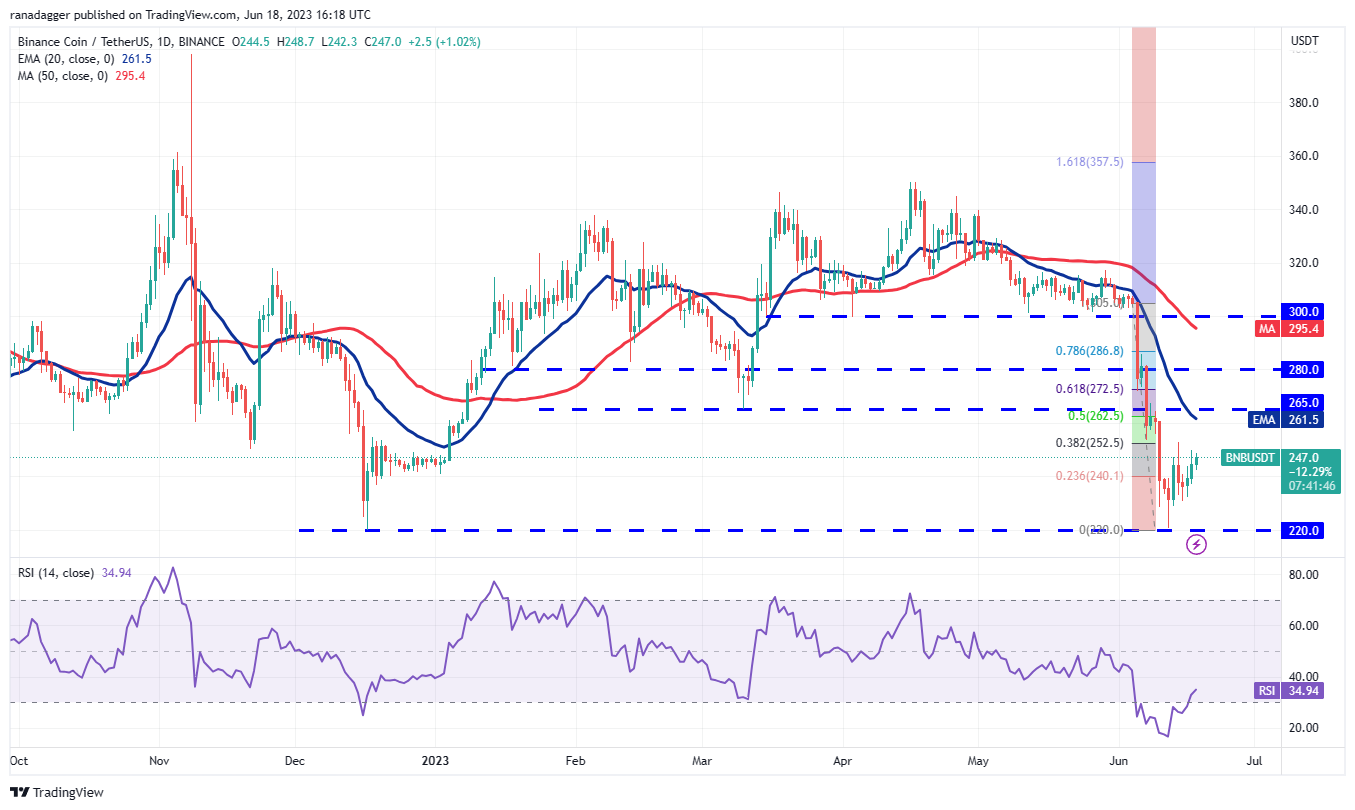
On the contrary, if bulls propel the price above the 20-day EMA, the pair could reach the 61.8% Fibonacci retracement level of $272.50. This is a crucial level for the bears to defend because if it gives way, the pair may soar toward $305.
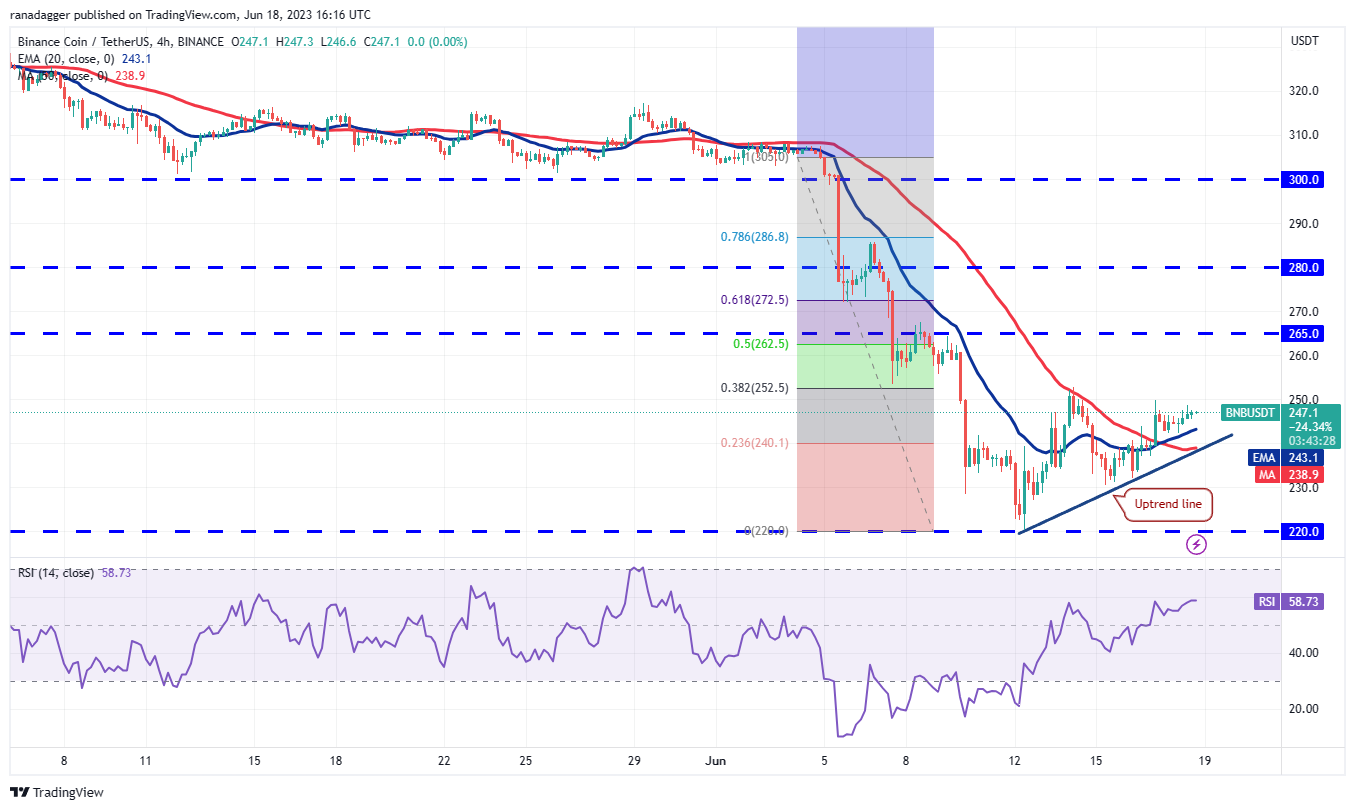
On the downside, the first support is at the 20-EMA. If this level breaks down, the pair could slip to the uptrend line. A break and close below this level will indicate that the bulls have given up. The pair could then retest the critical support at $220.
Litecoin price analysis
Litecoin (LTC) plunged below the symmetrical triangle pattern on June 10, indicating that bears have the upper hand. The sellers pulled the price below the immediate support at $75 on June 14 but could not build upon this move.

Contrary to this assumption, if the price turns down from the current level or the 20-day EMA and breaks below $70, it will signal the start of the downtrend. The first stop is likely to be $65 and then $60.
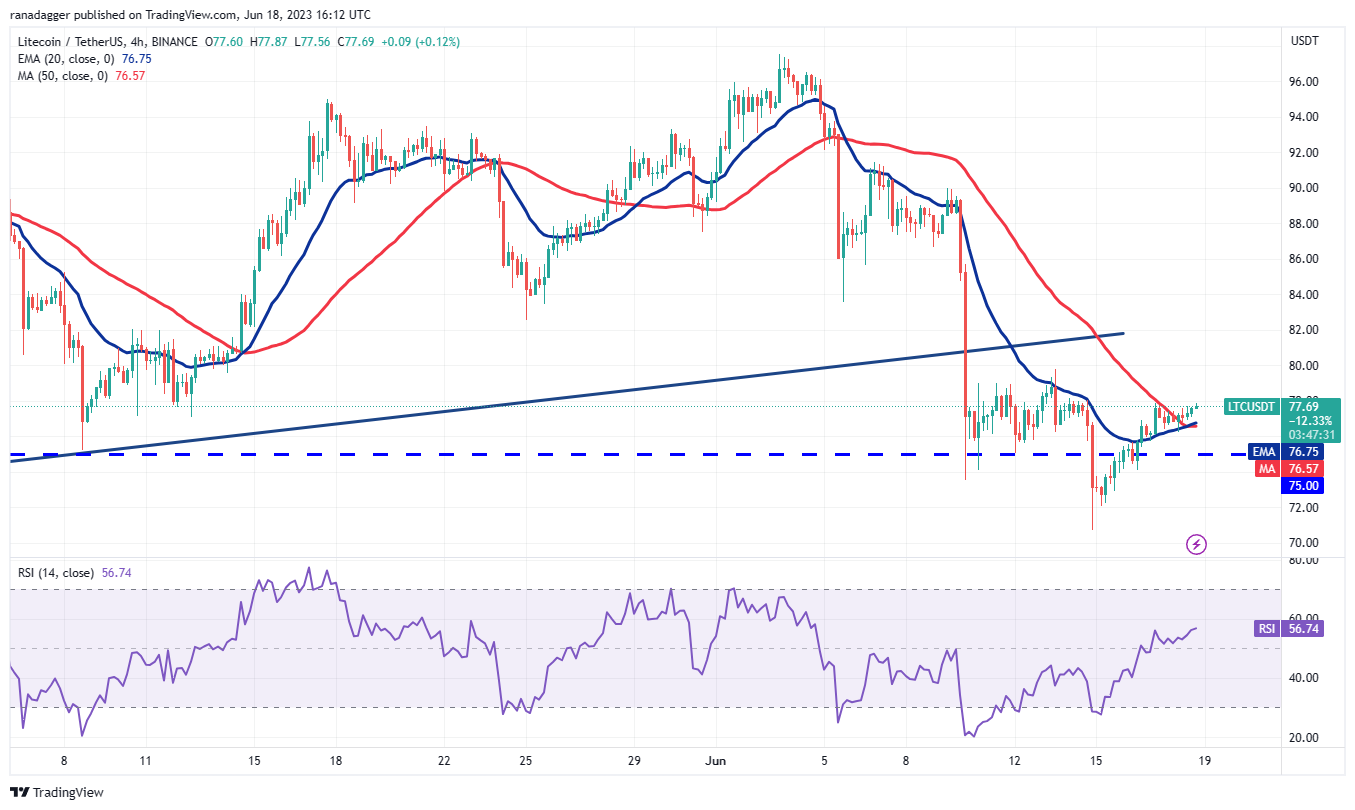
There is a minor resistance at $80 but if bulls overcome this obstacle, the pair may accelerate to $85 and thereafter to $90. If bears want to prevent the up-move, they will have to quickly yank the price back below $75.
Related: Binance sends cease and desist notice to fraudulent Nigerian entity
OKB price analysis
OKB (OKB) broke below the symmetrical triangle pattern on June 10, signaling the start of a deeper correction. A minor positive for the bulls is that they successfully defended the support at $30.50, indicating demand at lower levels.
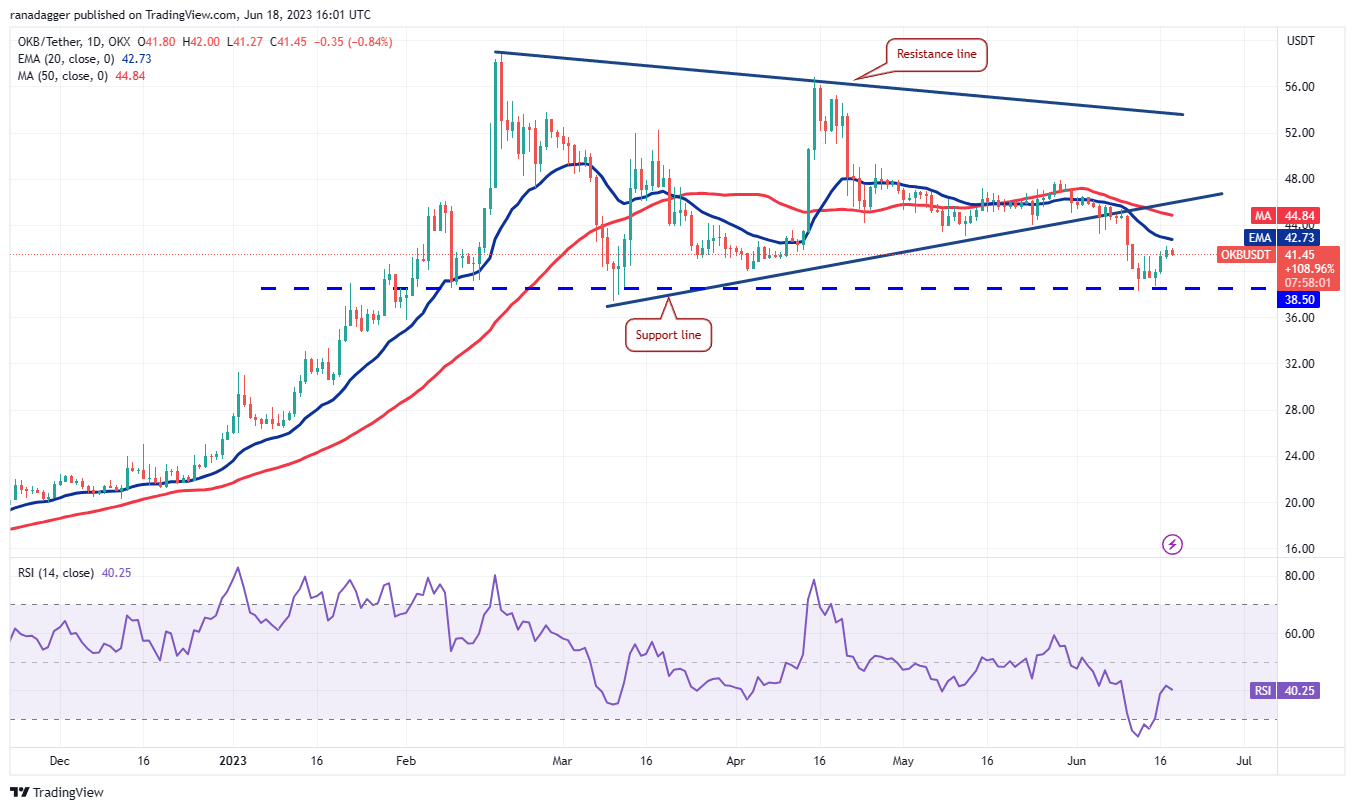
Contrarily, if buyers thrust the price above the 20-day EMA, it will suggest that the bears may be losing their grip. The pair could then rise to the support line, which is likely to act as a formidable resistance. Buyers will have to kick the price above $48 to gain the upper hand.

If buyers thrust the price above $42.39, the pair may pick up momentum and soar to $46 where the bears are again expected to mount a strong defense.
Another possibility is that the price turns down and tumbles below the 20-EMA. That may indicate a possible range-bound action between $38.50 and $42.39 for some time.
Quant price analysis
Quant (QNT) rebounded off the $95 level with strength on June 16, indicating aggressive buying at the support.
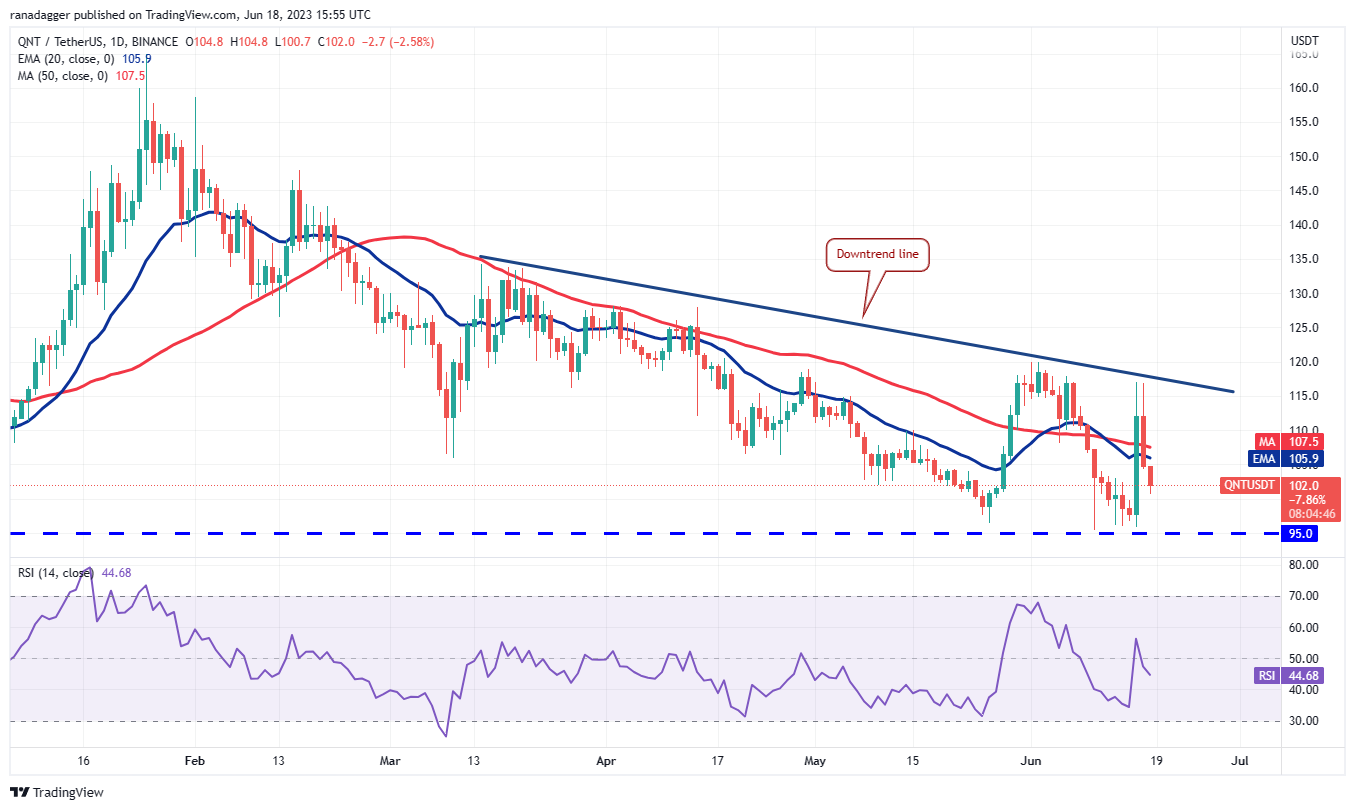
If the price turns up from $95 once again, it will enhance the prospects of a rally above the downtrend line. If that happens, the pair may start a strong recovery that could catapult the price to $135.
This positive view could invalidate in the near term if the price continues lower and plummets below $95. The pair may then slip to $87 and subsequently to $80.
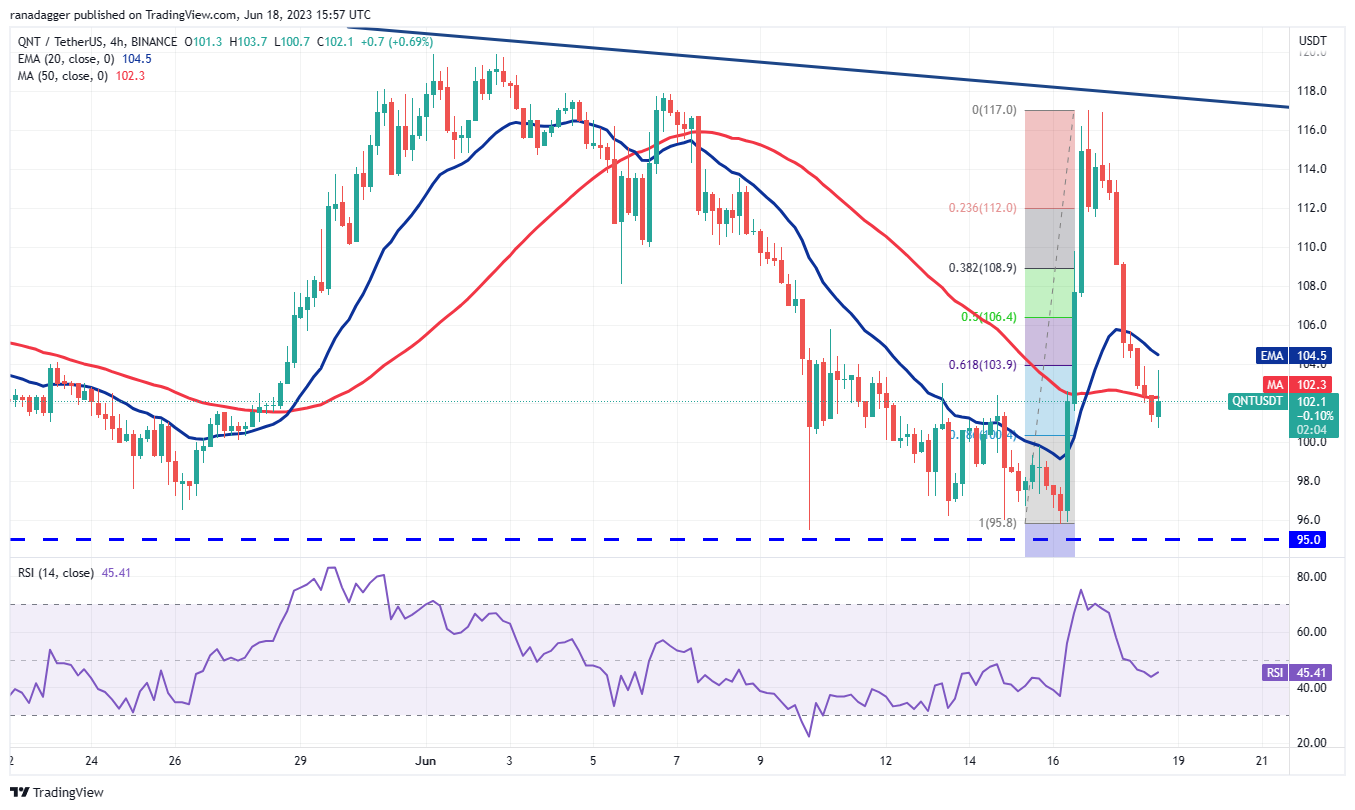
Buyers will have to quickly drive the price back above the moving averages if they want to have another shot at the downtrend line. Alternatively, if the price sustains below the 50-SMA, the likelihood of a drop to $95 increases.
This article does not contain investment advice or recommendations. Every investment and trading move involves risk, and readers should conduct their own research when making a decision.
This article is for general information purposes and is not intended to be and should not be taken as legal or investment advice. The views, thoughts, and opinions expressed here are the author’s alone and do not necessarily reflect or represent the views and opinions of Cointelegraph.

Leave A Comment