
Bitcoin (BTC) has been trading in a tight range since Thanksgiving Nov. 24, as traders are uncertain about the next directional move. Usually, in a bear market, analysts tend to become uber-bearish and project targets that tend to scare away investors.
The failure of Bitcoin to start a strong recovery has given rise to several bearish targets, which extend up to $6,000 on the downside.
Although anything is possible in a bear market, traders who have a long-term view could try to accumulate fundamentally strong coins in several tranches. Because a bottom will only be confirmed in hindsight and trying to time it is usually a futile exercise.
The cryptocurrencies that lead the market out of the bear phase generally tend to do well when the next bull market begins. Let’s look at the charts of the cryptocurrencies that are trying to start an up-move in the short term.
BTC/USDT
Bitcoin has been consolidating between $15,588 and $17,622 for the past few days. The relative strength index (RSI) has formed a bullish divergence, suggesting that the selling pressure could be reducing.
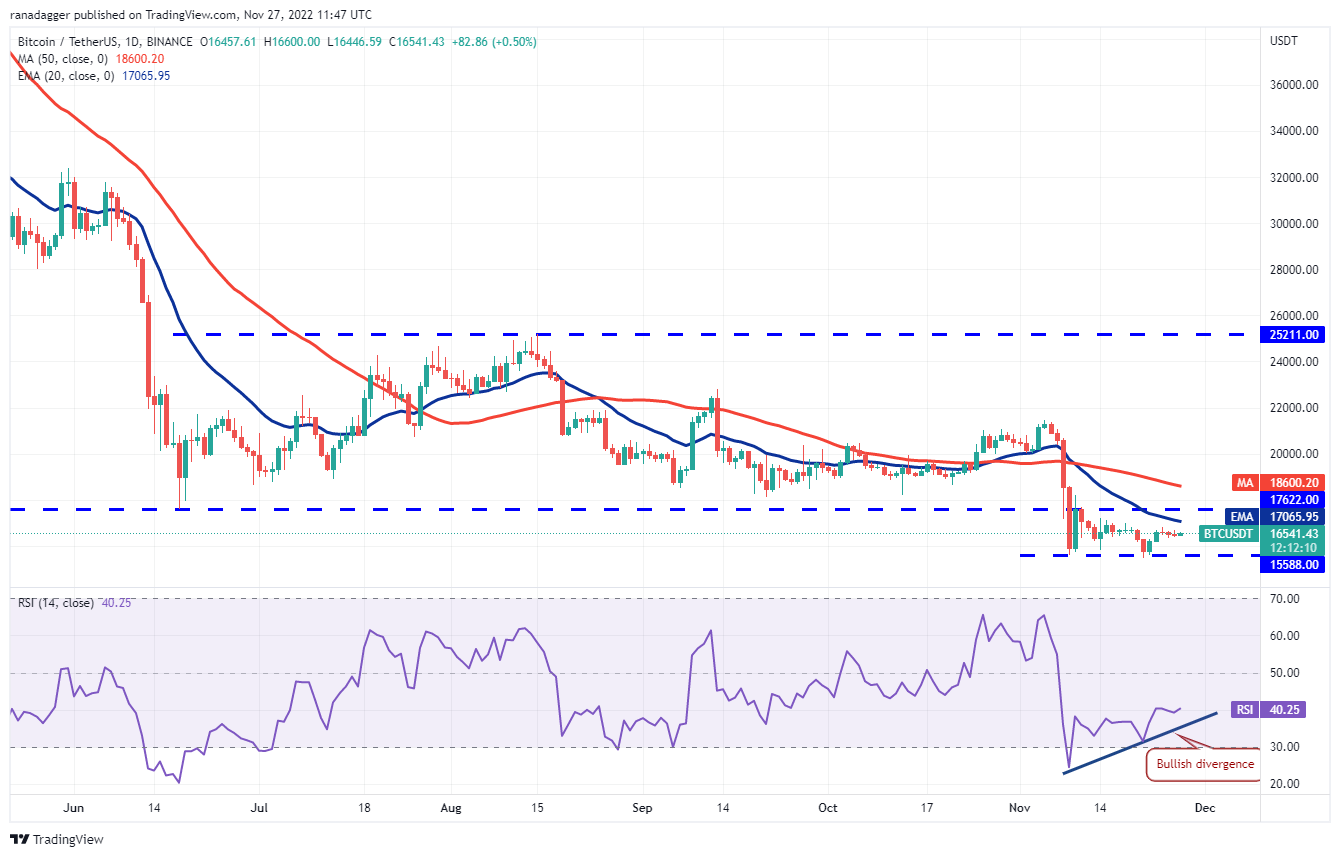
If buyers catapult the price above the overhead zone, it will suggest that the downtrend may be ending. The 50-day simple moving average ($18,600) may act as a minor hurdle but if crossed, the up-move could reach the psychological level of $20,000.
Alternatively, if the price turns down from the overhead resistance and breaks below $15,588, it could signal the resumption of the downtrend. The pair could then drop to $13,554.
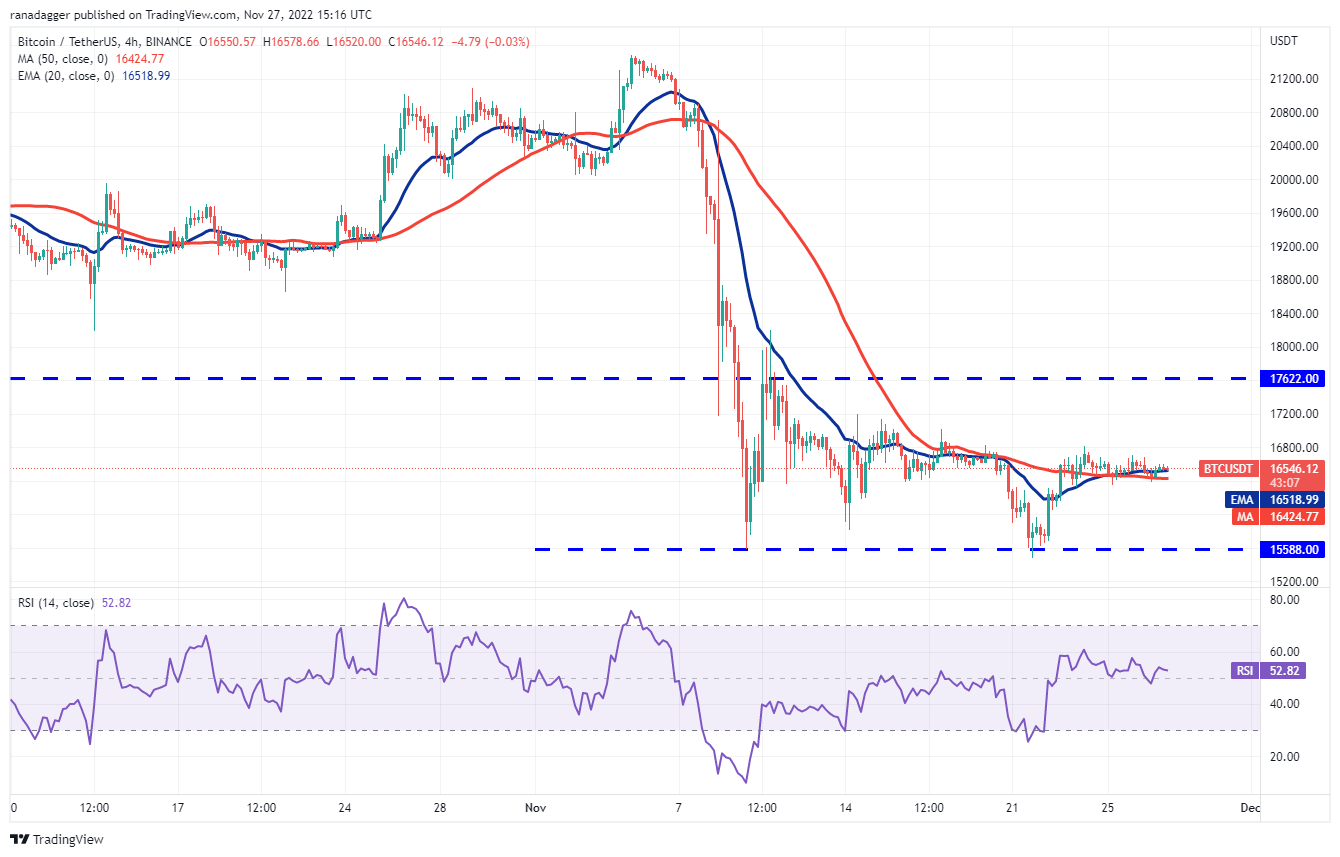
Instead, if the price slips below $16,000, the pair could drop to the critical support zone between $15,588 and $15,476. A break below this zone could accelerate selling and start the next leg of the downtrend.
DOGE/USDT
Dogecoin (DOGE) broke above the overhead resistance at $0.09 on Nov. 25 but the bears pulled the price back below the level on Nov. 26. Buyers regrouped and pushed the price above the 38.2% Fibonacci retracement level of $0.10 on Nov. 27.
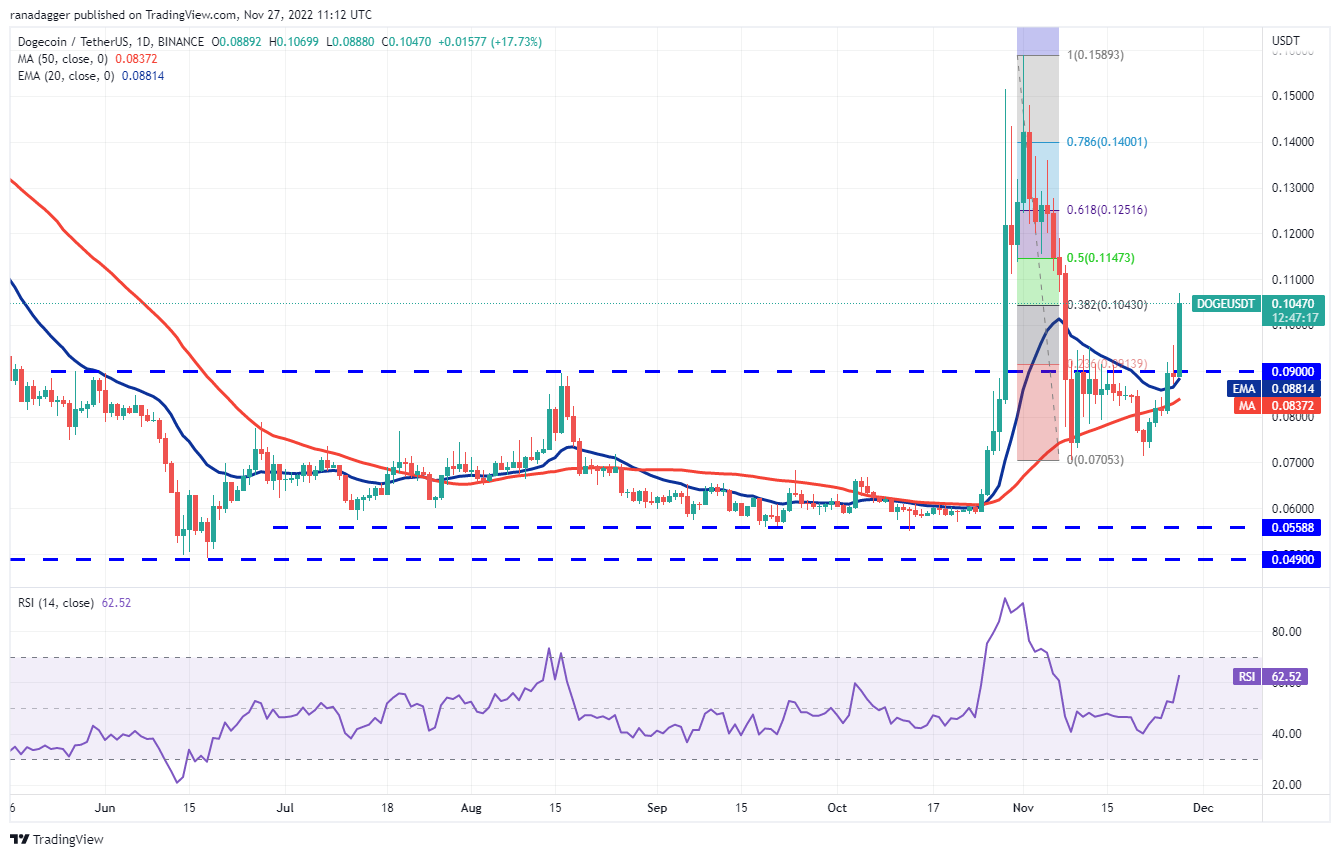
On the other hand, if the price turns down from the current level, it will suggest that bears continue to view the rallies as a selling opportunity. The pair could then decline to $0.09. If this support gives way, the 50-day SMA ($0.08) could be challenged.
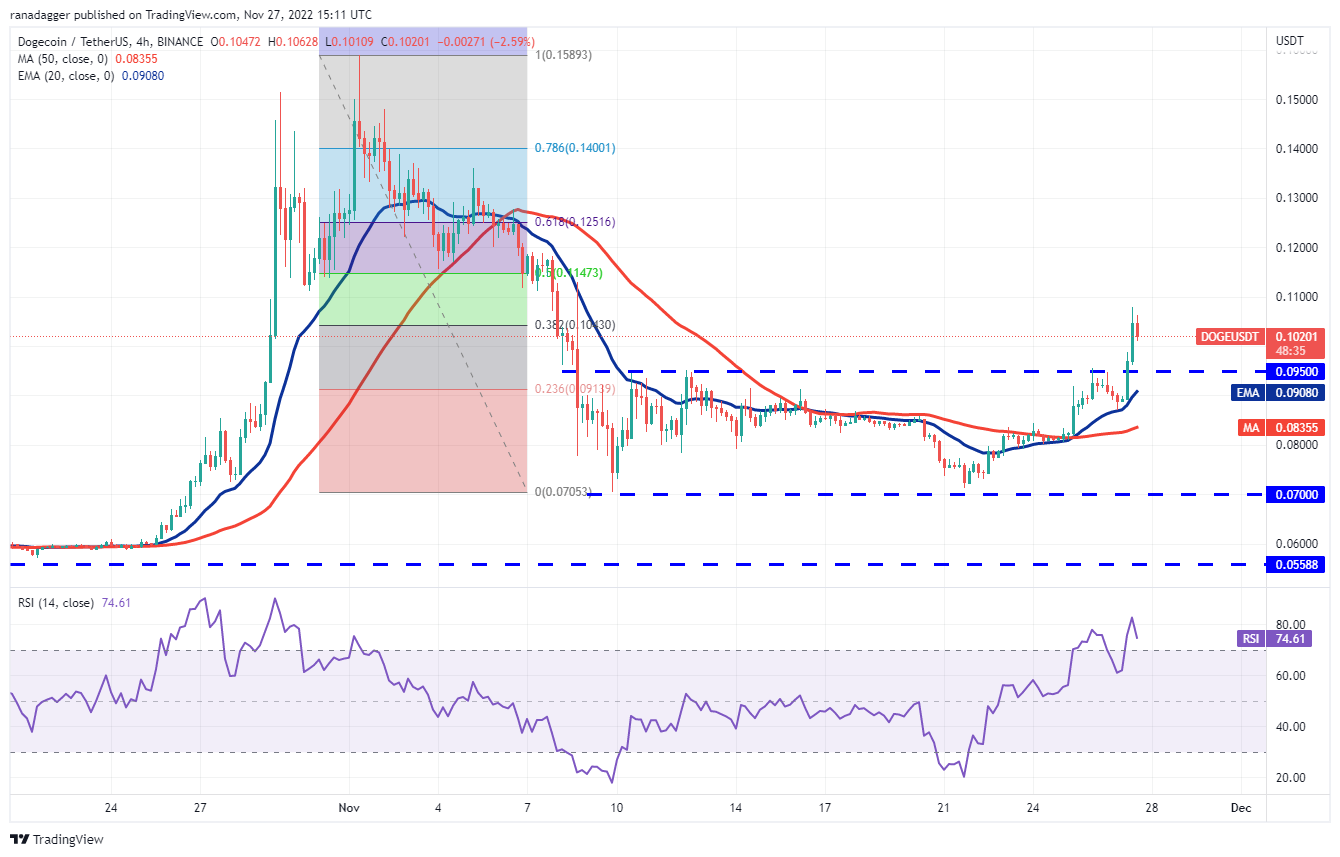
If the price turns down from the 38.2% Fibonacci retracement of $0.10 but rebounds off the breakout level, it will suggest that the sentiment has turned positive and traders are buying on dips. The bulls will then try to resume the uptrend. The target objective of the breakout from the range is $0.12.
This positive view could invalidate in the near term if the price turns down and re-enters the range. The pair could then drop to the 50-SMA.
LTC/USDT
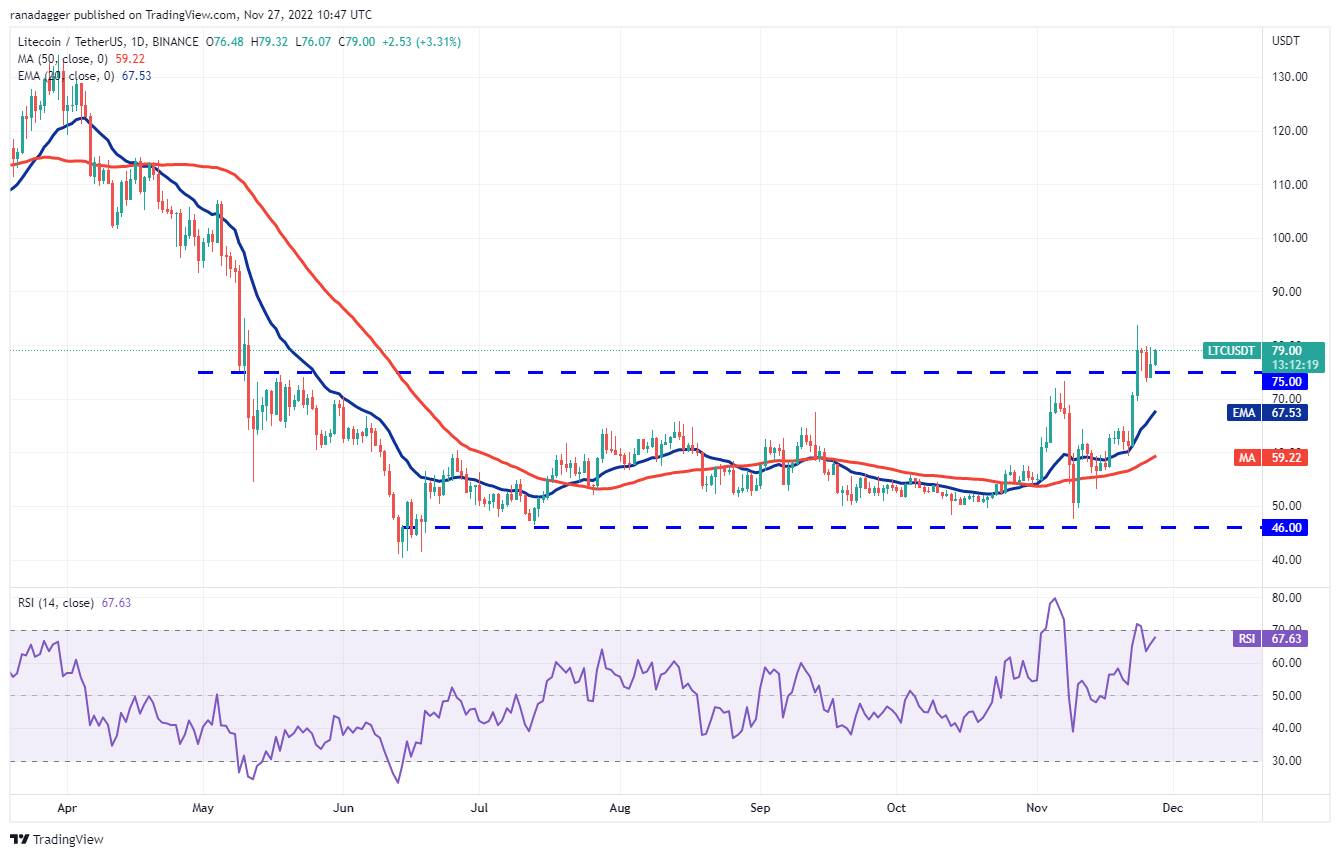
Litecoin’s (LTC) breakout above the overhead resistance at $75 is the first indication of a potential trend change. The bears tried to pull the price back below $75 and trap the aggressive bulls but the buyers held their ground.
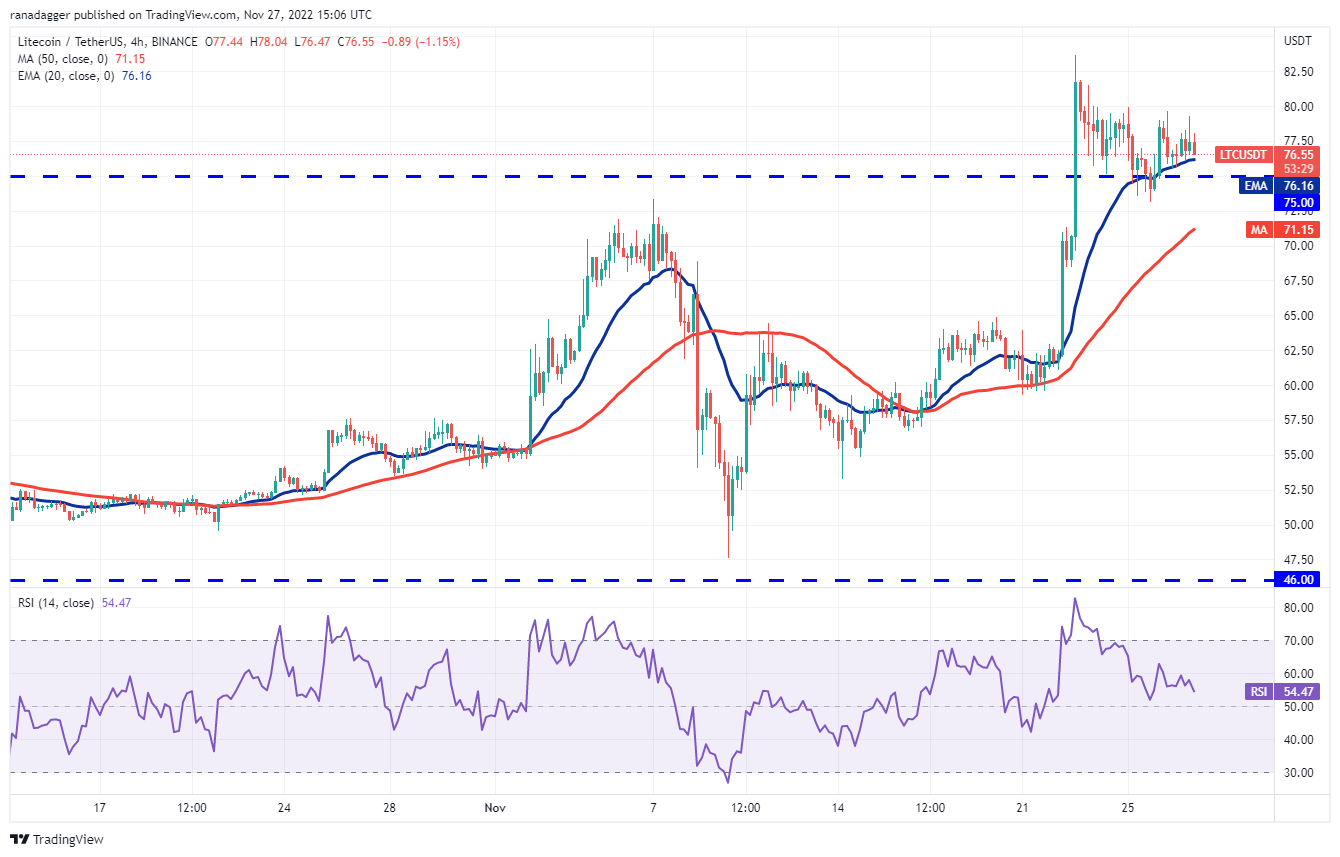
Conversely, if the price turns down from $84, the pair could slide to the $73 to $75 support zone. If this zone breaks down, the pair could slide to the 20-day EMA. The bears will have to pull the price below this support to trap the aggressive bulls.
If the price rebounds off the 20-day EMA, the bulls will again try to kick the pair above $84 and start the uptrend.
There is a minor resistance at $80, but if bulls thrust the price above this level, the pair could rise to $84. The pair could then attempt a rally to $96. If bears want to invalidate this view in the short term, they will have to pull the pair below $73.
Related: Bitcoin mining revenue lowest in two years, hash rate on the decline
LINK/USDT
Chainlink (LINK) has been range-bound between $5.50 and $9.50 for the past many weeks. The strong rebound off the support at $5.50 on Nov. 21 suggests that bulls are aggressively buying the dips to this level.
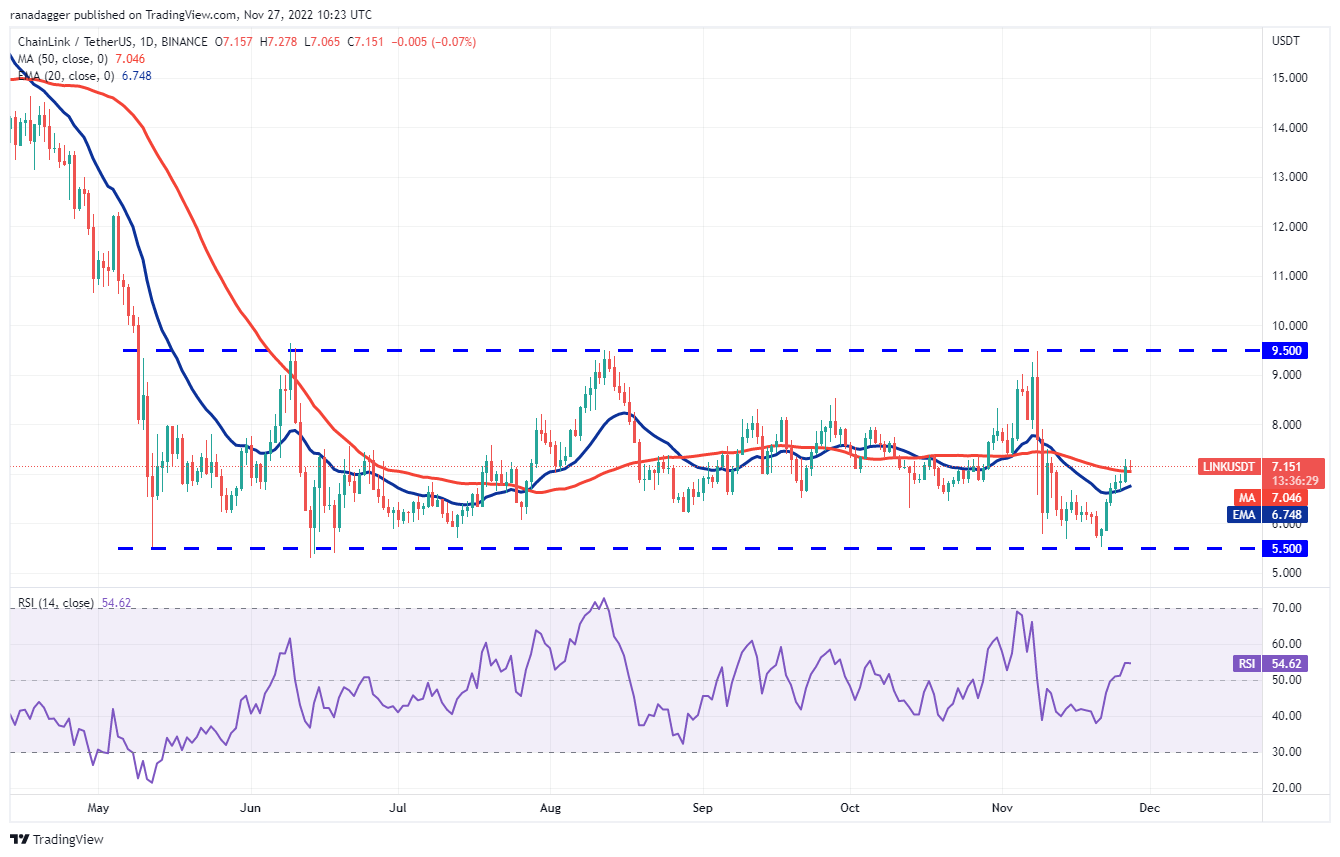
Contrary to this assumption, if the price turns down and breaks below the 20-day EMA, it will suggest that bears are active at higher levels. The LINK/USDT pair could then again drop toward the support at $5.50 and consolidate near it for a few more days.
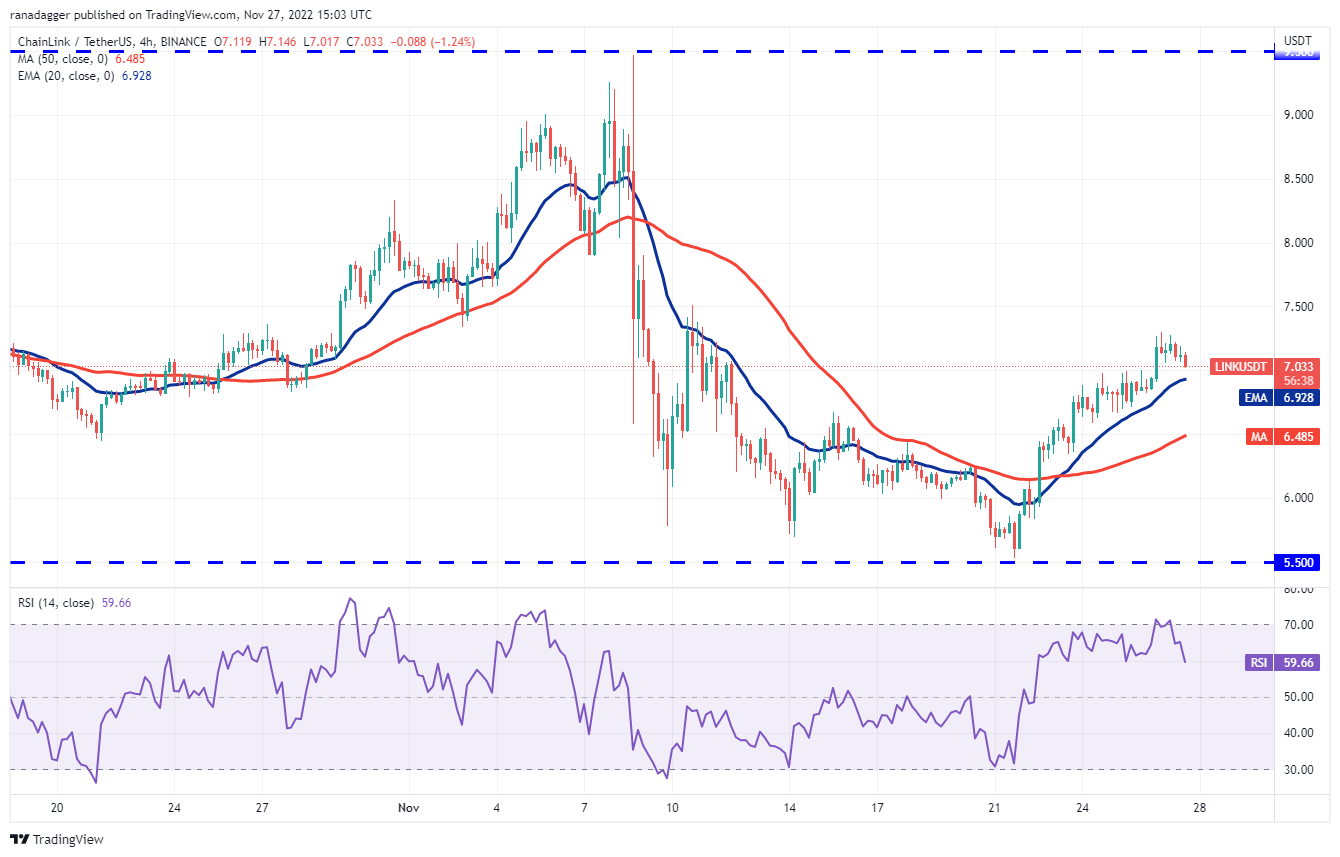
Another possibility is that the price turns down from $7.50 but rebounds off the 20-EMA. The bulls will then again try to drive the price above $7.50 and start the northward march toward $8.50.
APE/USDT
ApeCoin (APE) has been consolidating in a large range between $3 and $7.80 for the past several months. The bears tried to sink the price below the support of the range but could not sustain the lower levels. This suggests strong demand at lower levels.
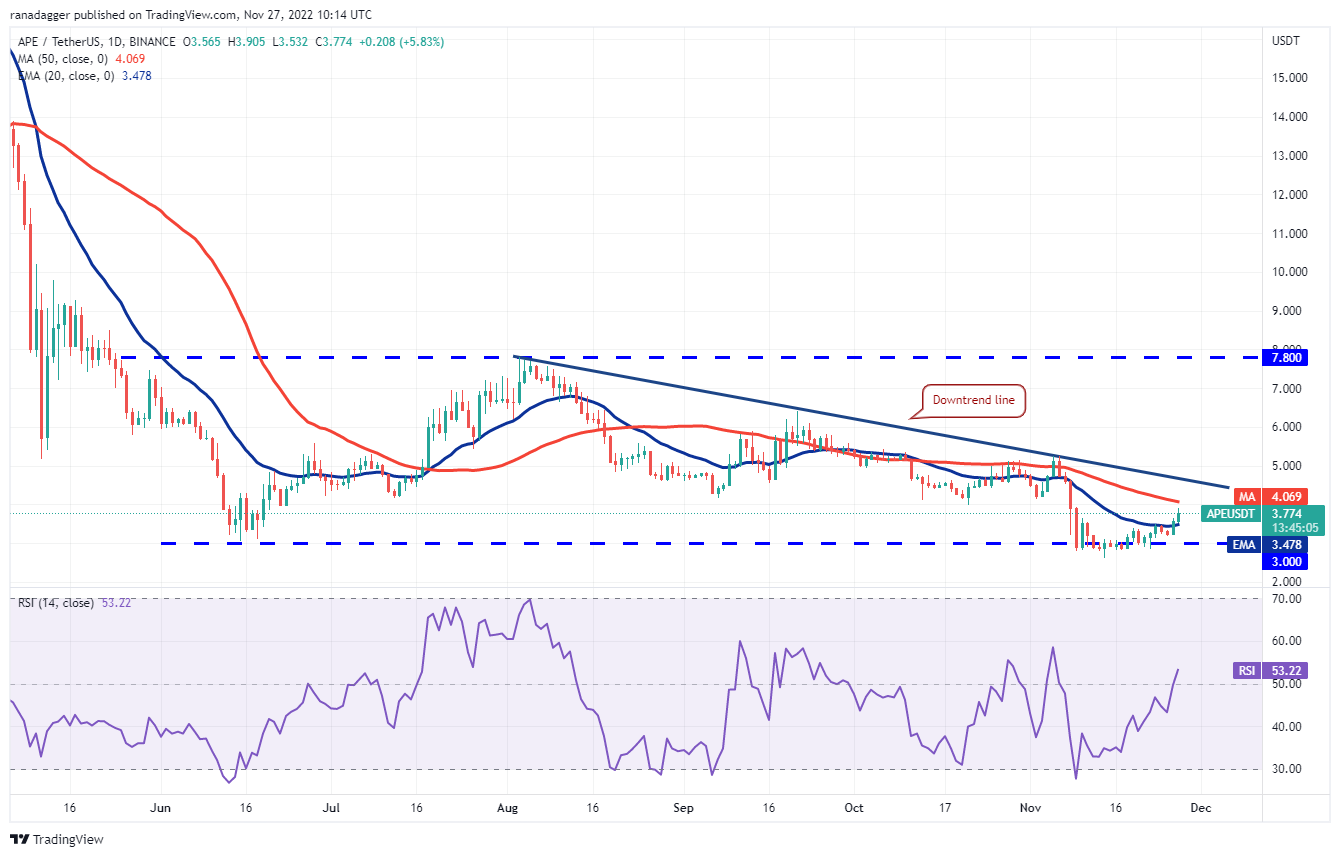
If the price turns down from the downtrend line, the pair could decline to the 20-day EMA. If the pair rebounds off this level, it will suggest that the sentiment has shifted from selling on rallies to buying on dips. That could improve the prospects of a break above the downtrend line. The pair could then climb to $6.
On the contrary, if the price turns down from the downtrend line and breaks below the 20-day EMA, the pair could again slide to the strong support at $3.
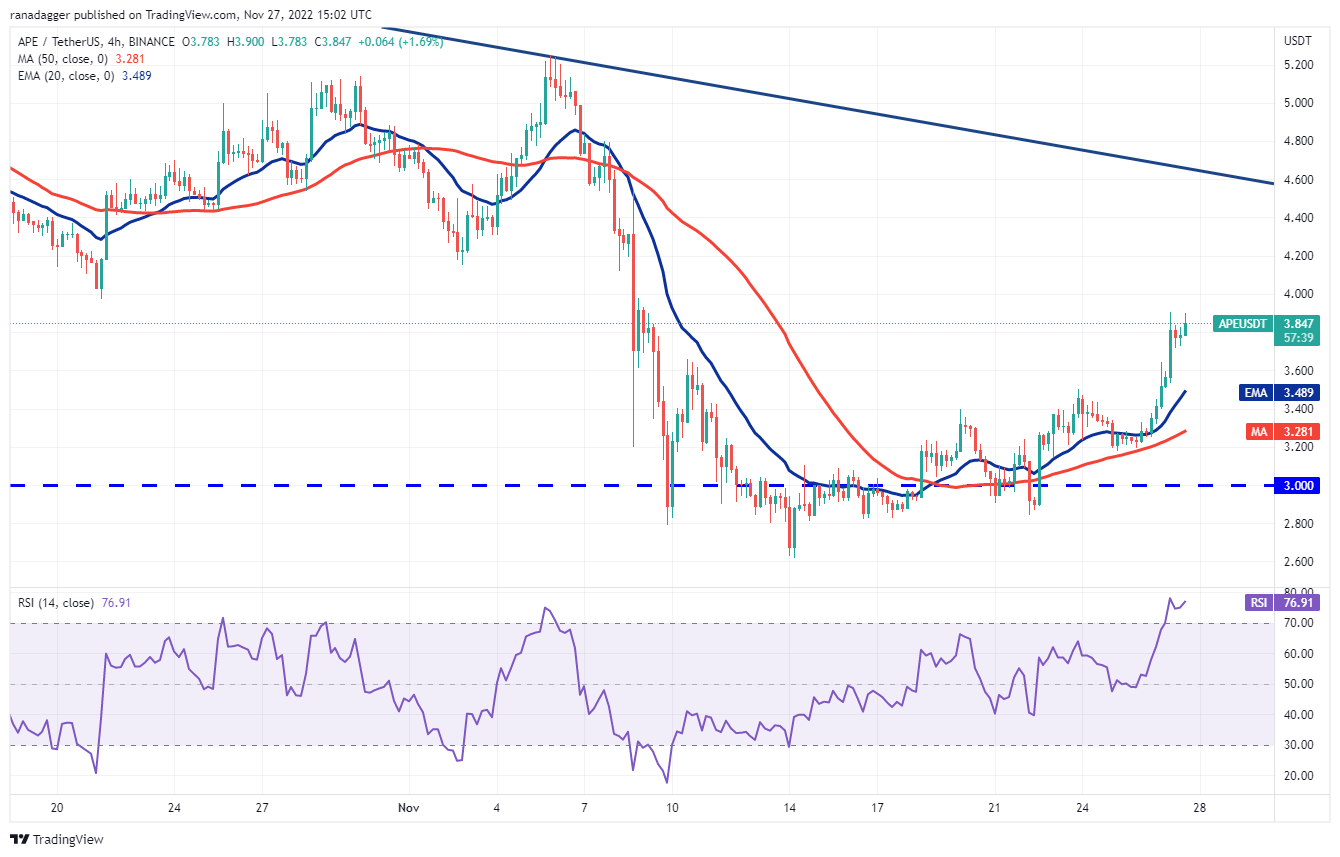
This positive view could be invalidated in the near term if the price turns down and breaks below the 50-SMA. Such a move will suggest that bears continue to sell on rallies. The pair could then drop to $3.
The views and opinions expressed here are solely those of the author and do not necessarily reflect the views of Cointelegraph. Every investment and trading move involves risk, you should conduct your own research when making a decision.

Leave A Comment