
Bitcoin (BTC) is struggling to rise above the overhead resistance at $31,000 but a minor positive is that the bulls have not allowed the price to dive below the $29,500 support. This suggests that a catalyst may be needed for the price to break out from its range.
On the macroeconomic front, the Federal Reserve’s meeting on July 25 and 26 is an important event to keep an eye on. The FedWatch Tool shows a 99.2% probability of a 25 basis point rate hike in the meeting. If that happens, the markets may not witness a knee-jerk reaction as the hike seems to have been priced in. However, any surprise move by the Fed could thrust the price out of the range.

If Bitcoin moves higher, select altcoins could attract buyers. Let’s study the charts of top-5 cryptocurrencies that could turn positive over the next few days.
Bitcoin price analysis
Bitcoin remains pinned below the 20-day exponential moving average ($30,036) for the past few days but a positive sign is that the bears have not been able to sink the price to the 50-day simple moving average ($28,979).
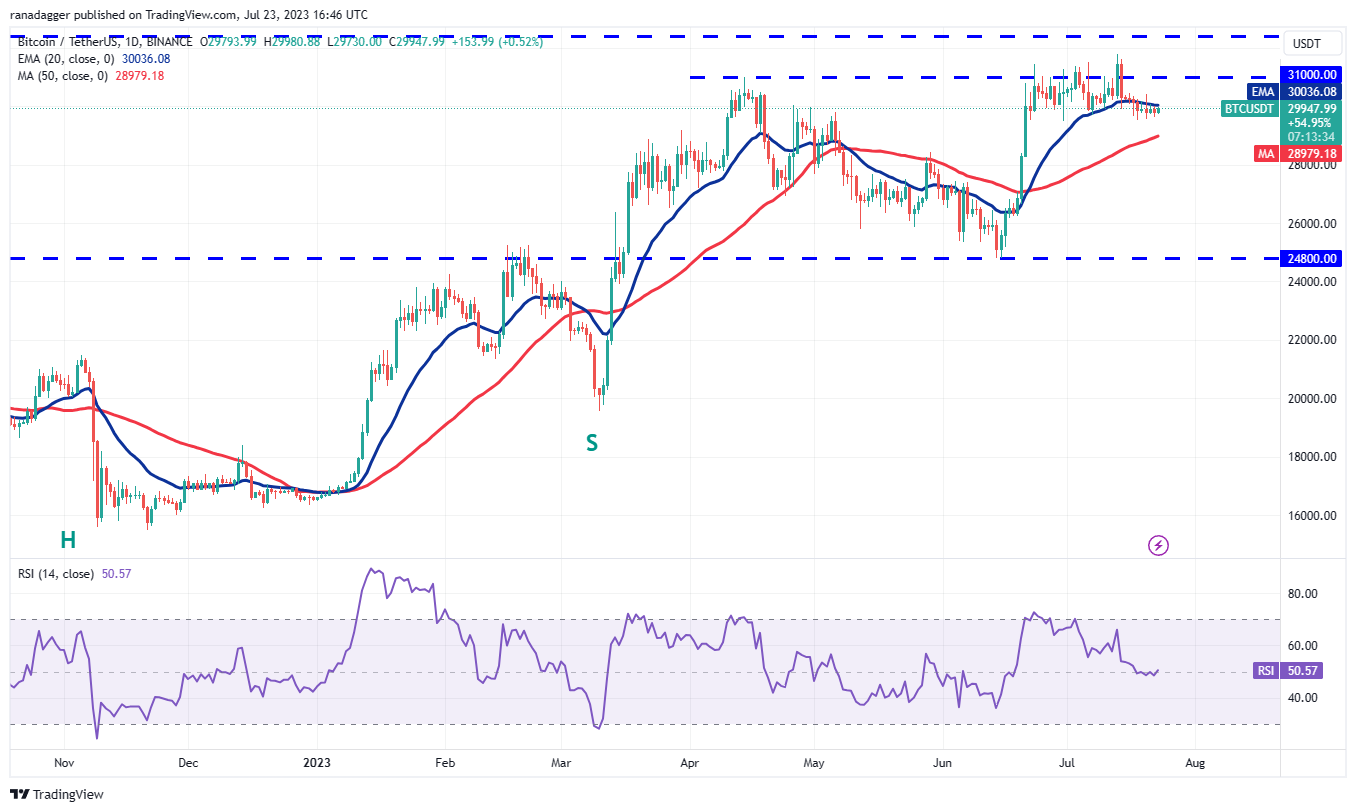
If the price breaks above the 20-day EMA, the pair could rally toward the overhead resistance of $31,000. A charge above the $31,000 to $32,400 zone could clear the path for a possible rally to $40,000.
On the other hand, if the price turns down and dives below the 50-day SMA, it will suggest that bears are making a comeback. The pair may then slump toward the support at $24,800.
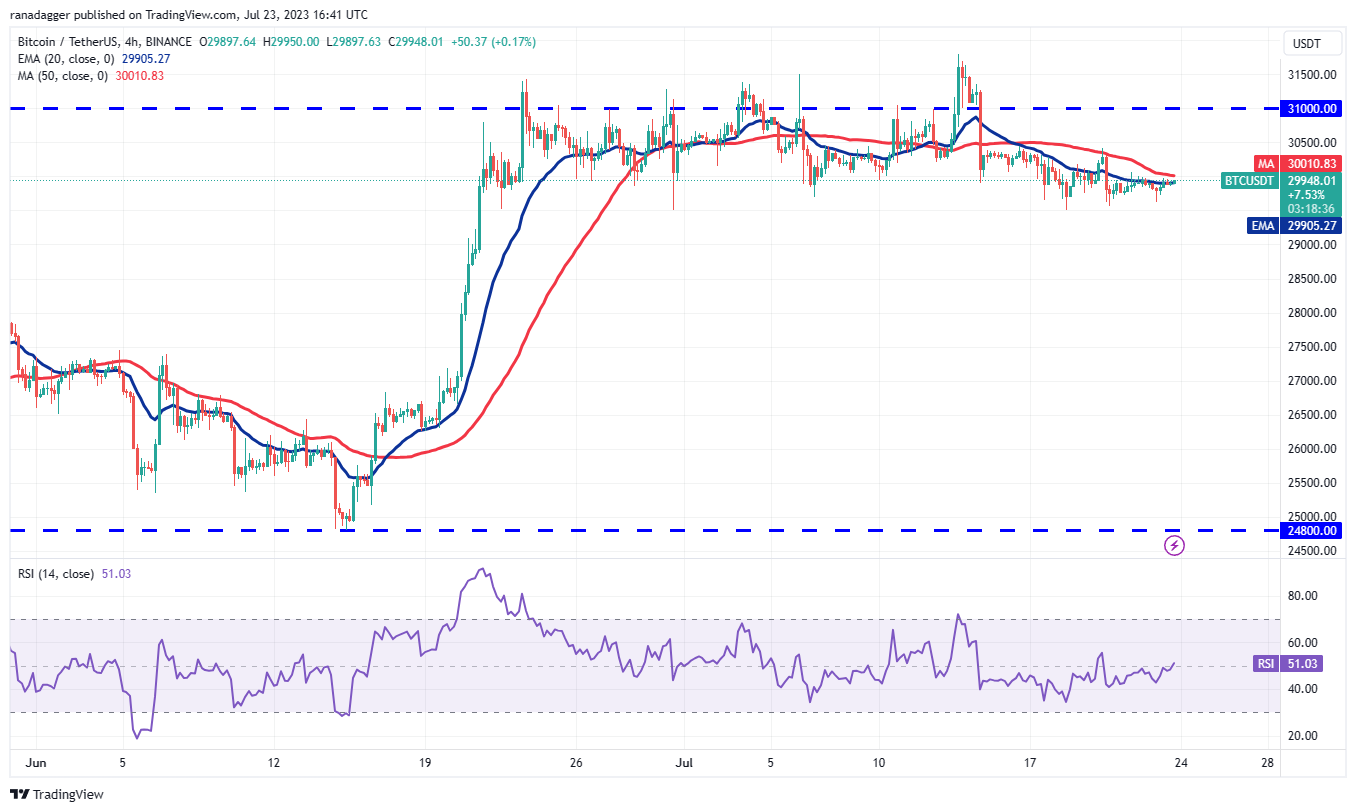
If bulls push the price above the 50-SMA, the pair could attempt a rally to $30,500 and then to $31,000. The important support to watch on the downside is $29,500. If this level crumbles, the pair may decline to $27,500.
Chainlink price analysis
Chainlink (LINK) has been trading inside a large range between $5.50 and $9.50 for the past several months. The bears pulled the price below the range on Jun 10 but they could not build upon this advantage.
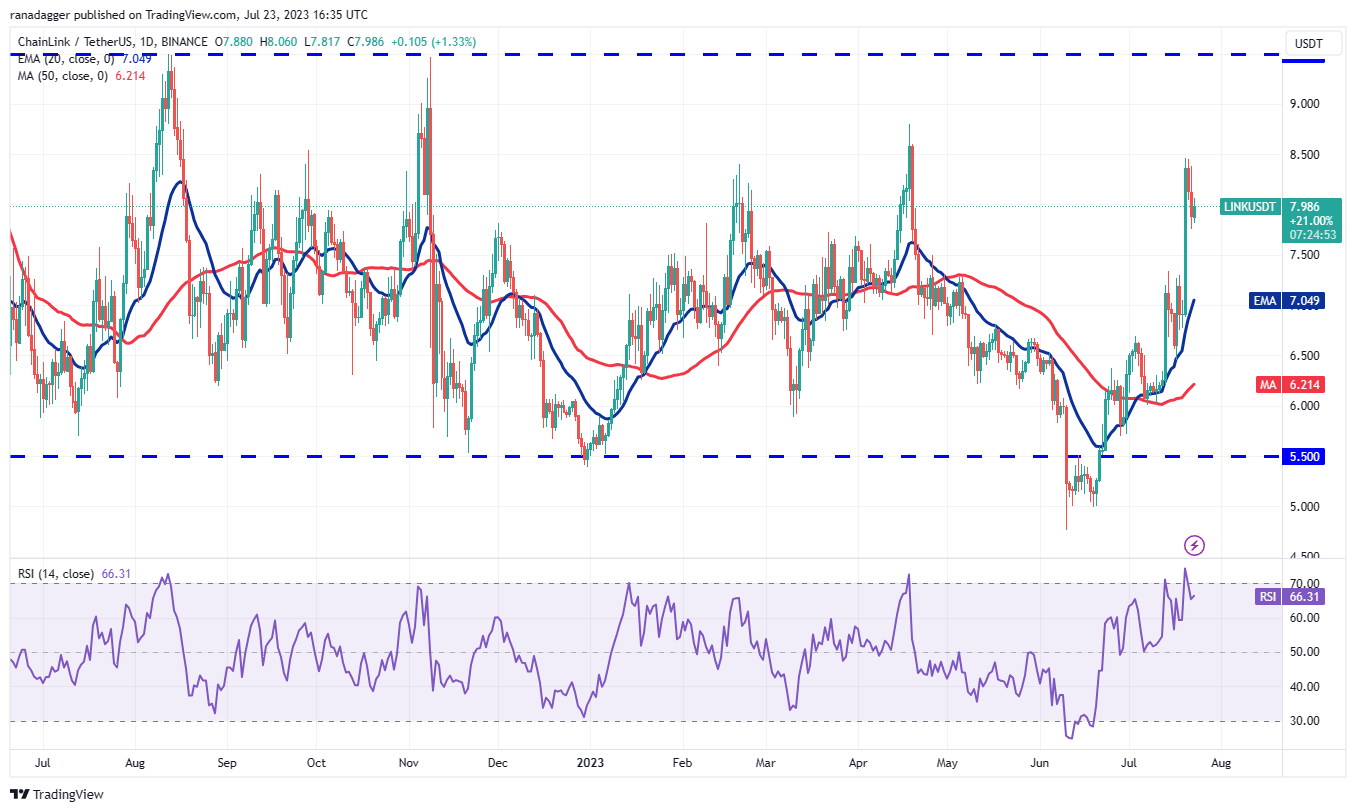
The bears will try to stall the up-move in the zone between $8.50 and $8.80 but if buyers bulldoze their way through, the pair may soar to $9.50. The important support to watch on the downside is $7.50 and then the 20-day EMA ($7.05).

This positive view will be negated in the near term if the price turns down and plummets below the 20-EMA. That could tempt short-term bulls to book profits, pulling the price down to the 50-SMA and subsequently to $6.50.
Filecoin price analysis
Filecoin (FIL) is trying to form an inverse head and shoulders pattern, which will complete on a break and close above the neckline.
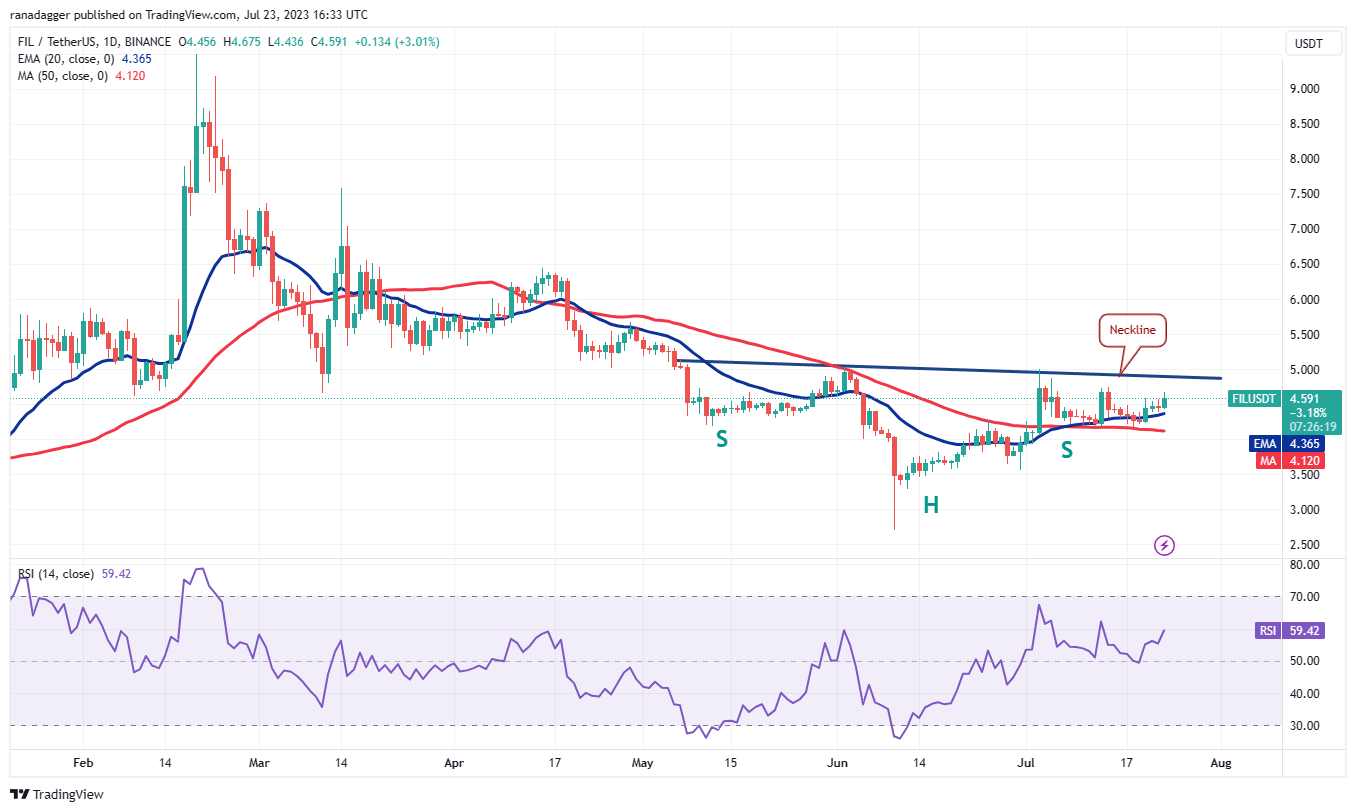
On the contrary, if the price turns down sharply from the neckline and breaks below the 50-day SMA ($4.12), it will suggest that the bulls have lost their grip. The pair may then skid to $3.50 and later to $3.29.
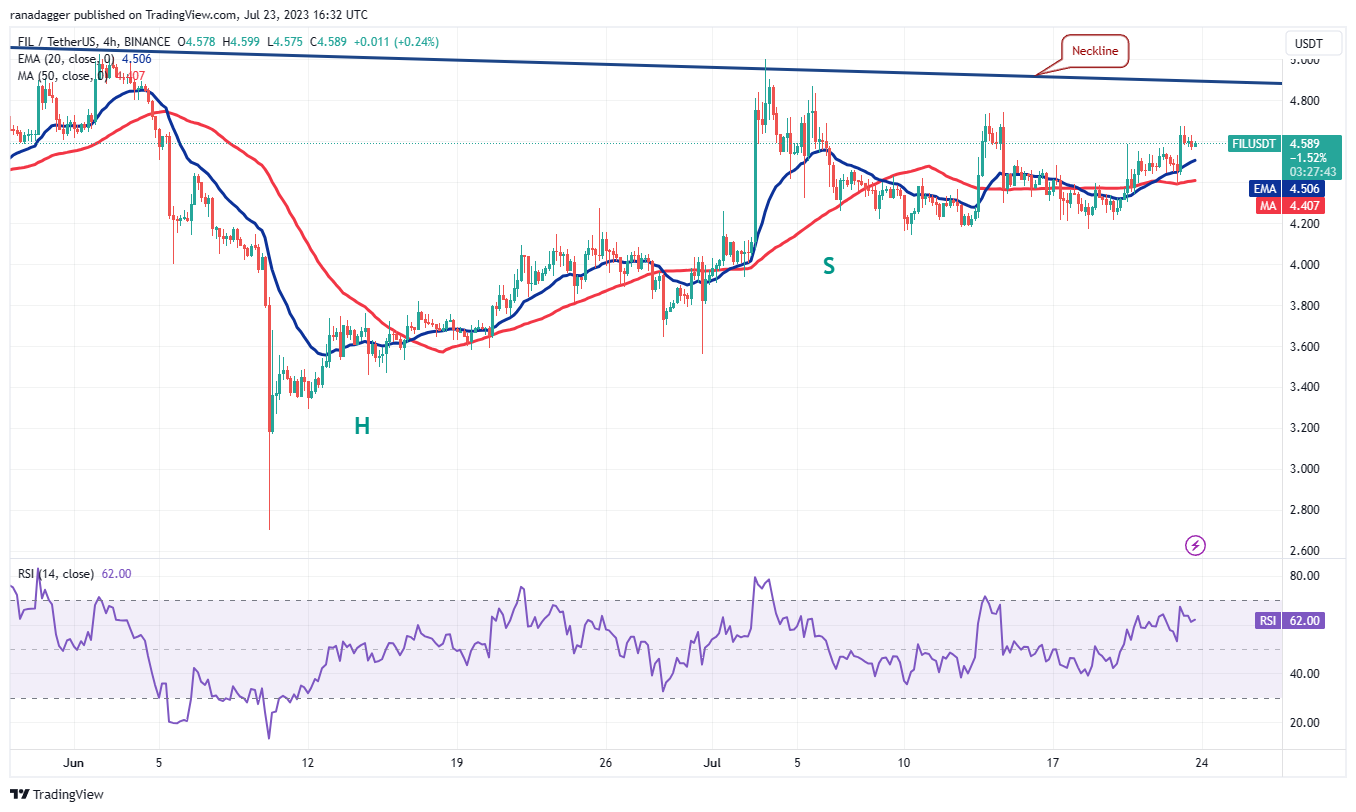
The bears are expected to defend this level aggressively but if bulls do not allow the price to slip below the 20-EMA, the likelihood of a rally above the neckline increases.
Alternatively, if the price turns down and breaks below the 50-SMA, it will suggest that the bears are selling on rallies. That may drag the pair to $4.14.
Related: Ripple effect? Stellar (XLM) is catching up to XRP price gains
Synthetix price analysis
Synthetix (SNX) is attempting to break out from a basing pattern but the bulls are facing solid resistance in the zone between $3.40 and $3.56.

The bears are likely to have other plans. They will try to stall the relief rally in the overhead zone and yank the price below the 20-day EMA. If they do that, the pair may tumble to the 50-day SMA ($2.19).
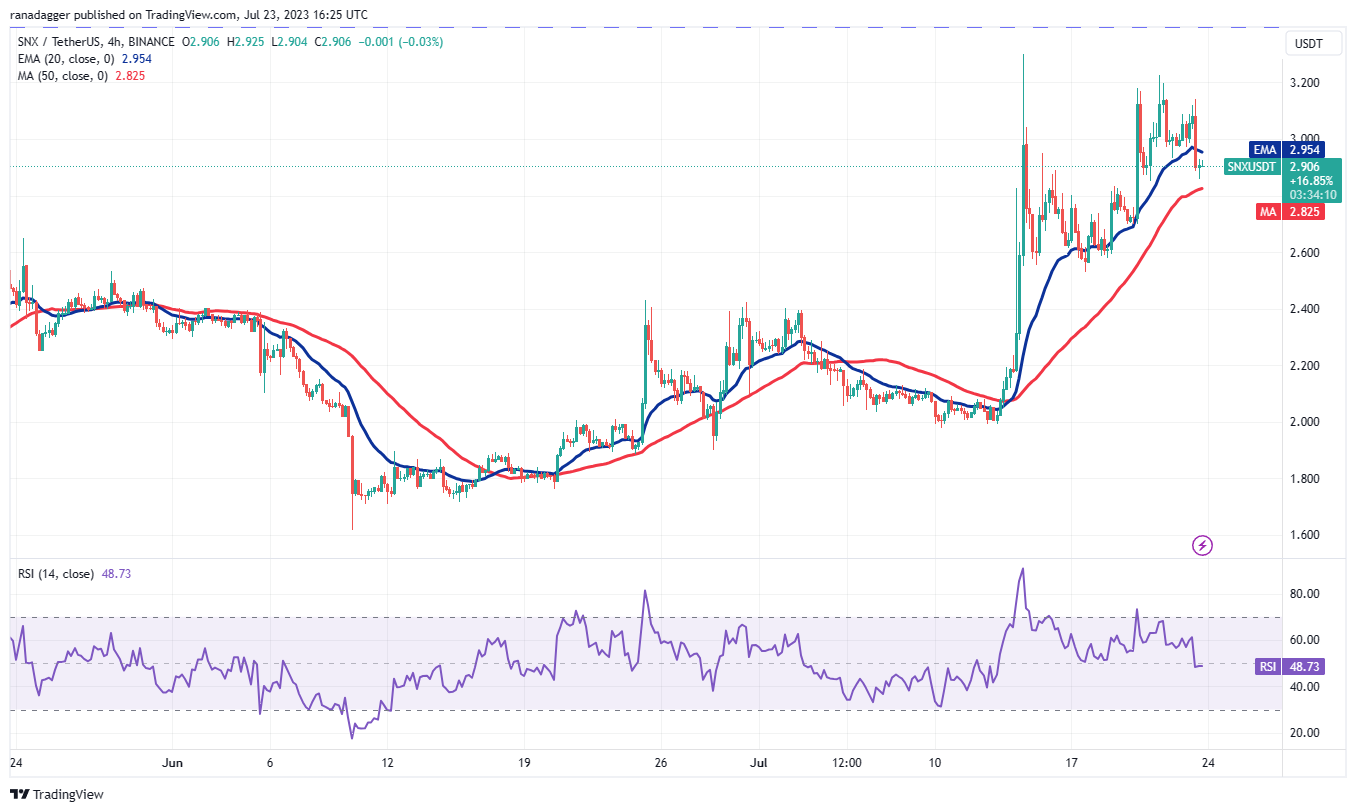
If bulls propel the price above $3.15, the momentum could pick up and the pair could retest the resistance at $3.30. This is an important level to watch for because if it gives way, the pair may resume the next leg of the up-move and hit $3.82.
If bears want to prevent the rally, they will have to tug the price below the moving averages. The pair could then collapse to $2.52.
Theta Network price analysis
The recovery in the Theta Network (THETA) is facing selling near the 38.2% Fibonacci retracement level of $0.83.
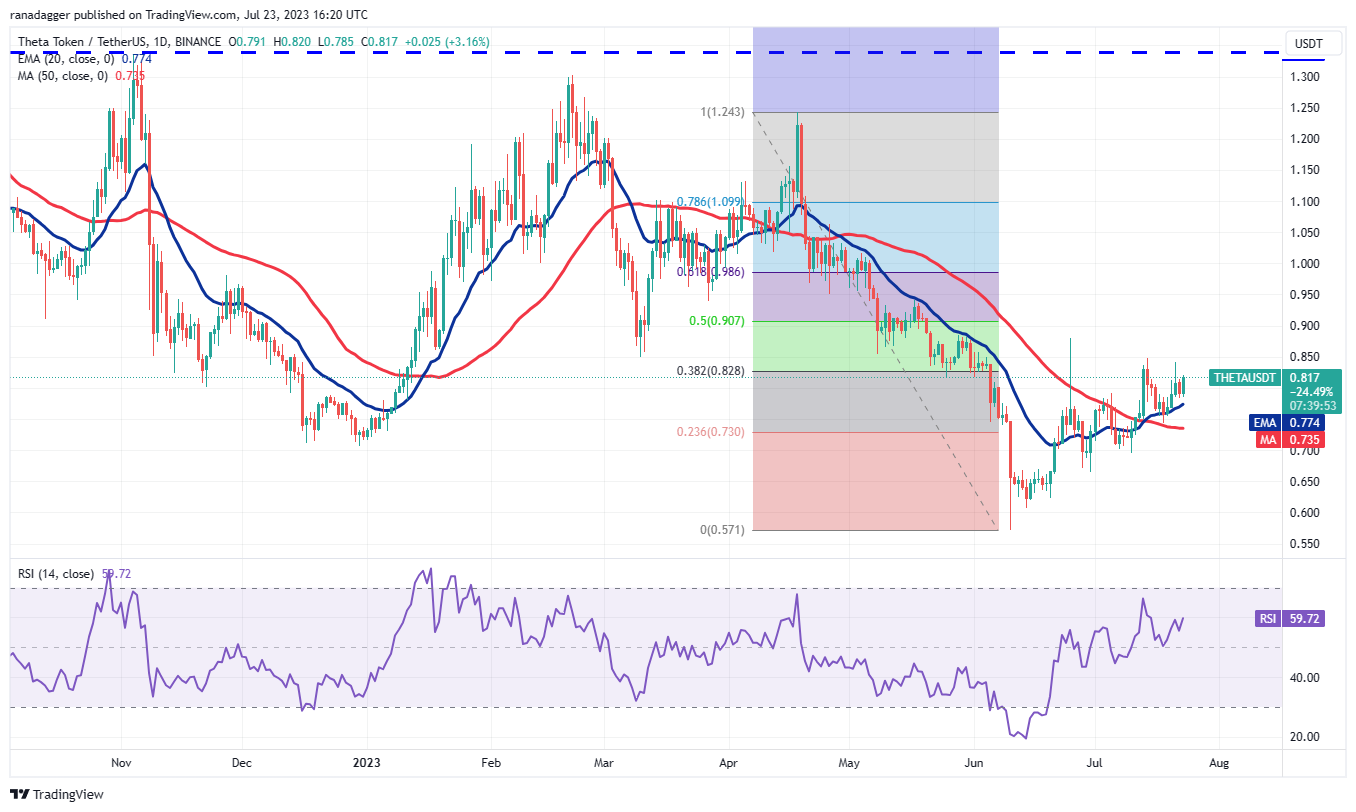
A break and close above $0.83 could open the doors for a further rise to the 50% retracement level of $0.91 and thereafter to the 61.8% retracement level of $0.99.
This positive view will invalidate if the price turns down and plunges below the moving averages. The THETA/USDT pair could then descend to $0.66.

If the price sustains above the 20-EMA, the bulls will try to propel the pair above $0.85. If they succeed, the pair may climb to the resistance of the channel near $0.90.
Contrarily, if the price slips below the 50-SMA, the bears will try to pull the pair to the support of the channel. A break below this level could tilt the short-term advantage in favor of the bears.
This article does not contain investment advice or recommendations. Every investment and trading move involves risk, and readers should conduct their own research when making a decision.

Leave A Comment