
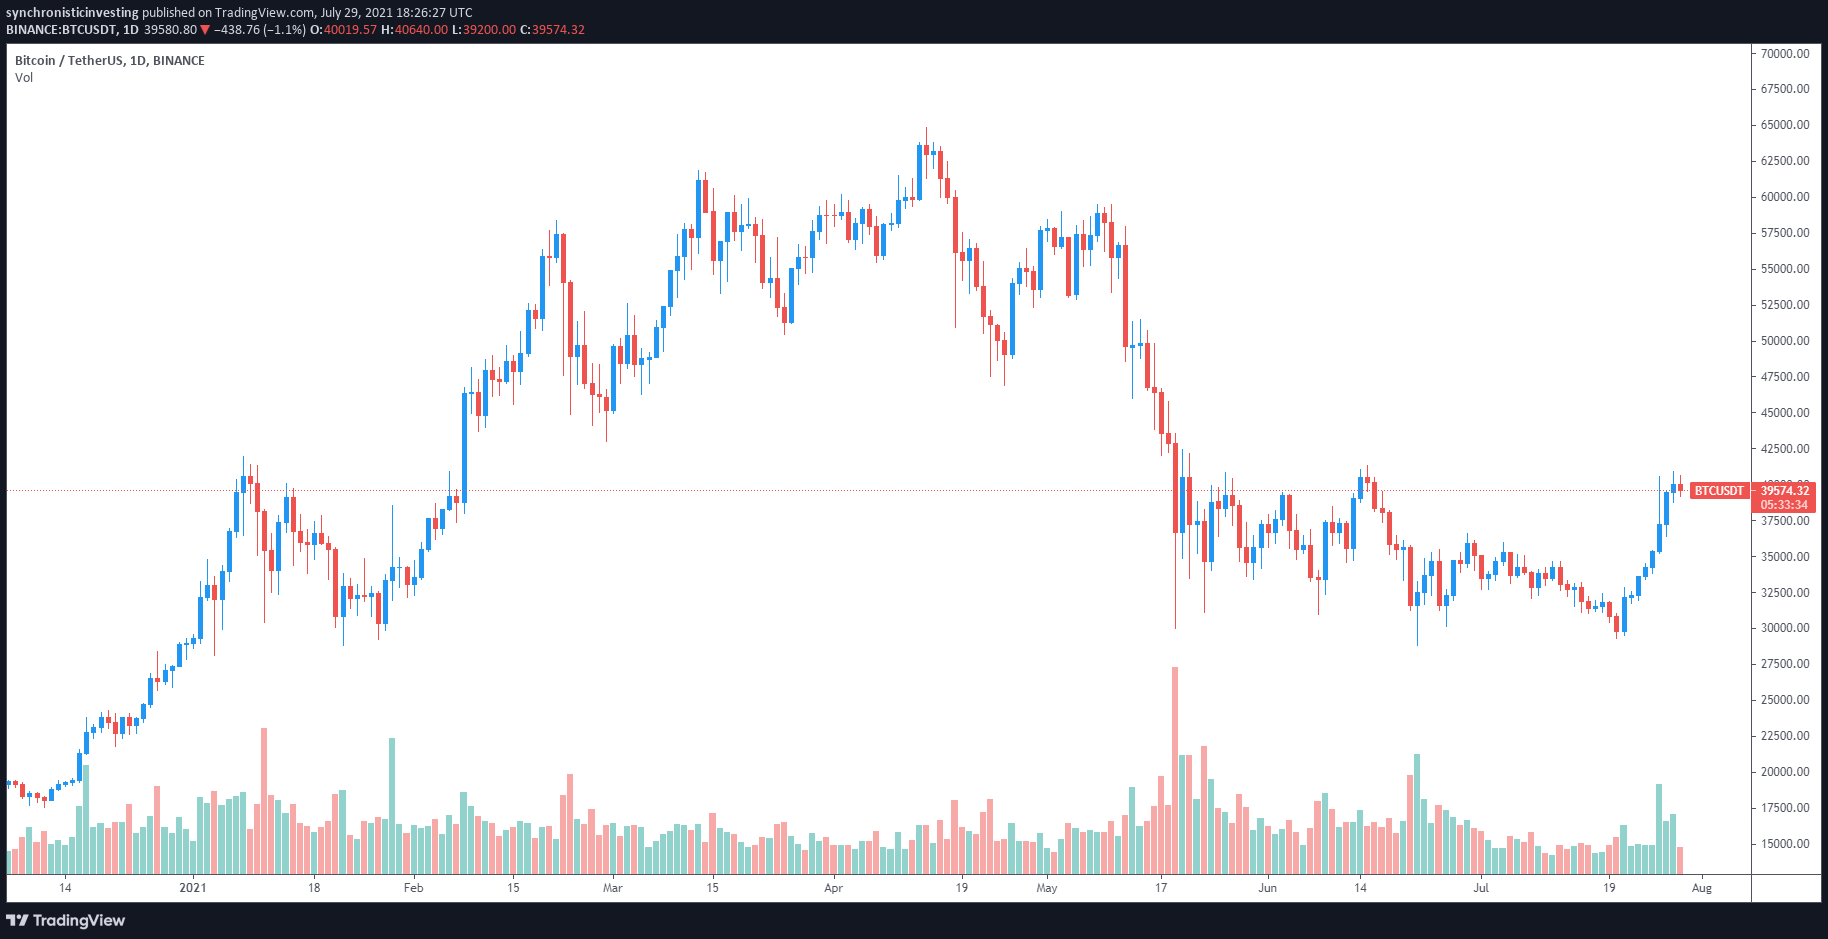
The rumor that Amazon would accept cryptocurrency payments sparked a wave of bullish enthusiasm across the crypto market earlier in the week but now this sentiment has begun to wane as Bitcoin (BTC) bulls face stiff resistance at the $40,000 level.
Data from Cointelegraph Markets Pro and TradingView shows that bears have managed to fend off multiple attempts to flip the $40,000 level to support and defense of this zone continued on July 29 as Bitcoin’s stagnant price action and added to concerns that the price could fall back to last week’s $35,000 to $30,000 range.
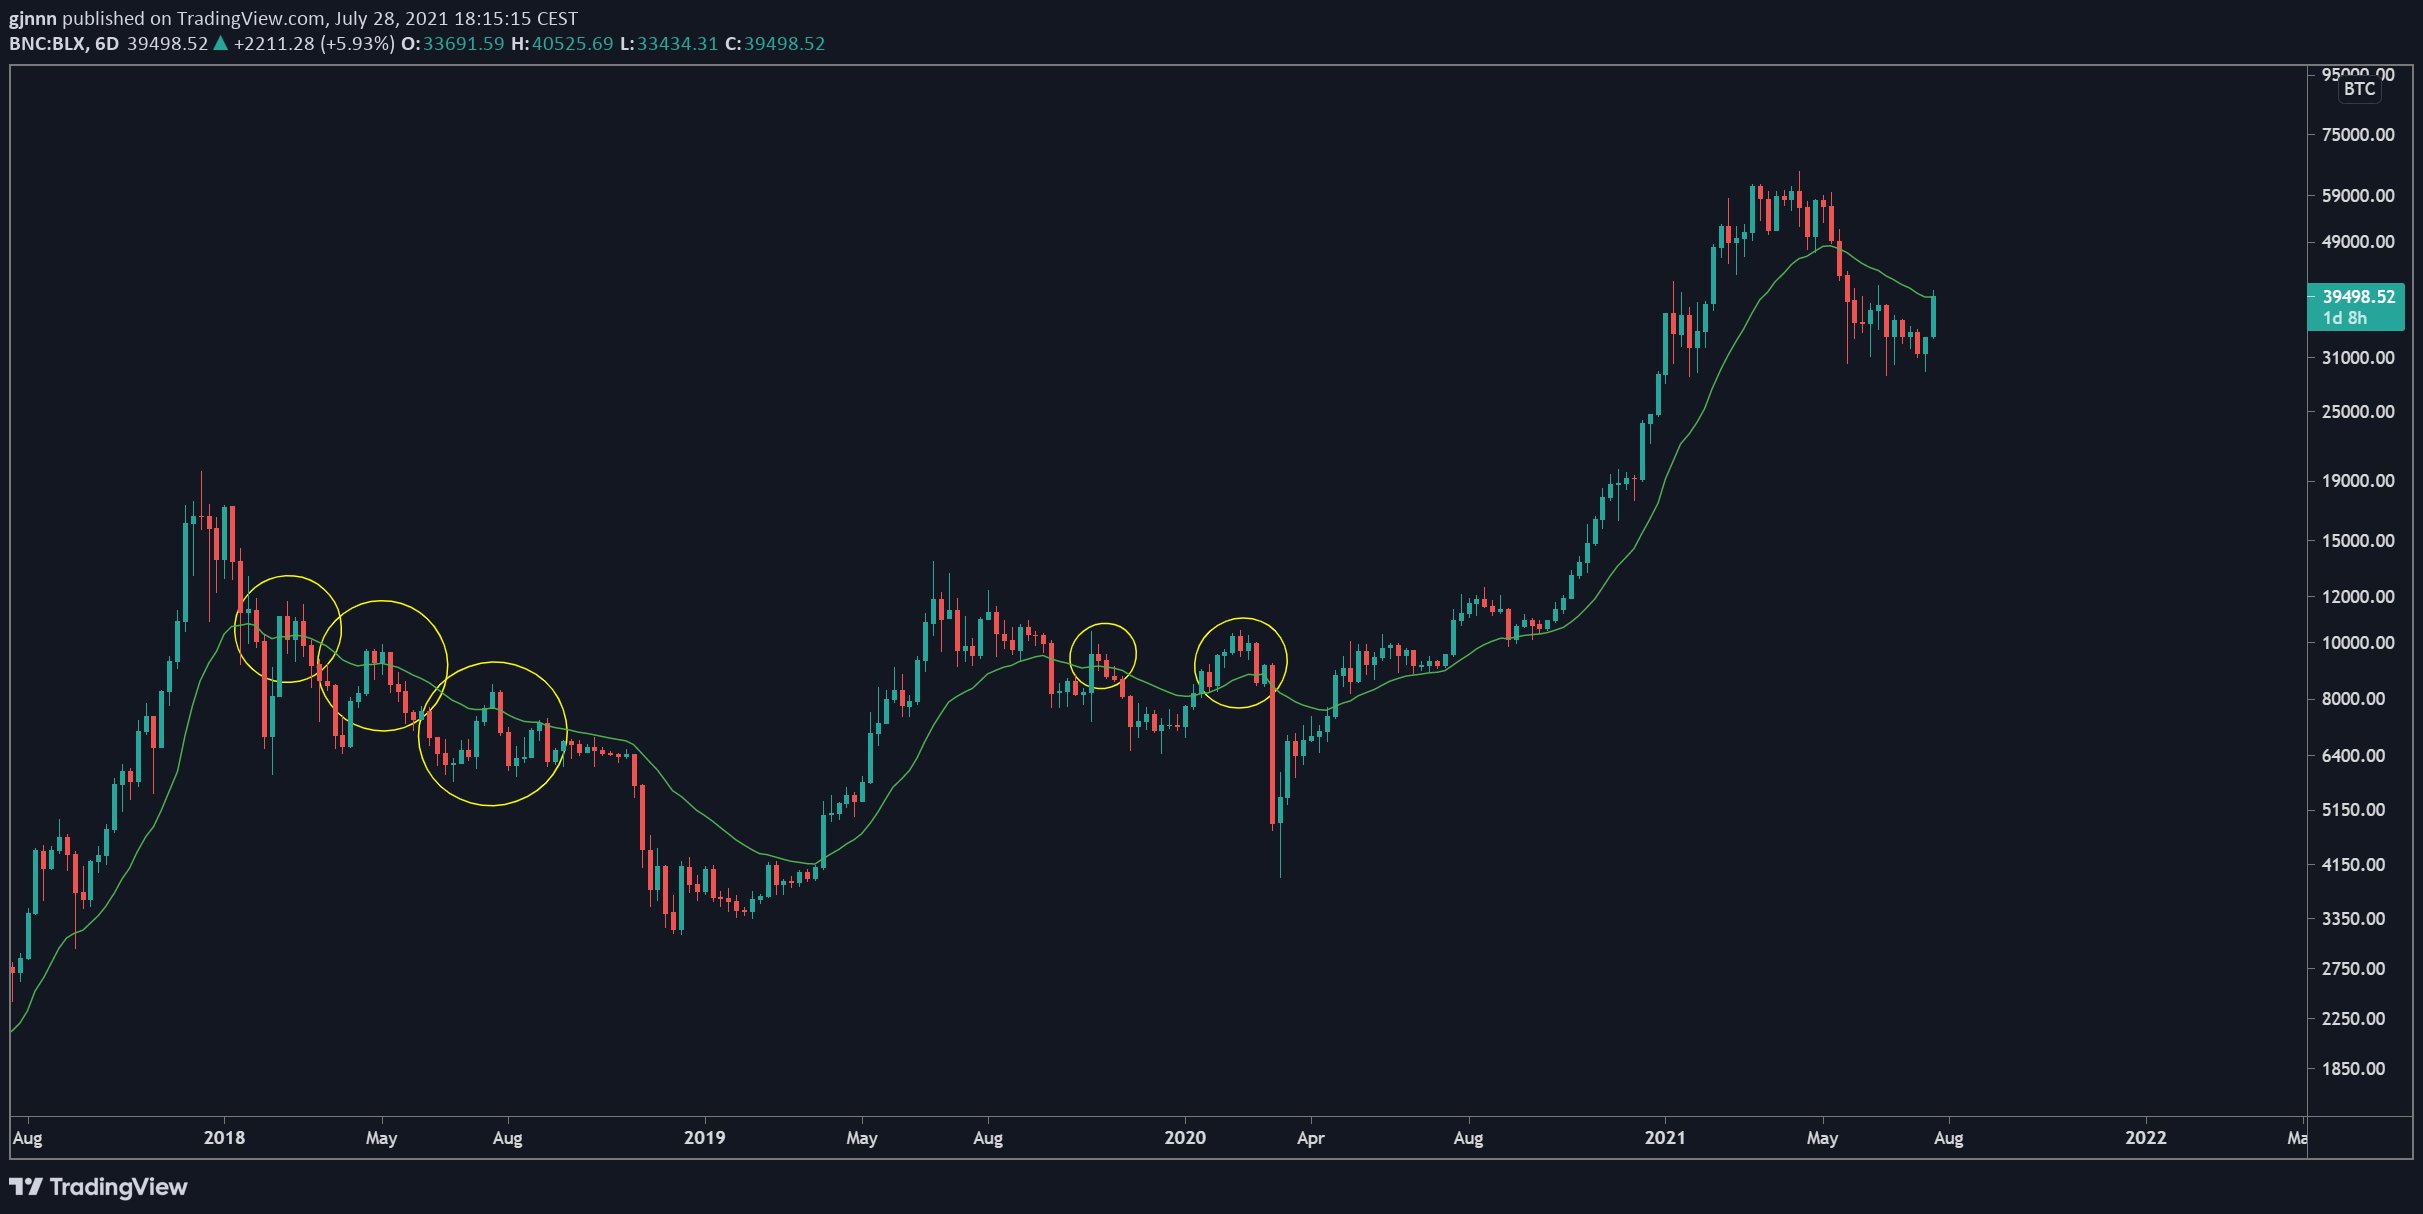
The 21-week EMA marks the line between a bull and bear market
Bitcoin’s rapid ascent from $31,000 to $40,925 lifted the price near its 21-week exponential moving average, a level that is widely considered as a bull market indicator according to pseudonymous crypto Twitter analyst Rekt Capital.
The 21-week EMA is largely regarded as a #BTC Bull Market indicator
When $BTC is above it – BTC is thought to be in a Bull Market
When price is below it – BTC is thought to be in a Bear Market
BTC is now fighting to breakout beyond the 21-week EMA (green)#Bitcoin #Crypto pic.twitter.com/rMqeWzJS4i
— Rekt Capital (@rektcapital) July 28, 2021
As seen in the tweet above, the 21-week EMA is currently near the $40,000 price level, effectively becoming the ‘line in the sand’ that separates bulls and bears.
One of the responses to the above tweet offers a word of caution for overly bullish traders because similar moves in the past were followed by lower lows and an extension of bear market conditions.
Bitcoin whales remain greedy while others are fearful
One group of market participants who have shown little evidence of indecision are Bitcoin whales, who have embraced Warren Buffett’s mantra to “be fearful when others are greedy, and greedy when others are fearful,” by buying up low-priced BTC as weaker hands tap out.
#Bitcoin‘s whales have been staying busy, and addresses holding between 100 and 10,000 $BTC just reached a combined #AllTimeHigh 9.19m coins held. They have added 170,000 more $BTC since May 22nd, and a staggering 130,000 $BTC in the past 4 weeks alone. https://t.co/qv5IbYXgGQ pic.twitter.com/PwrmUyz9Of
— Santiment (@santimentfeed) July 29, 2021
According to data from Santiment, an on-chain and behavioral analysis platform, whale wallets have accumulated 130,000 BTC in the past four weeks as the price of Bitcoin traded below $35,000.
With such heavy accumulation being seen in the lower $30,000 to $35,000 range, some analysts have suggested that whales may attempt to orchestrate another pullback in price so that they can continue to accumulate.
Related: Bitcoin bulls control Friday’s $1.7B monthly options expiry
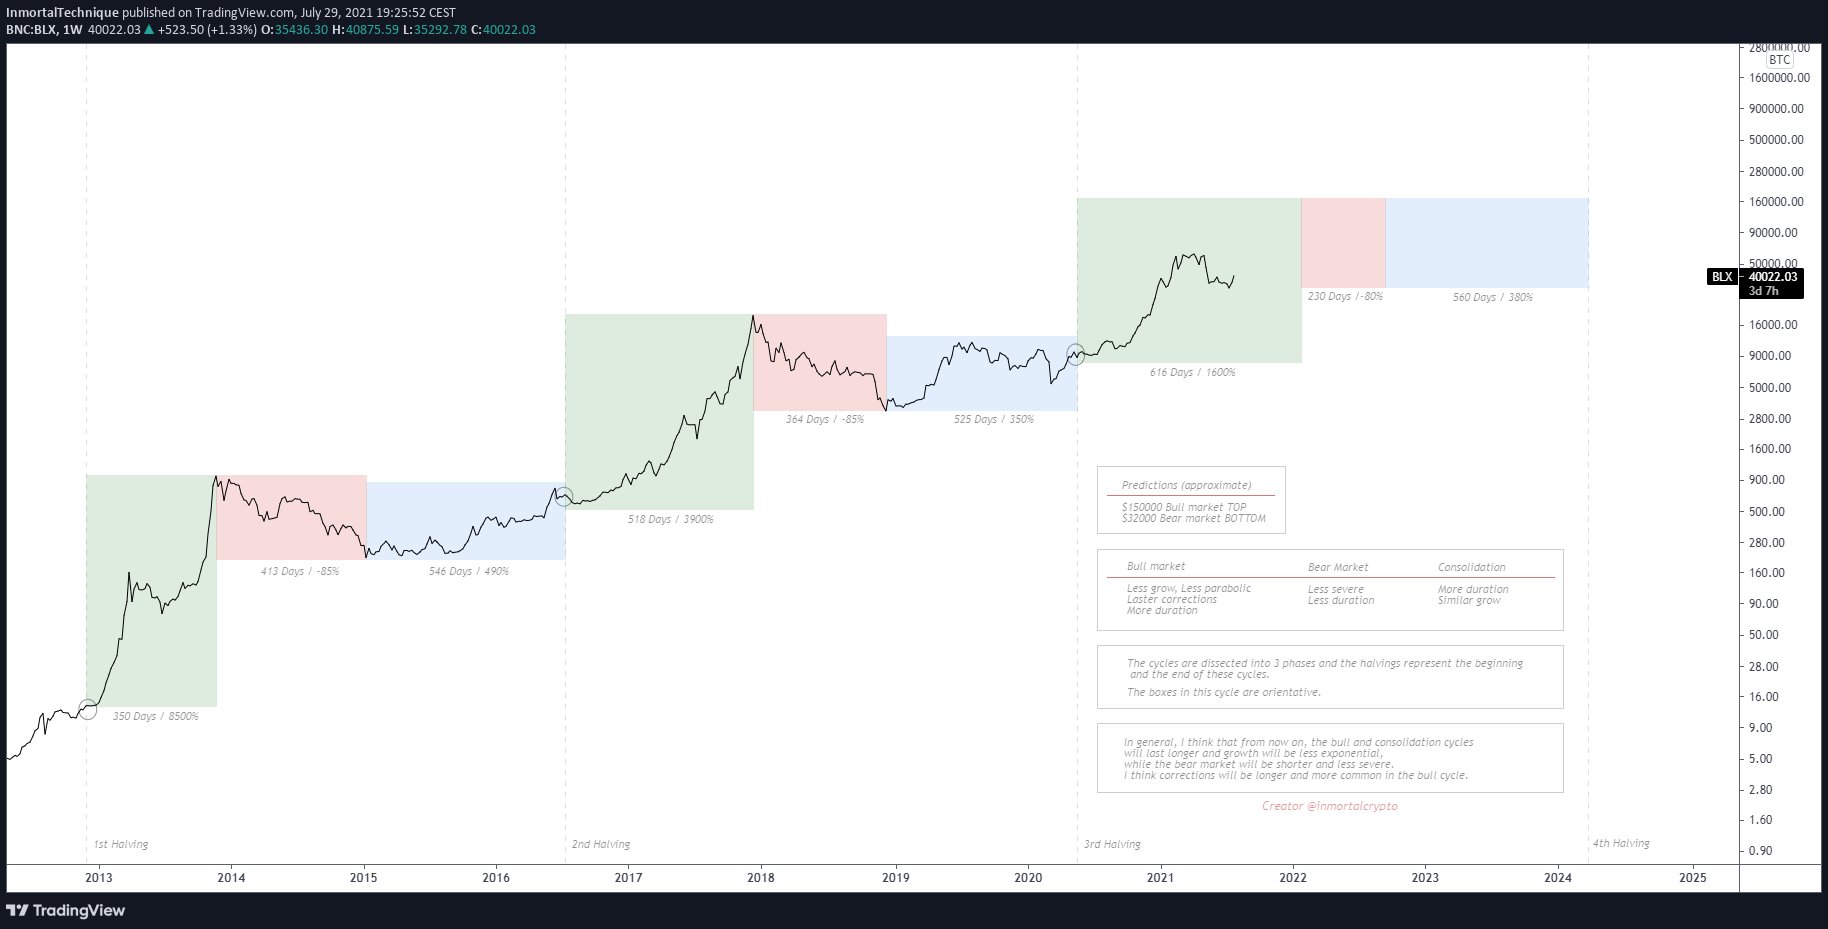
Long-term cycles offer hope
When near-term confusion prevails, sometimes it’s best to take a step back to see the bigger picture of where the market is and what possibilities the future holds.
According to Inmortal UP ONLY, a pseudonymous Twitter user, Bitcoin’s four-year cycle is currently about 65% through its bull-market phase and the trader predicts a top at $150,000, which will be followed by a correction to $32,000.
Further confirmation of the long-term perspective was offered by Ecoinometrics, who compared Bitcoin’s current post-halving price action to performances in the previous two halvings.
#Bitcoin after the Halving
Jul. 29, 2021
443 days after the 3rd halving#BTC at $39,973
Catching up to the growth trajectory of the previous cycle will require a lot of juice.
But we can hope this move is the start of a new leg up.
So far so good. pic.twitter.com/a12RYAhlsn
— ecoinometrics (@ecoinometrics) July 29, 2021
As shown above, the current price of BTC is well below the average growth of previous cycles, indicating that the BTC has some “catching up to do” if it will achieve a similar trajectory and reach a new all-time high above $100,000.
The views and opinions expressed here are solely those of the author and do not necessarily reflect the views of Cointelegraph.com. Every investment and trading move involves risk, you should conduct your own research when making a decision.

Leave A Comment