
Ethereum’s on-chain movements indicate bullish pressure building around Ether as its exchange balances reached an all-time low and staking deposits keep surging.
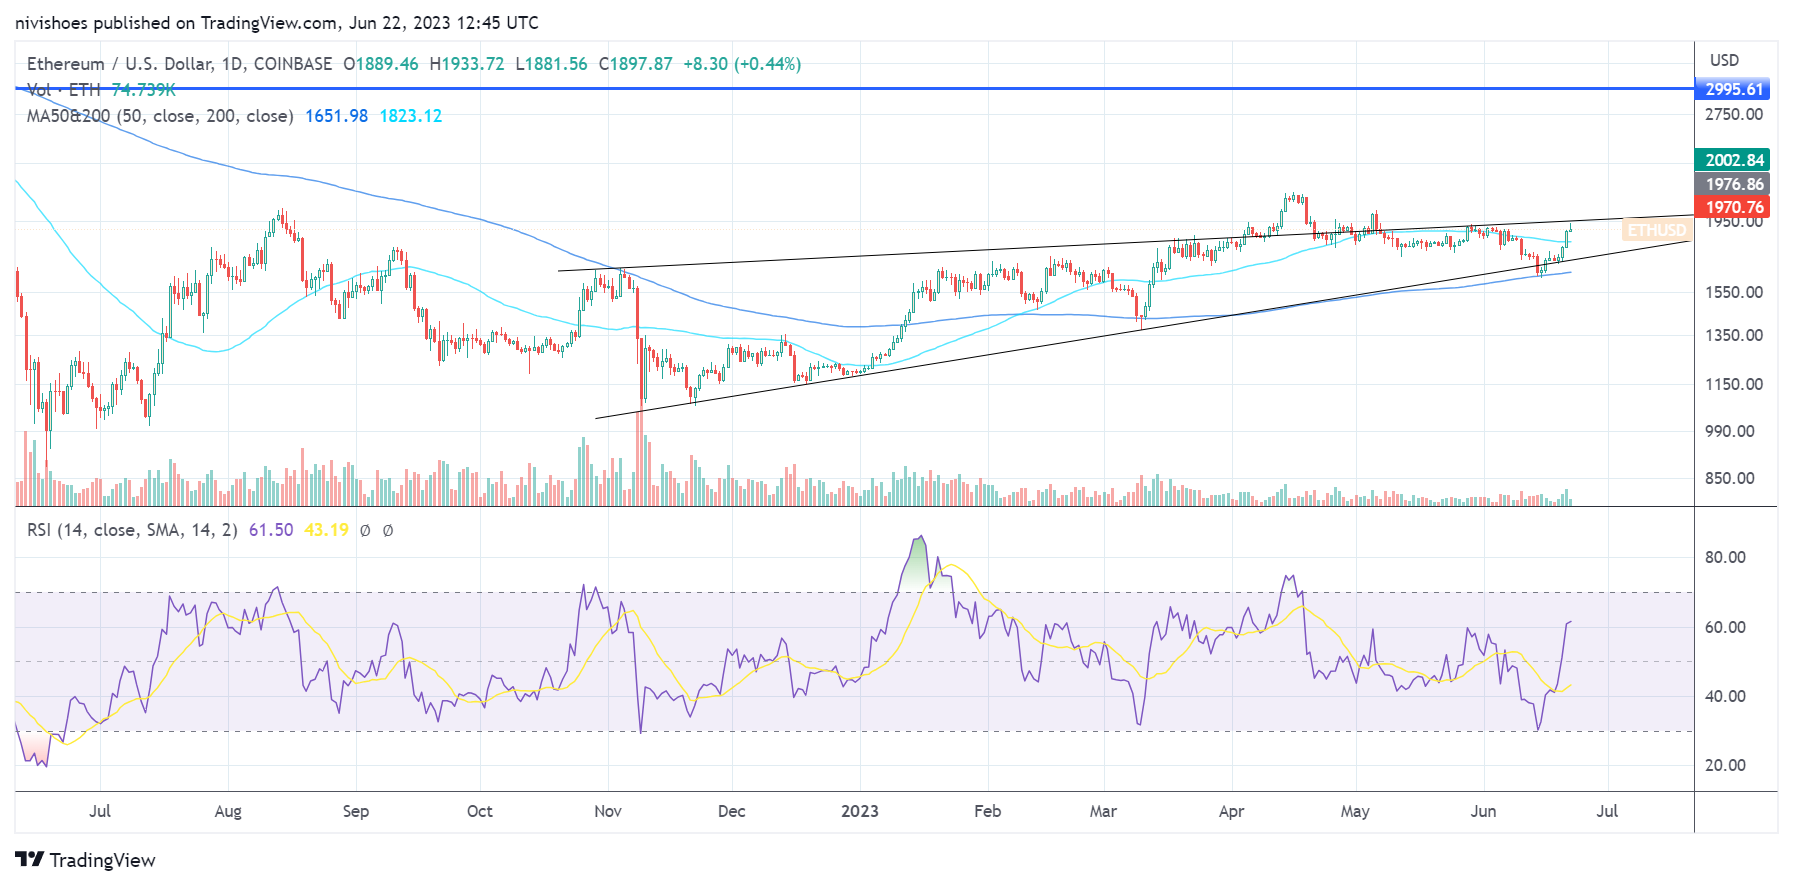
Ether’s (ETH) technical charts suggest that the asset can reclaim $3,000 if buyers are able to push above the resistance between $1,900 and $2,000.
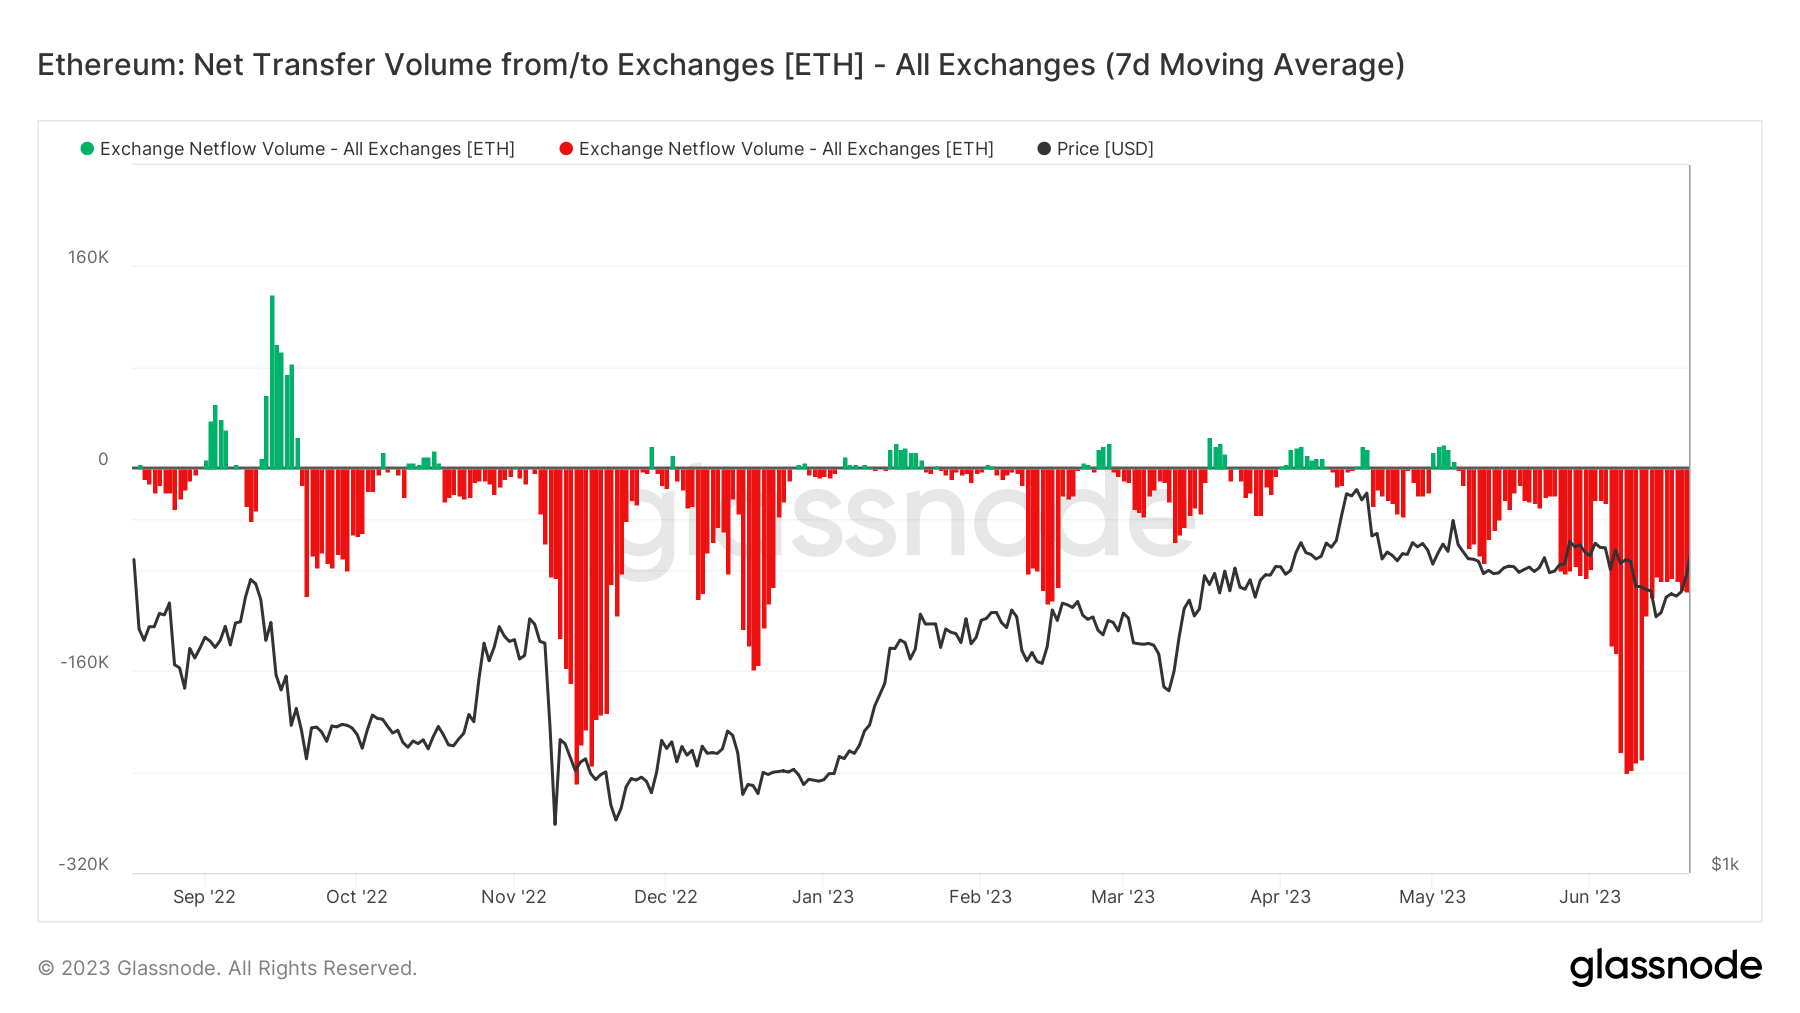
ETH held on exchanges hits an all-time low
Exchange balances for ETH reached a new low of 12.6%, dropping sharply in the last 30 days, according to Glassnode data. Reduced supply on exchanges is usually a bullish sign, as it means fewer tokens are readily available for selling.

The data should be taken with a grain of salt, as withdrawals were caused by investors spooked by centralized exchanges.
However, the magnitude of withdrawals and bullish price action show similarity to the November 2022 levels, when ETH quickly surged over 33% following an equivalent dip in exchange balances.
Glassnode’s data shows that nearly 30% of ETH’s supply is locked in smart contracts, including decentralized finance and staking contracts, up from 25.5% at the start of 2023.
Increased withdrawals from exchanges and deposits in smart contracts are positive for ETH’s price, as it reduces its liquid supply.
ETH/USD price analysis
Ether’s price broke above the 50-day moving average at $1,823.09, staging a bullish breakout.
The ETH/USD pair is currently facing resistance around the horizontal level of $1,906. The pair has recorded higher lows since November 2022, with the $1,900-$2,000 level acting as technical and psychological resistance levels, according to the ascending triangle pattern.
A breakout above $2,000 could quickly propel ETH toward the 2022 breakdown levels of around $3,000. The targets of the bullish ascending channel pattern also coincide around these levels.
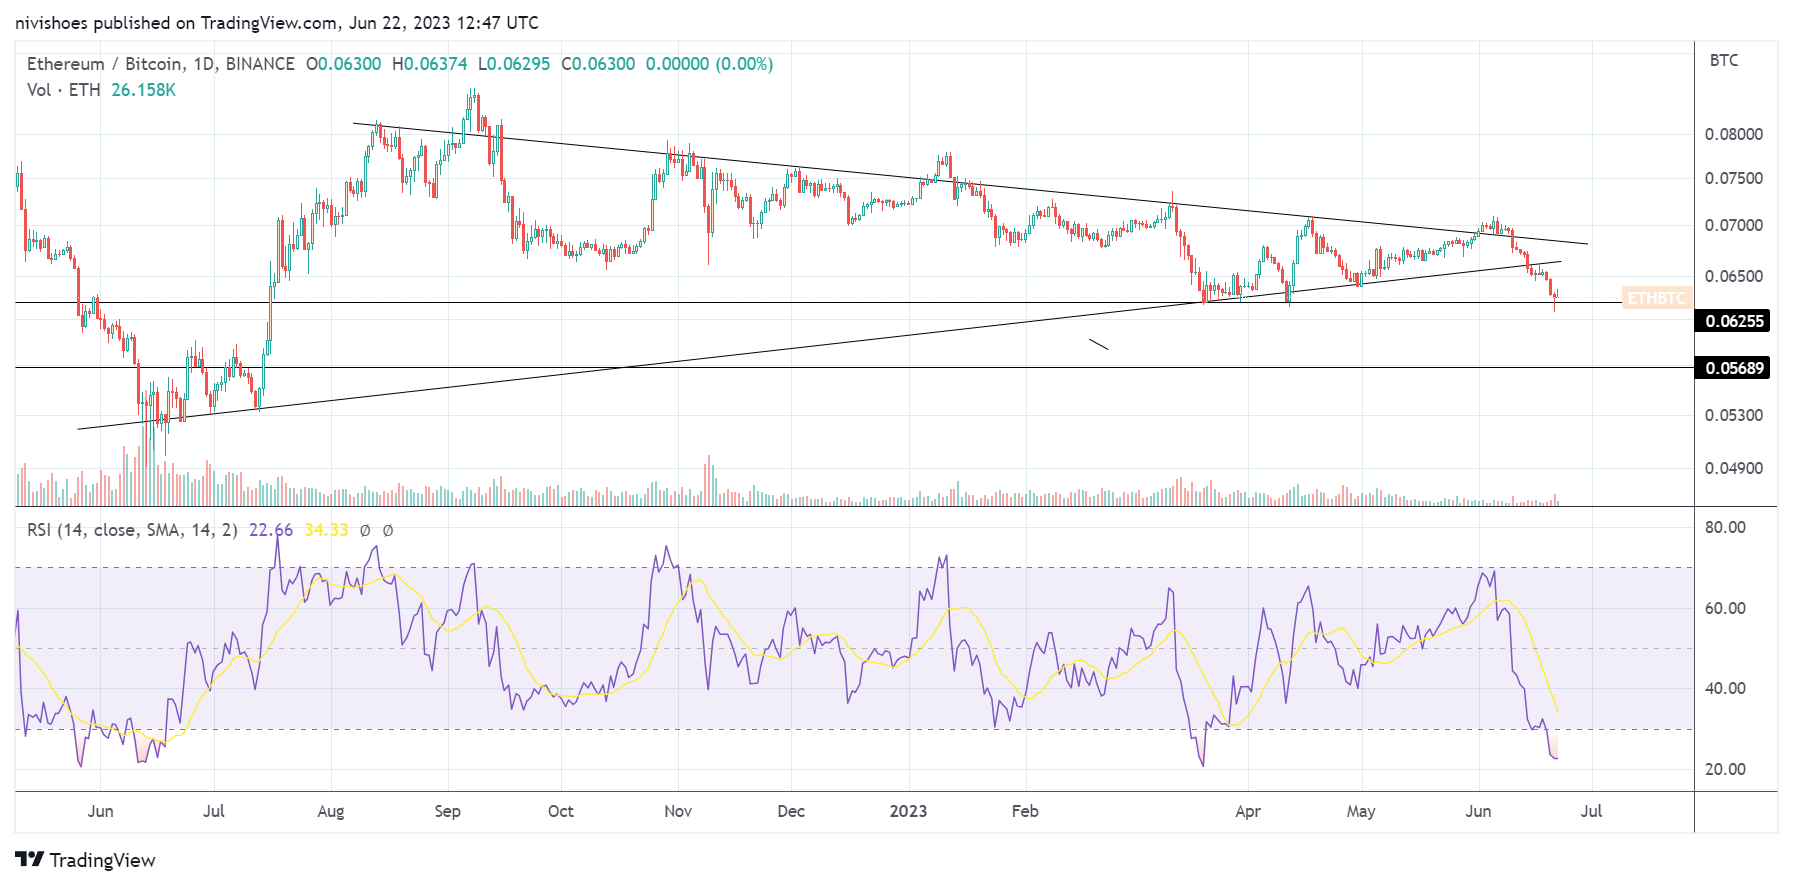
Nevertheless, the relative strength index metric is showing oversold readings for the ETH/BTC pair, suggesting that a pullback is likely.
Related: Bitcoin ETF impulse fuels ‘fantastic’ $29K BTC price breakout
Perpetual swap traders pay funding rates on their open short or long positions, depending on the demand for the asset. When the demand for short orders surpasses the demand for long orders, shorting becomes relatively more expensive, leading traders on the short side to pay longs.
There is a chance that the price pulls back toward the bottom of the ascending triangle pattern on the ETH/USD pair to around $1,680.
Bitcoin’s price action and BTC buyers’ ability to hold the $30,000 level will also play a crucial role in maintaining Ether’s bullish momentum.
This article does not contain investment advice or recommendations. Every investment and trading move involves risk, and readers should conduct their own research when making a decision.
This article is for general information purposes and is not intended to be and should not be taken as legal or investment advice. The views, thoughts, and opinions expressed here are the author’s alone and do not necessarily reflect or represent the views and opinions of Cointelegraph.

Leave A Comment