
Ethereum’s native token, Ether (ETH), looks poised to log a major price rally versus its top rival, Bitcoin (BTC), in the days leading toward early 2023.
Ether has a 61% chance of breaking out versus Bitcoin
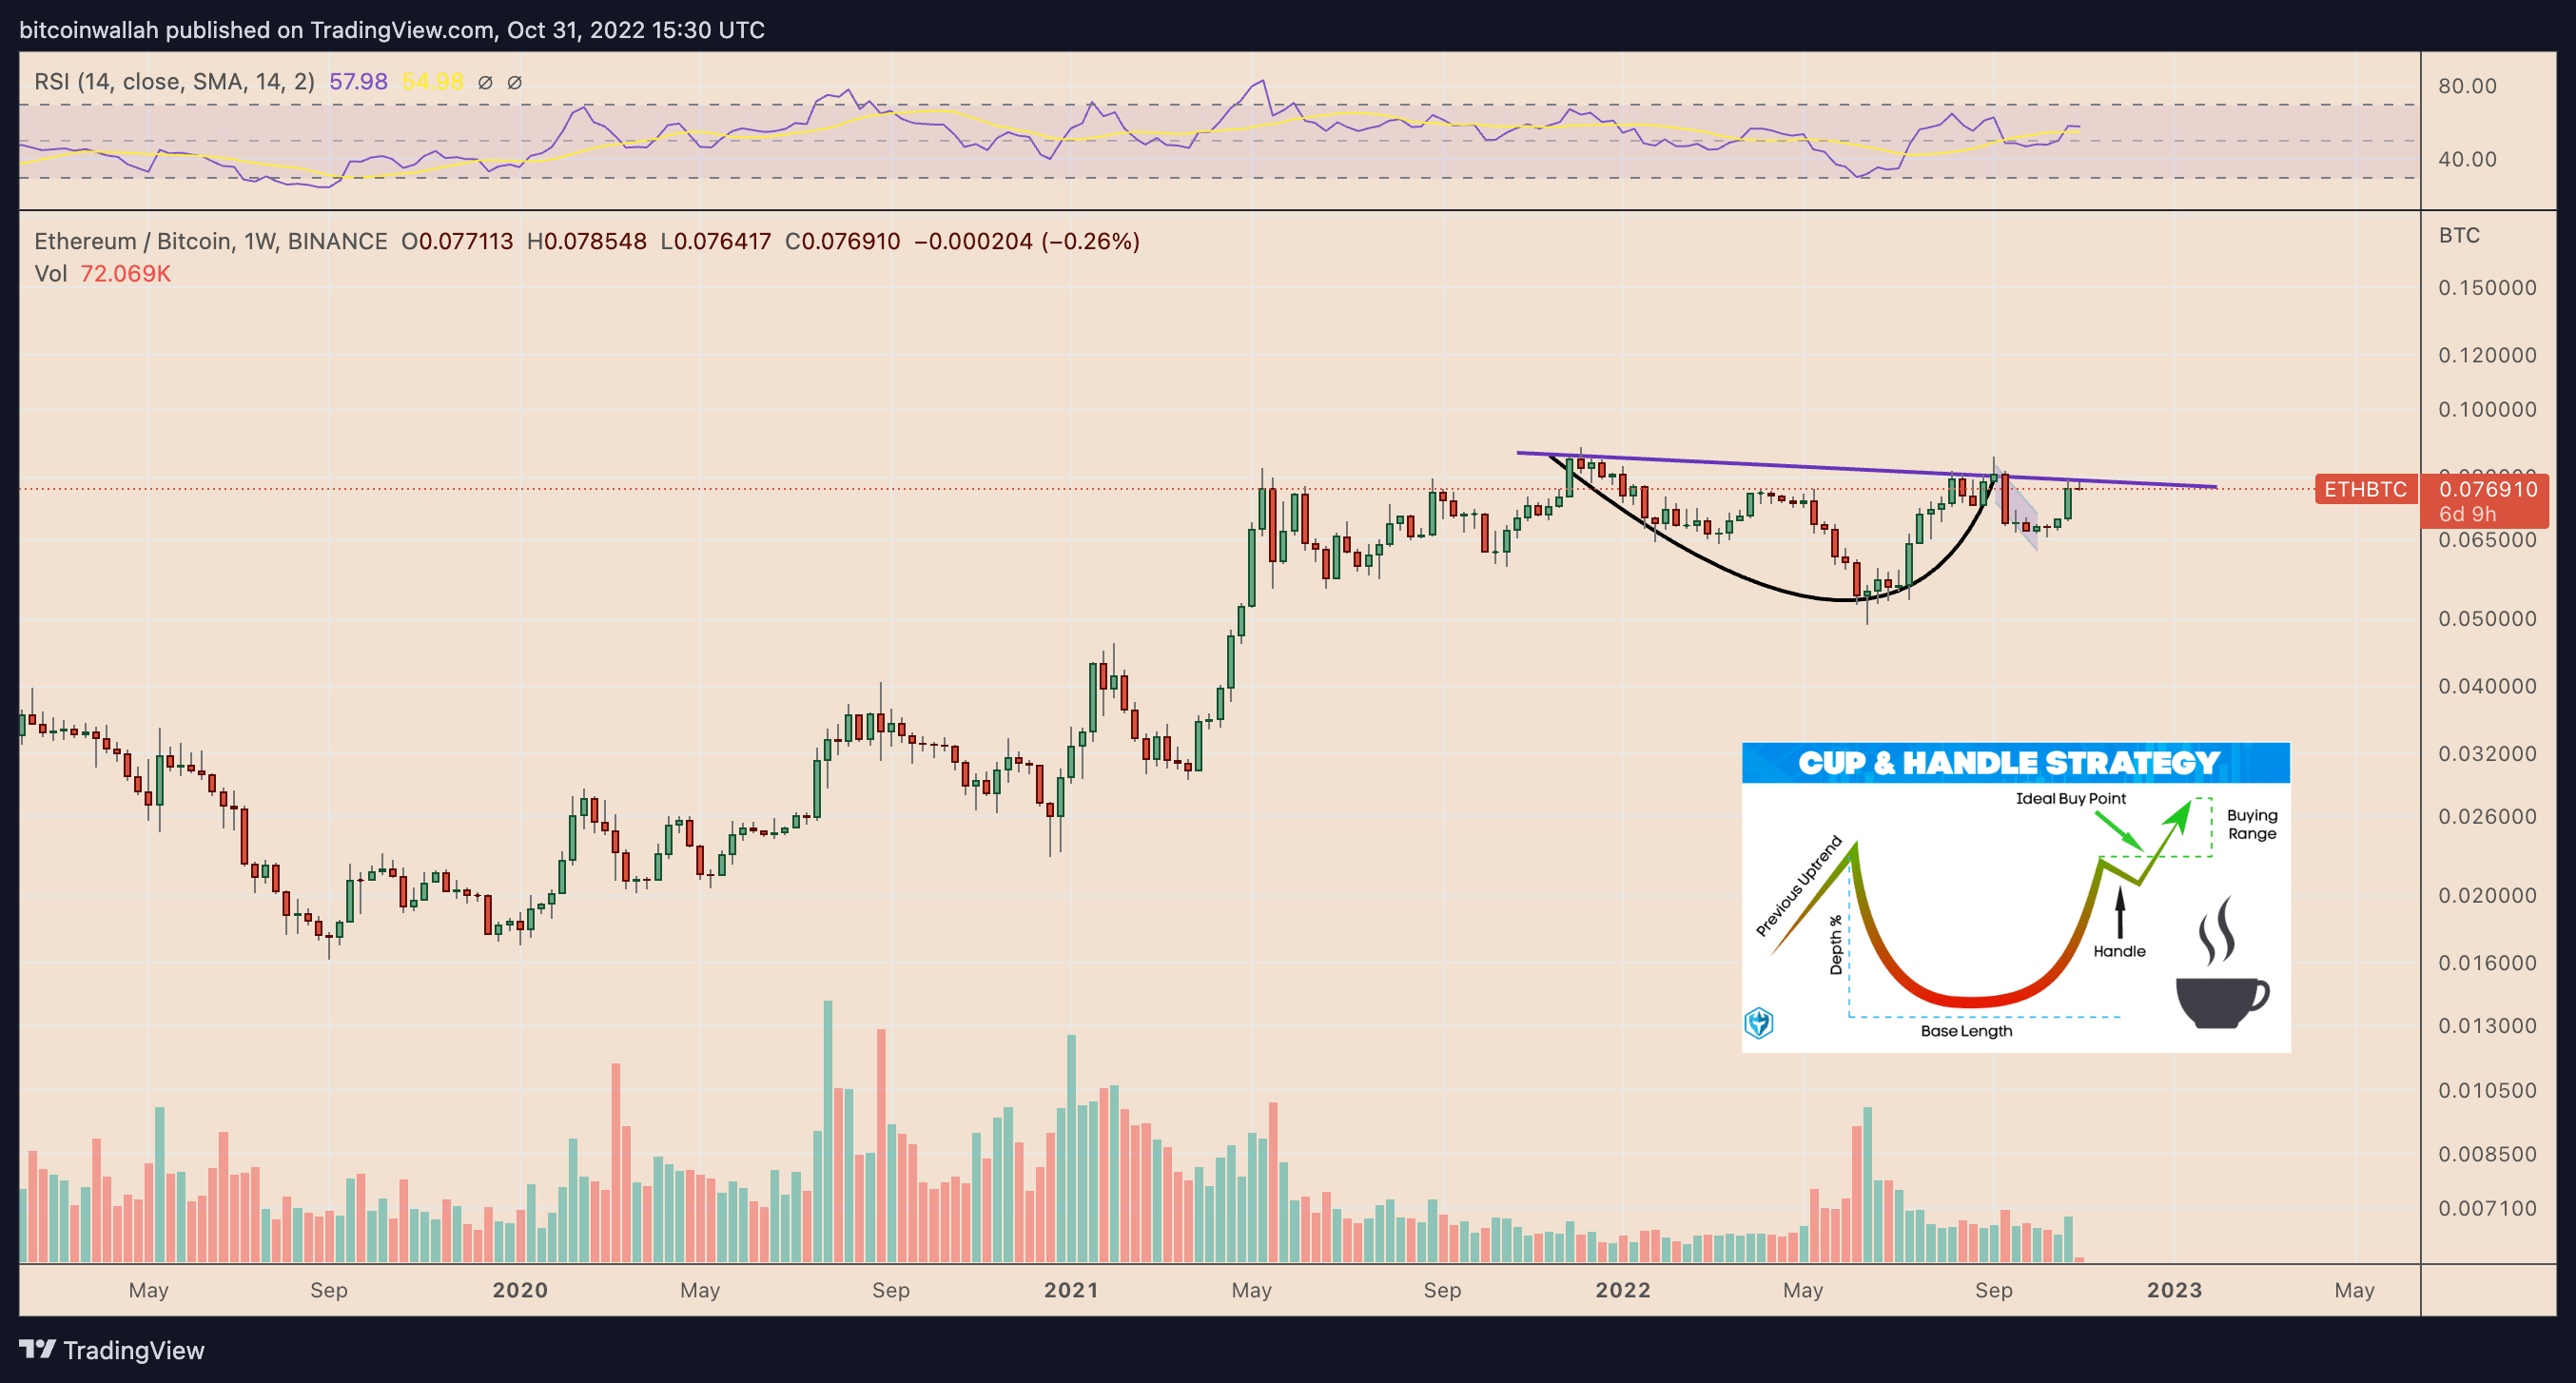
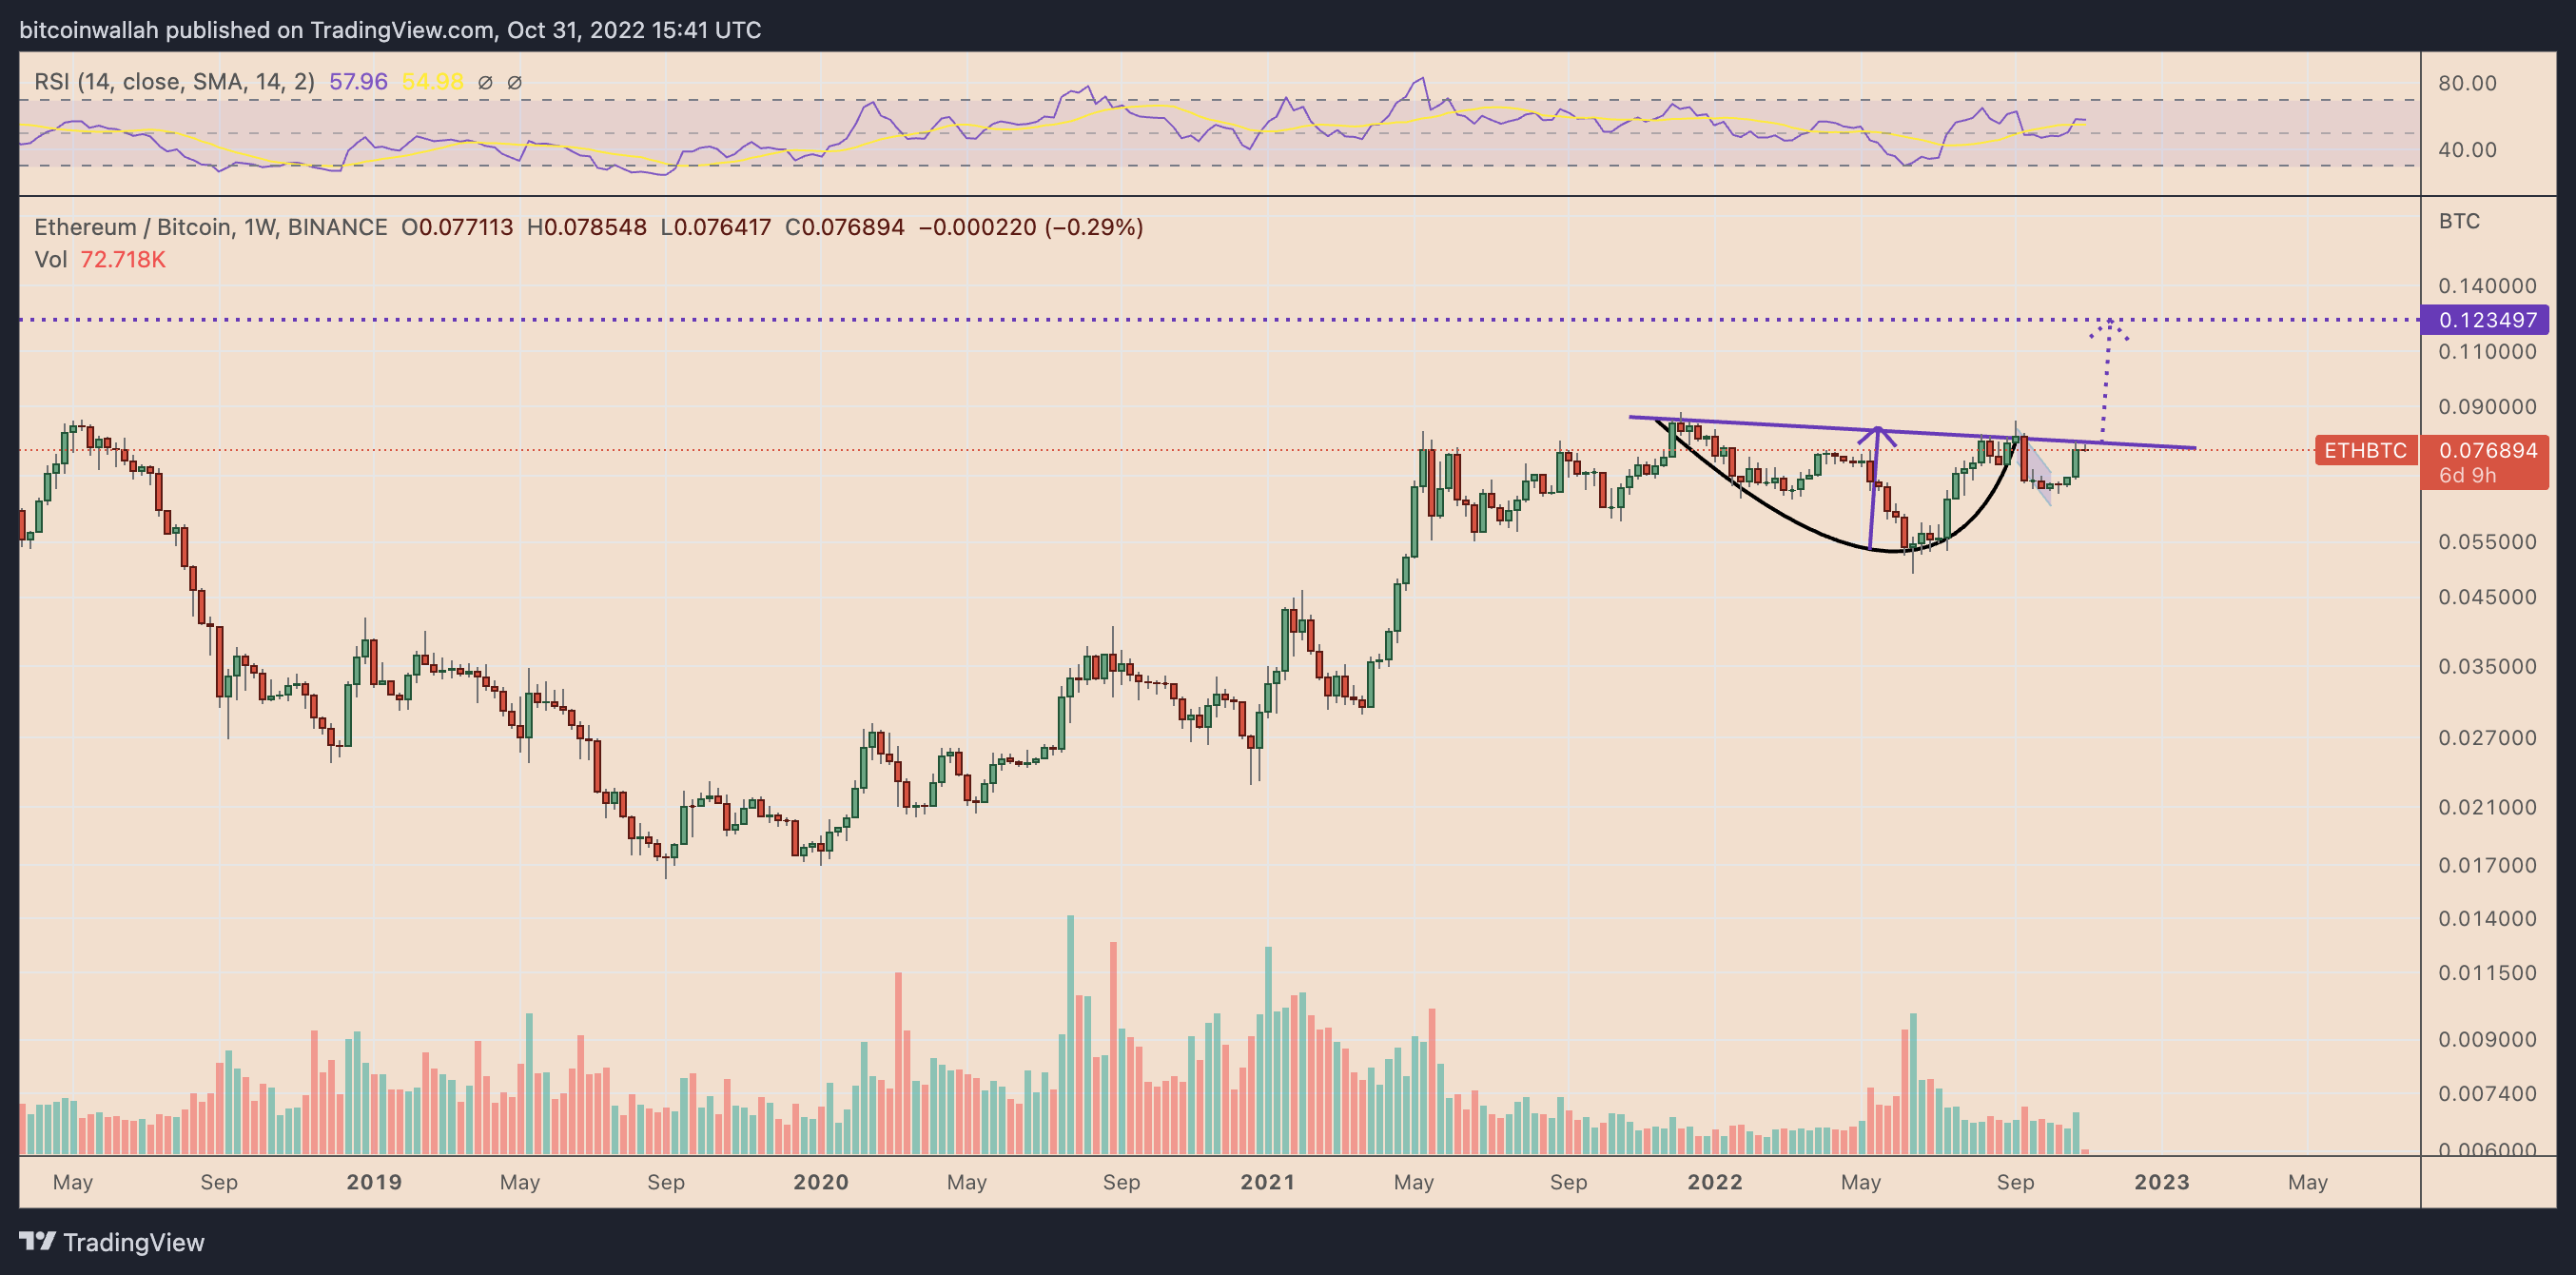
The bullish cues emerge primarily from a classic technical setup dubbed the “cup-and-handle” pattern. It forms when the price undergoes a U-shaped recovery (cup) followed by a slight downward shift (handle) — all while maintaining a common resistance level (neckline).
Traditional analysts perceive the cup-and-handle as a bullish setup, with veteran Tom Bulkowski noting that the pattern meets its profit target 61% of all time. Theoretically, a cup-and-handle pattern’s profit target is measured by adding the distance between its neckline and lowest point to the neckline level.
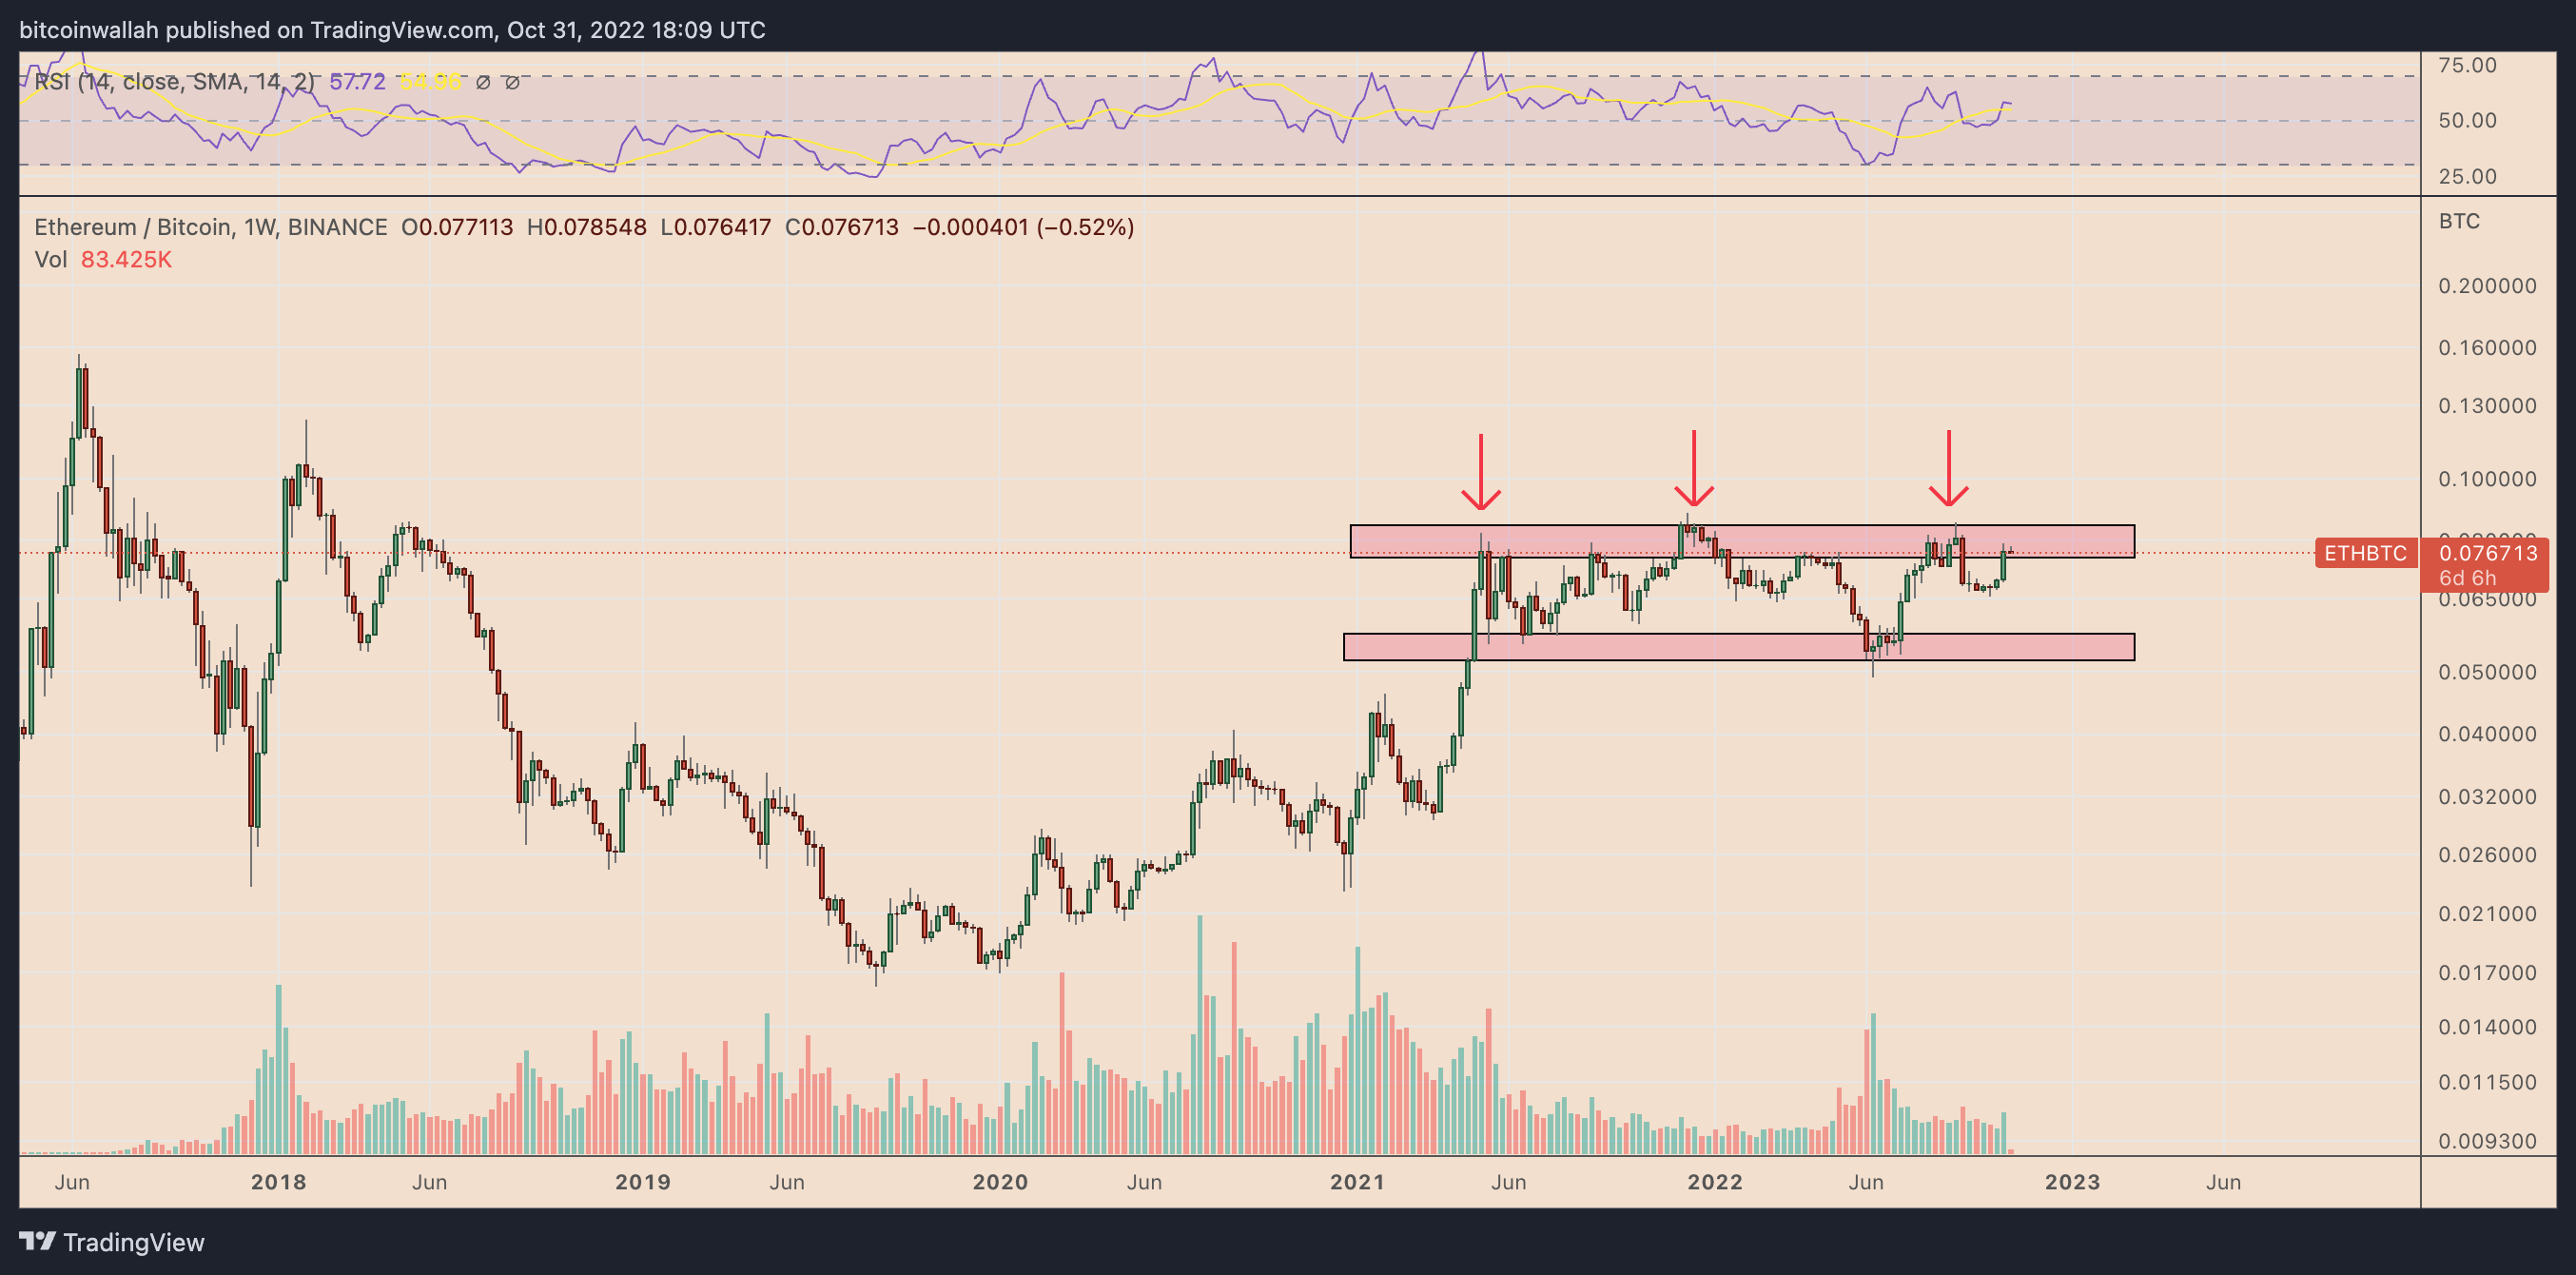
The Ether-to-Bitcoin ratio (or ETH/BTC), a widely tracked pairing has halfway painted a similar setup. The pair now awaits a breakout above its neckline resistance level of around 0.079 BTC, as illustrated in the chart below.
Ether’s strong interim fundamentals compared to Bitcoin further improve its possibility of undergoing a 50% price rally in the future.
For starters, Ether’s annual supply rate fell drastically in October, partly due to a fee-burning mechanism called EIP-1559 that removes a certain ETH amount from permanent circulation whenever an on-chain transaction occurs.
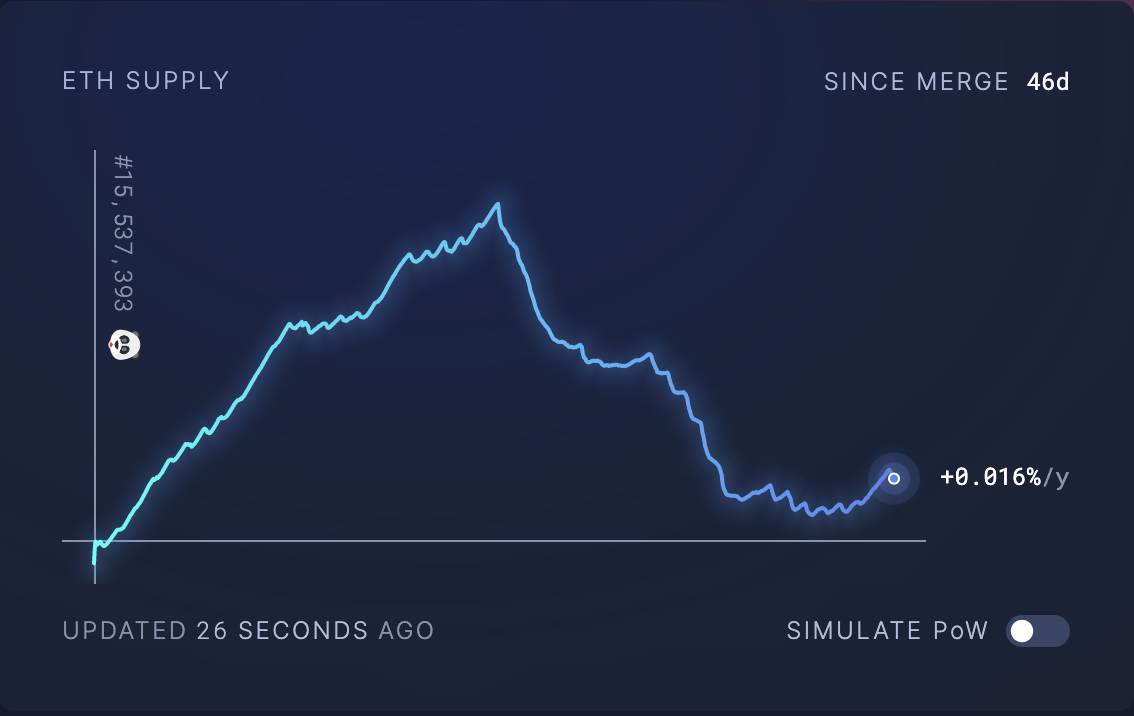
Over 2.69 million ETH tokens (~$8.65 billion) have gone out of circulation since the EIP-1559 update went live on Ethereum in August 2021, according to data from EthBurned.info.
It shows that the more clogged the Ethereum network becomes, the higher the Ether’s probability of entering a “deflationary” mode gets. So, a depleting ETH supply may prove bullish, given the token’s demand rise simultaneously.
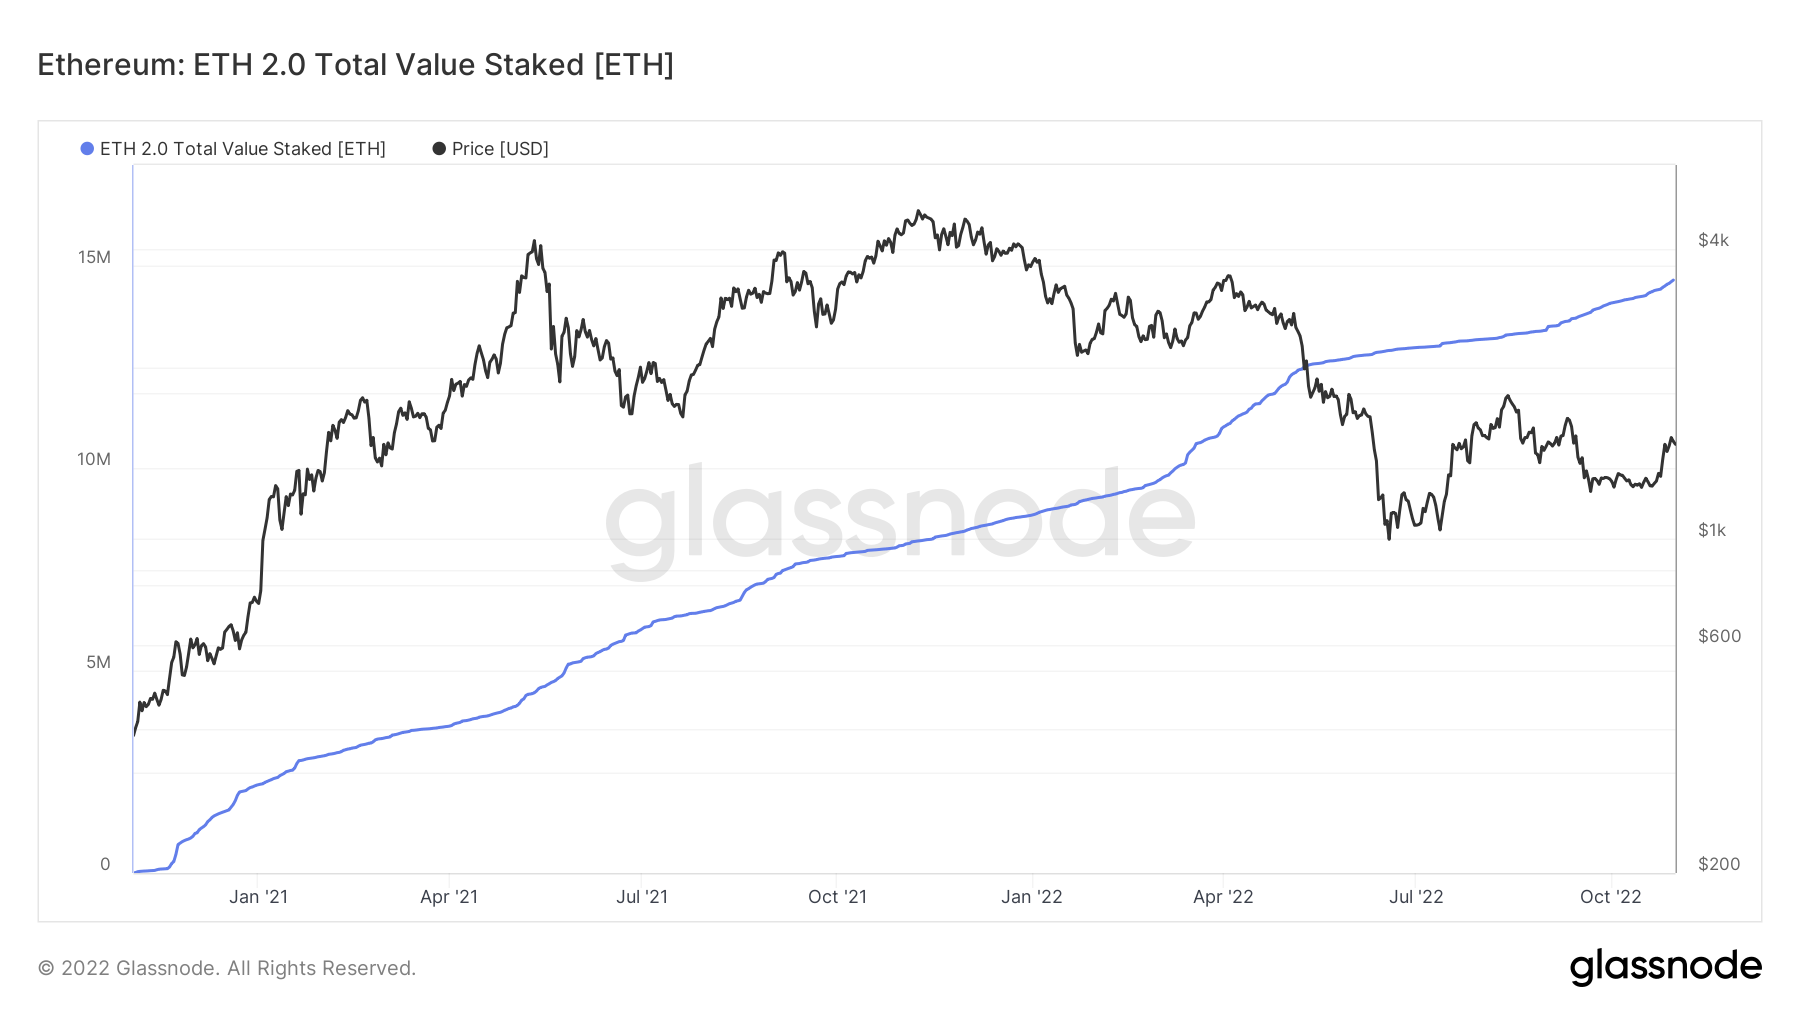
In addition, Ethereum’s transition to a proof-of-stake consensus mechanism via “the Merge” has acted as an Ether supply-sucker, given each staker—individual or pool—is required to lock away 32 ETH in a PoS smart contract to earn annual yields.
The total Ether supply held by Ethereum’s PoS smart contact reached an all-time high of 14.61 million ETH on Oct. 31.
Related: Public Bitcoin miners’ hash rate is booming — But is it actually bearish for BTC price?
In other words, a comparatively higher selling pressure for Bitcoin versus Ether.
ETH/BTC needs to break the range resistance
Ether’s road to a 50% price rally versus Bitcoin has one strong resistance area midway, acting as a potential joy killer for bulls.
In detail, the 0.07BTC to 0.08 BTC range has served as a strong resistance area since May 2021, as shown below. For instance, the December 2021 pullback that started after testing the said range as resistance resulted in a 45% price correction by mid-June 2022.
The views and opinions expressed here are solely those of the author and do not necessarily reflect the views of Cointelegraph.com. Every investment and trading move involves risk, you should conduct your own research when making a decision.

Leave A Comment