
Axie Infinity (AXS) has had a rough week: On July 1, it was trading at just above $5. One week later and following two consecutive two-day rallies, the price was charging past $19. AXS price has since dropped between $18 and $19, yet the coin’s weekly stats are still outstanding: 118% against United States dollar and 119% against Bitcoin (BTC) in a week.
As AXS sits on top of the seven-day price change chart, many traders are wishing that they could have known earlier in the week that the asset was ready to explode. While it is impossible to see into the future, more often than not, solid knowledge of historical precedent can be helpful in identifying opportunities early. That is, if you have the right optics to recognize patterns that previously spelled huge gains.
VORTECS™ score, an AI-powered algorithmic tool exclusively available to the subscribers of Cointelegraph Markets Pro, is no crystal ball. It is trained to search for historical patterns of price change, trading activity and social sentiment around each digital asset, ringing the alarm whenever the current combination of metrics starts to resemble those that, in the past, consistently showed up shortly before the coin rallied.
Not every bull run is underpinned by the same conditions as the ones seen before, but in the case of this week’s AXS price action, a historical precedent has clearly been instructive.
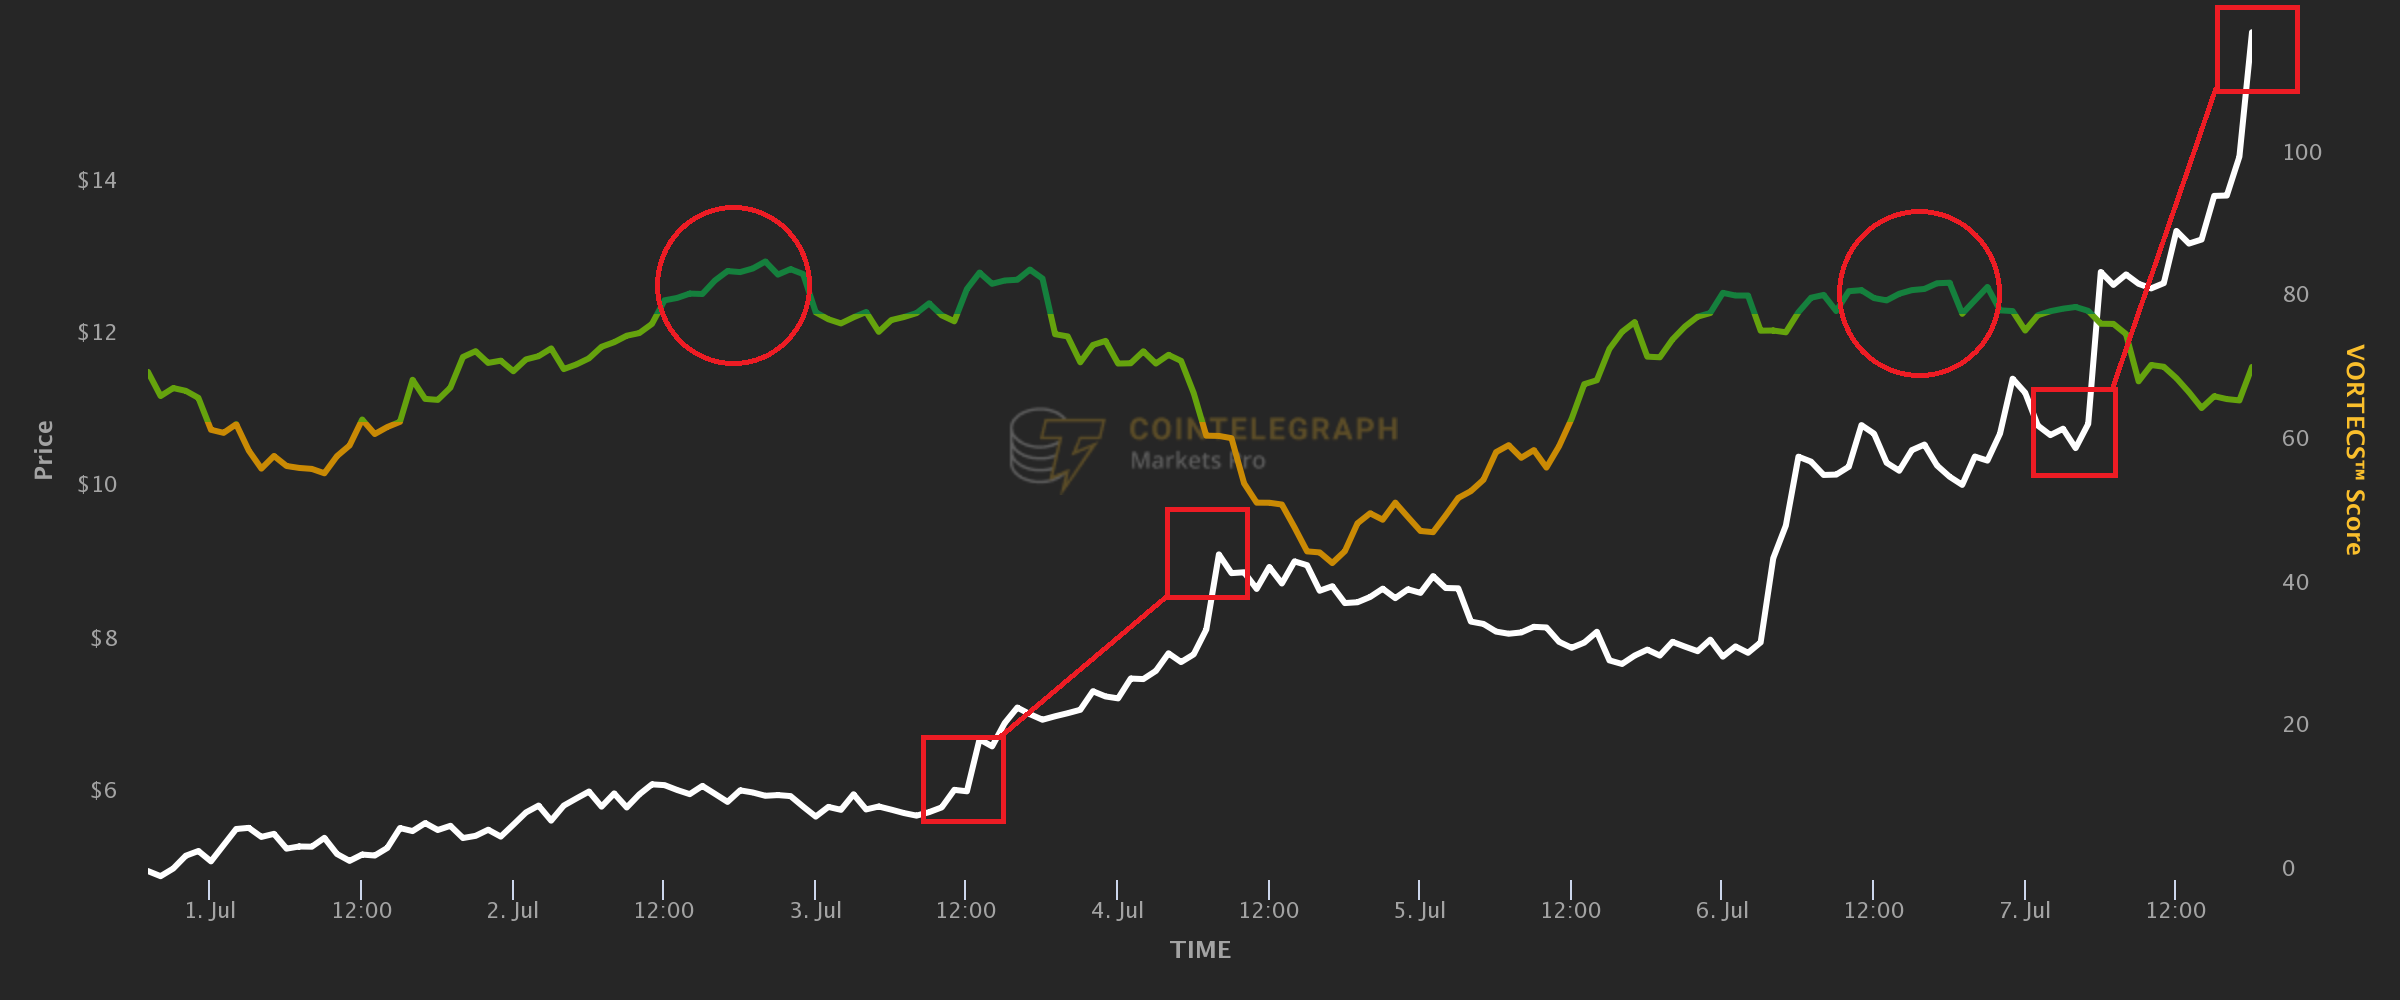
As visible in the AXS price graph, a sequence of high scores was first registered around noon on July 2 (first red circle), roughly 24 hours before the coin’s price jumped from $6.14 to $9.24 (first and second red boxes).
This was already a solid enough run, but the asset kept pushing after a short plateau. On Tuesday, another streak of dark-green scores popped up (second red circle), preceding yet another leg of the rally, from $10.60 to $16 in several hours.
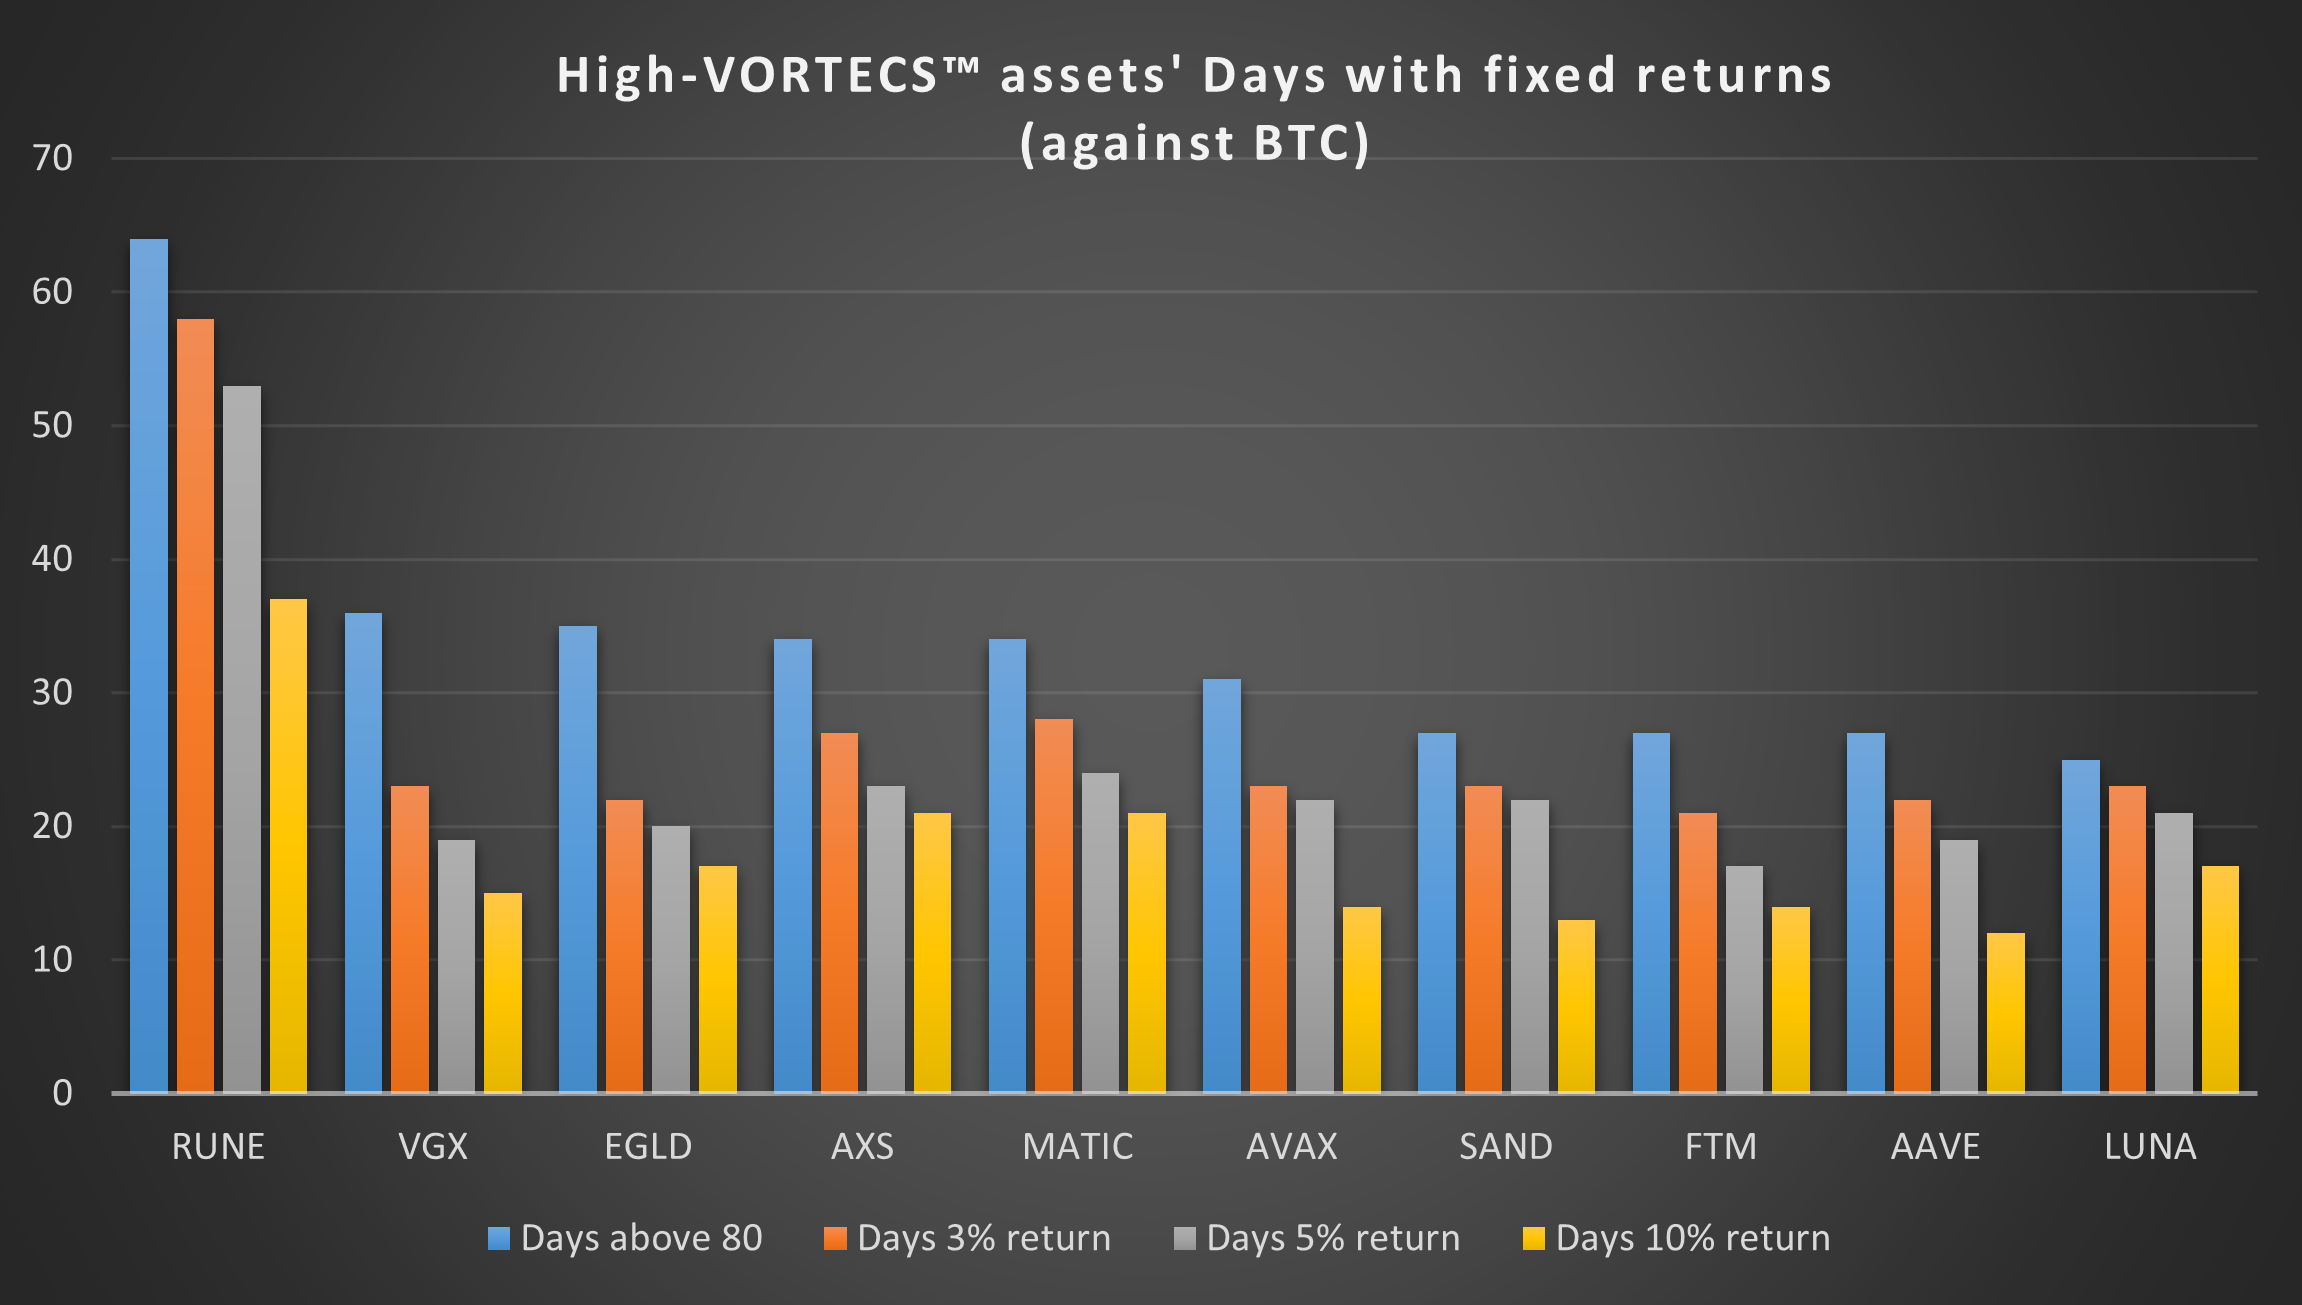
This impressive price action is not out of character for the times when AXS gets a high VORTECS™ score. Since Markets Pro launched in January 2021, the asset has recorded 33 days when it hit a score of 80, a result eclipsed only by three other coins.
Apparently, some coins are more likely than others to travel through beaten paths on their way to massive return on investments, and now there is a quant-style tool to help traders spot such movement early.
Disclaimer. Cointelegraph is a publisher of financial information, not an investment adviser. We do not provide personalized or individualized investment advice. Cryptocurrencies are volatile investments and carry significant risk including the risk of permanent and total loss. Past performance is not indicative of future results. Figures and charts are correct at the time of writing or as otherwise specified. Live-tested strategies are not recommendations. Consult your financial advisor before making financial decisions. Full terms and conditions.


Leave A Comment