
October is proving to be a solid month for Bitcoin (BTC) as the price is nearing the 2023 high at $31,805. Generally, major resistances are not cleared in the first instance as the bears come out in full force to guard the level. Therefore, a minor dip is to be expected, but that should not be considered as the start of a negative sentiment.
Buyers regroup at lower levels and try to form a higher floor. That triggers further buying and starts a rally. This is a possibility in Bitcoin but risks remain. While the cooling of the United States dollar index (DXY) is a positive sign, the weakness in the S&P 500 Index (SPX) is a negative sign.

Could the frustration from the U.S. equities markets drive investors to the cryptocurrency markets? Will Bitcoin decouple from the S&P 500 Index and extend its up-move? Let’s analyze the charts to find out.
S&P 500 Index price analysis
The bears successfully held the retest of the neckline of the head and shoulders pattern in the S&P 500 Index. The failure to shove the price above the 50-day simple moving average (4,382) attracted aggressive selling by the bears.

If the price turns down and maintains below 4,216, the selling may accelerate further and the index could nosedive toward the pattern target of 4,088.
U.S. dollar index price analysis
The U.S. dollar index is witnessing a tough battle between the bulls and the bears. The bulls tried to push the price toward the local high of 107.35 but the bears held their ground.

If the price rebounds off this zone, the bulls will again try to propel the index above 107.35. If they can pull it off, the index may surge to 108 and eventually to 111.
On the contrary, if the price slides below 104.50, it will indicate that the bears are back in the game. The index may then slump to 103.
Bitcoin price analysis
After struggling to sustain above $30,000 for the past three days, the bulls made a decisive move on Oct. 23 and pushed the price to $31,000.
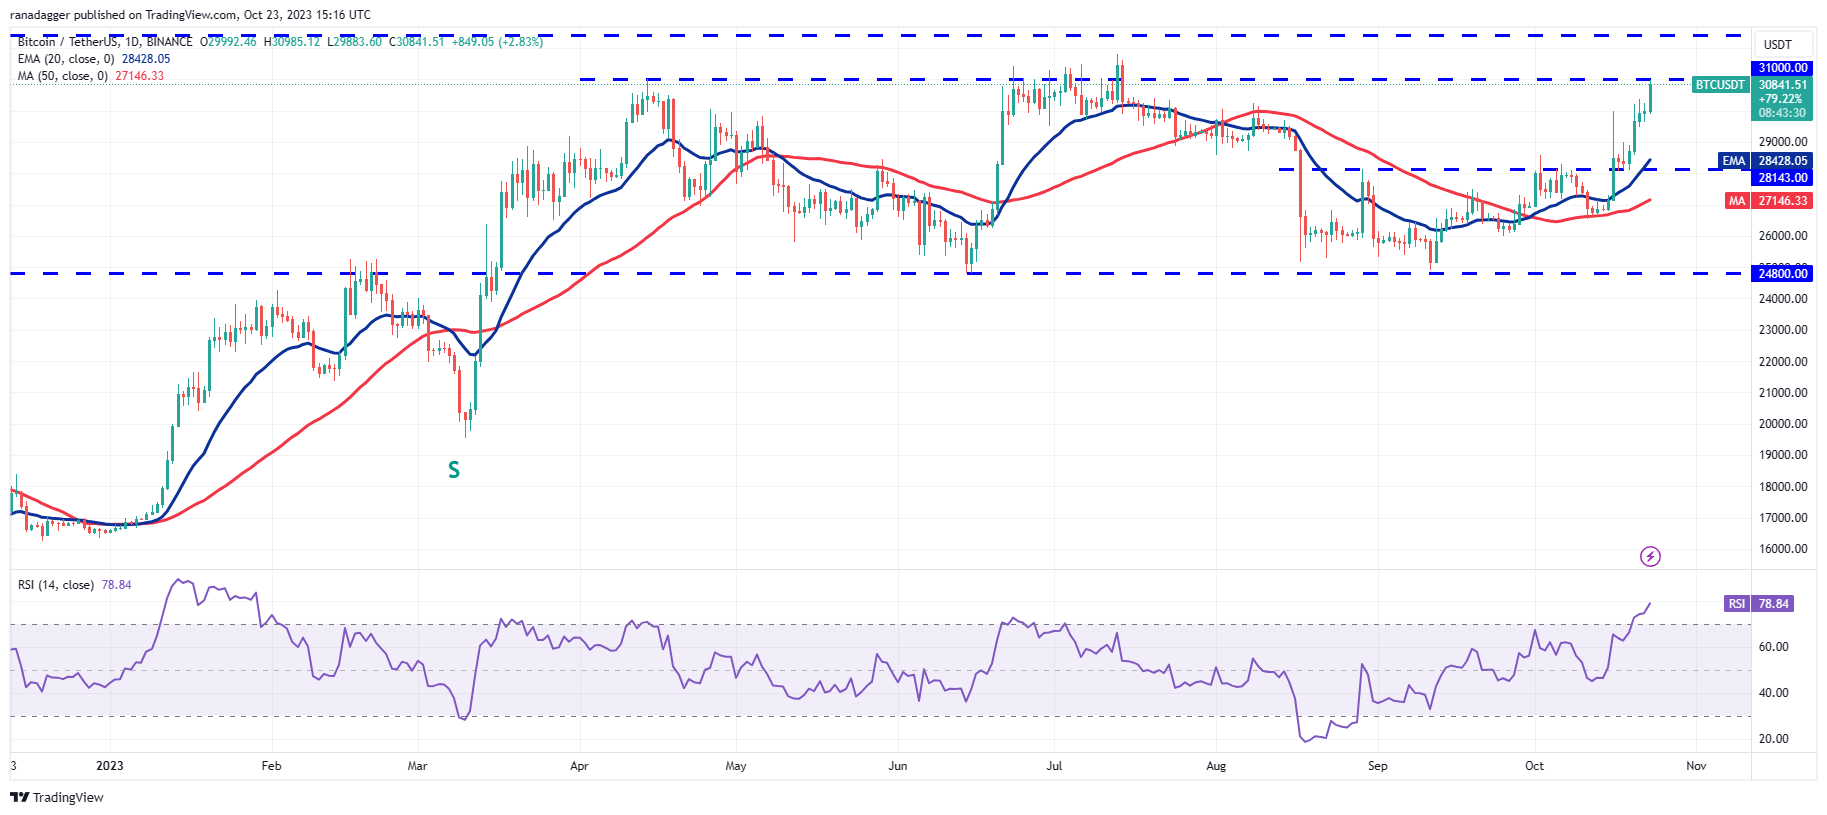
If they succeed, the BTC/USDT pair could rally to $32,400. The bears are expected to defend this level with all their might because if the $32,400 resistance is cleared, the pair may soar to $40,000.
Contrarily, if the price turns down sharply and breaks below $30,000, it will suggest that traders are booking profits. That may sink the price to the 20-day EMA ($28,428).
Ether price analysis
Ether (ETH) broke above the moving averages on Oct. 21, indicating that the bulls continue to buy the dips to the strong support at $1,531.

If bulls do not give up much ground from this level, the likelihood of a rally above $1,746 increases. The pair could then move up to $1,880. Instead, if the price turns down sharply from $1,746, it will indicate that the range-bound action may continue for a few more days.
BNB price analysis
BNB (BNB) broke and closed above the downtrend line on Oct. 22, invalidating the bearish descending triangle pattern. The failure of a bearish setup is a bullish sign.

If bears want to make a comeback, they will have to quickly drag the price below the moving averages. That may open the doors for a retest of the vital support at $203. A slide below this level could start the next leg of the downtrend to $183.
XRP price analysis
XRP (XRP) rose above the moving averages on Oct. 19 and the bulls have maintained the price above this level since then.

Both moving averages are sloping up gradually and the RSI has risen into the positive territory, indicating that the bulls have the upper hand. If buyers kick the price above $0.56, the pair may start a rally to $0.66 and subsequently to $0.71.
Solana price analysis
The bears tried to start a pullback in Solana (SOL) on Oct. 22 but the bulls did not give up much ground. This suggests that the bulls are in no hurry to close their positions as they expect the up-move to continue.
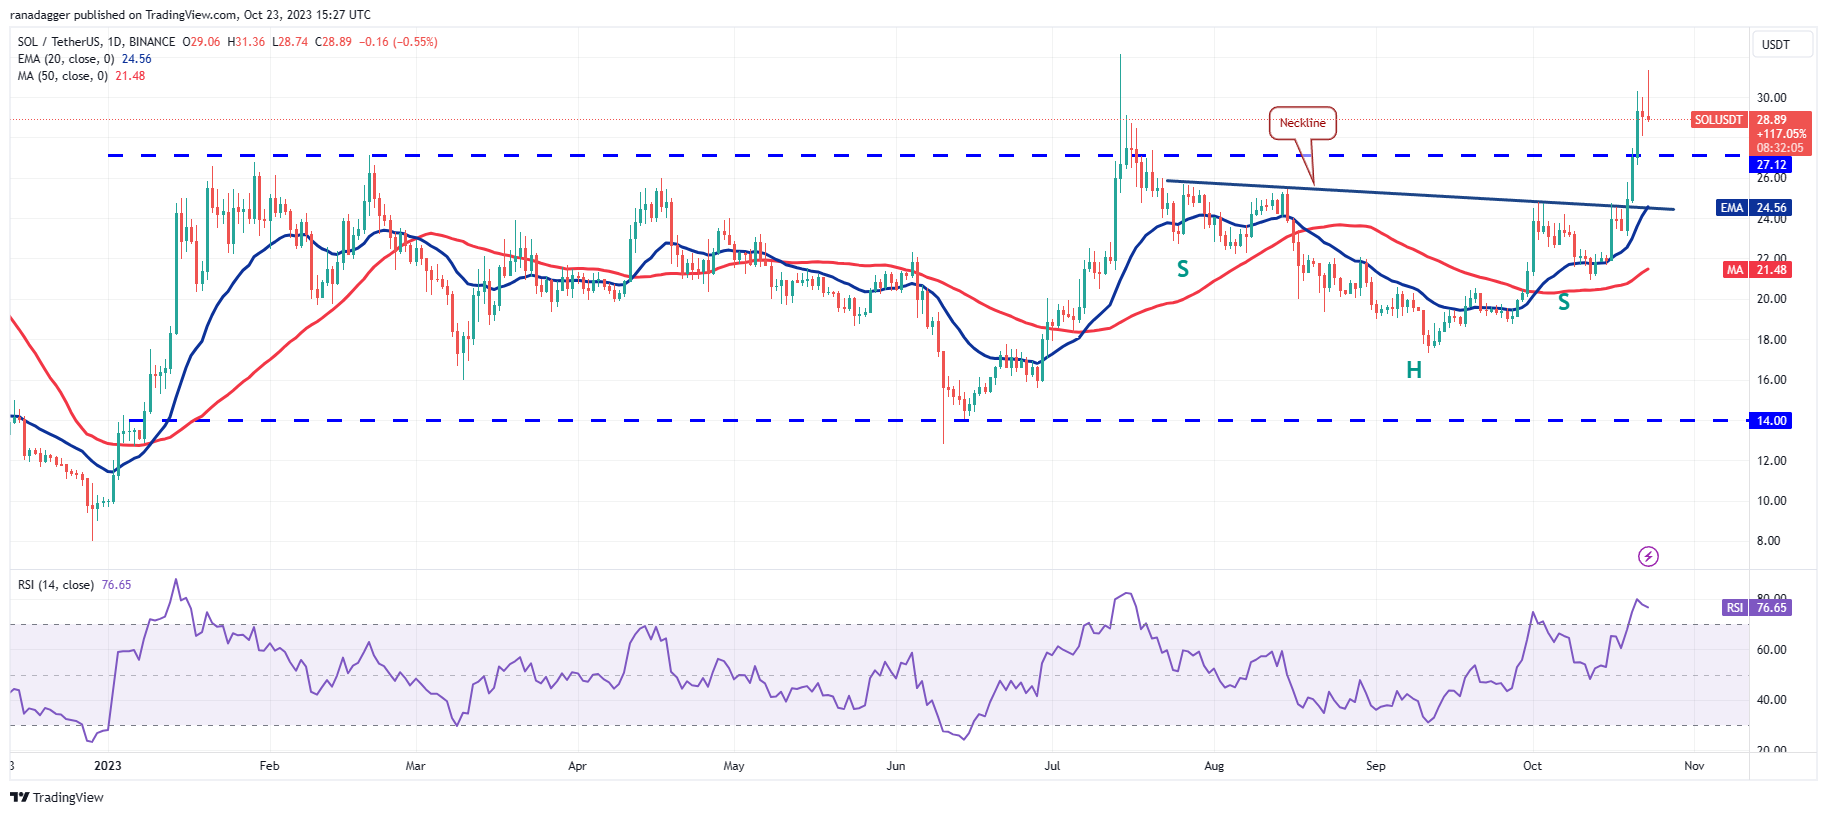
The sharp rally of the past few days has pushed the RSI into overbought territory, indicating that a minor correction or consolidation is possible in the near term. If the SOL/USDT pair continues lower from the current level, the bulls will try to arrest the decline at $27.12 and then at the 20-day EMA ($24.56).
Related: Bitcoin price must break $31K to avoid 2023 ‘bearish fractal’
Cardano price analysis
Cardano (ADA) turned up sharply from $0.24 on Oct. 19 and rose above the moving averages on Oct. 21.
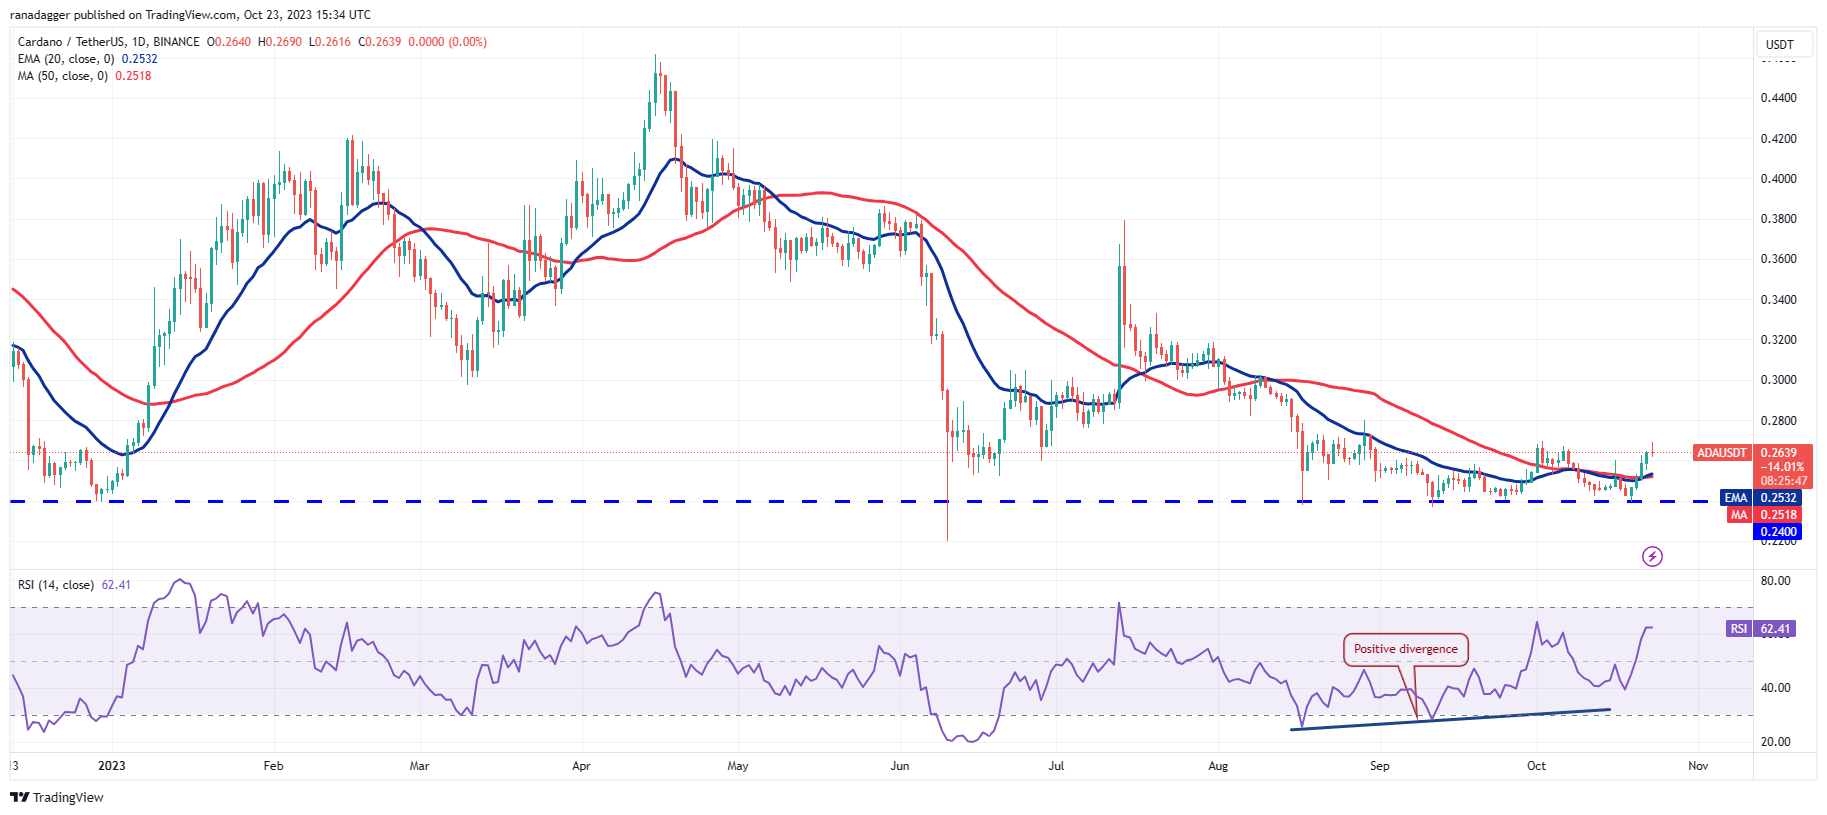
If bears want to prevent this up-move, they will have to tug the price back below the moving averages. The advantage will shift in favor of the bears on a break and close below $0.24.
Dogecoin price analysis
Dogecoin (DOGE) broke and closed above the 50-day SMA ($0.06) on Oct. 22, indicating the start of a relief rally.

The important support to watch on the downside is $0.06. If this level gets taken out, it will suggest that the bears are back in the driver’s seat. The pair may then slide to the critical support at $0.055.
Toncoin price analysis
Toncoin (TON) broke above the immediate resistance at $2.18 on Oct. 22, indicating that the corrective phase is ending.

On any dips, the bulls are likely to defend the moving averages. A break and close below this support will indicate that the bulls may be losing their grip. That could pull the price down to $1.89.
This article does not contain investment advice or recommendations. Every investment and trading move involves risk, and readers should conduct their own research when making a decision.

Leave A Comment