
Price analysis 12/8: BTC, ETH, BNB, XRP, SOL, ADA, DOGE, AVAX, LINK, MATIC
Bitcoin price staged an intraday rally to the $44,000 level and technical charts show altcoins are keen to follow.

Price Analysis
This week Bitcoin (BTC) price saw a shallow pullback, but the intra-day rally to the $44,000 level is an indication that the bulls are not hurrying to close their positions. Data from the popular HODL Waves metric shows that investors who purchased Bitcoin between December 2020 and December 2021 have been sitting on their coins.
Investors have not been selling into strength because they anticipate higher levels in the future. Asset manager VanEck said in its crypto predictions for 2024 that Bitcoin would make a new all-time high, buoyed by the “political events and regulatory shifts following a U.S. presidential election.”
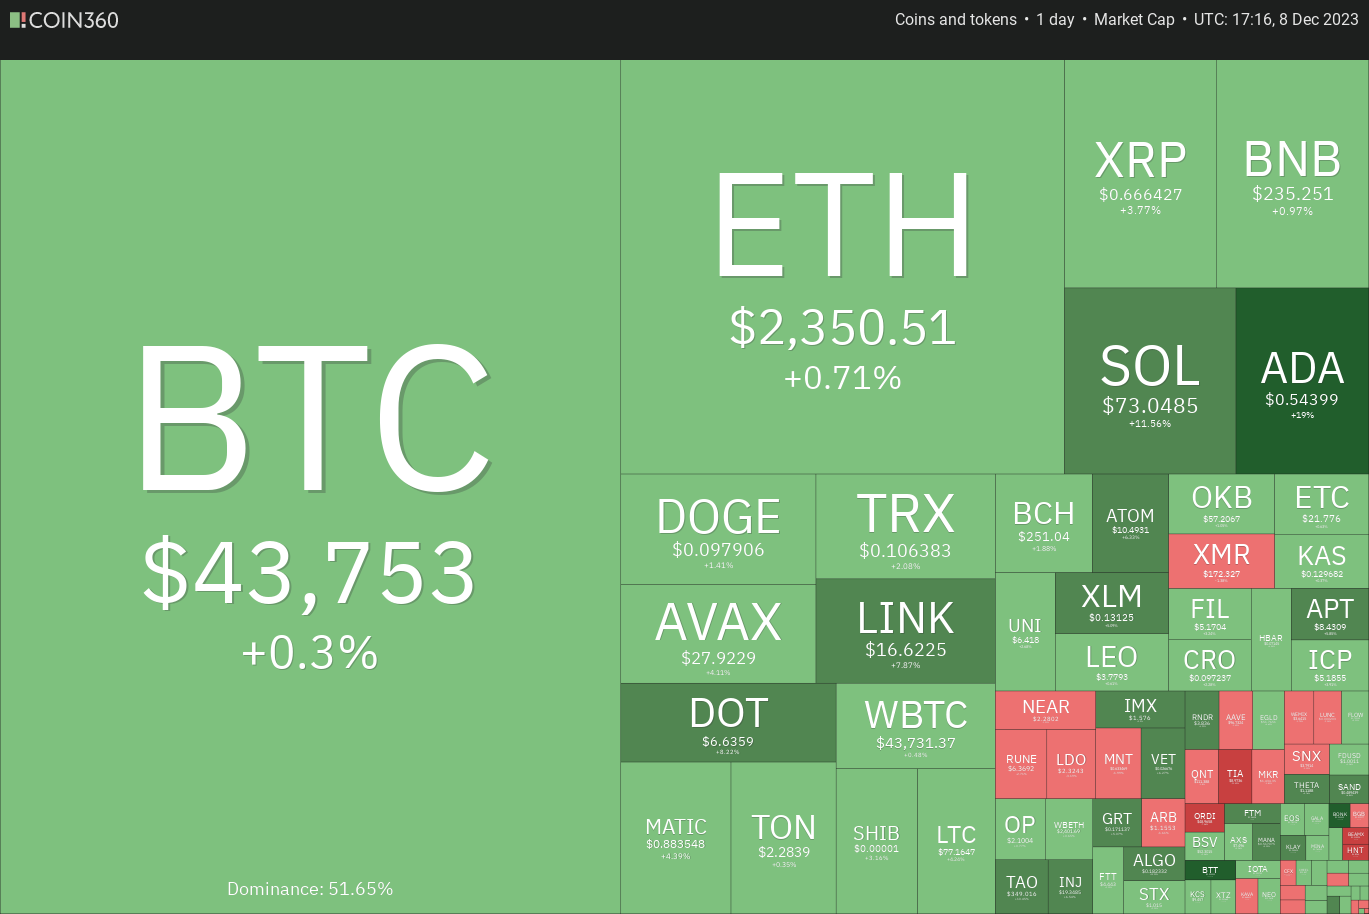
Bitcoin’s rally of the past few days has also attracted investors to select altcoins, such as Ether (ETH), Cardano (ADA) and Solana (SOL). Research firm Santiment remains positive on the prospects of Bitcoin. It said on Dec. 7 that if FUD increases, Bitcoin could surge to $50,000.
Will Bitcoin find buyers at lower levels and resume its charge to $48,000, or will the action shift to altcoins? Let’s analyze the charts of the top 10 cryptocurrencies to find out.
Bitcoin price analysis
Bitcoin turned down from $44,500 on Dec. 5, indicating profit-booking by short-term traders. Pullbacks are usually shallow in strong uptrends and do not last long because the bulls eagerly buy the dips.
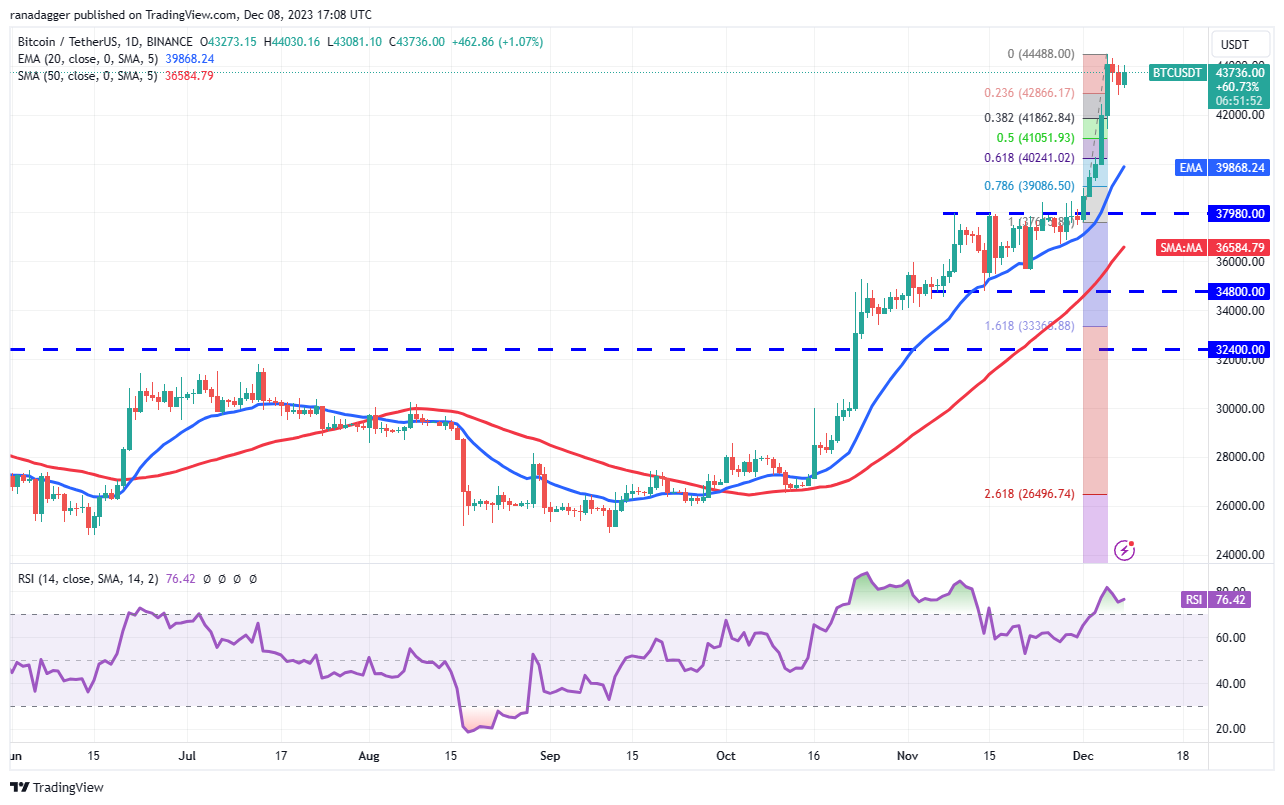
If the price turns up from the current level and breaks above $44,500, it will signal the start of the next leg of the journey toward $48,000. Sellers are expected to defend this level with all their might.
If the price turns down from $44,500, the first support on the downside is at the 38.2% Fibonacci retracement level of $41,862. If this level cracks, the BTC/USDT pair may plunge to the 20-day exponential moving average ($39,868). Buyers will have to defend this level if they want to keep the bullish momentum intact.
Ether price analysis
The bears tried to pull Ether (ETH) below the breakout level of $2,200 on Dec. 6, but the bulls held their ground. This suggests that buyers are attempting to flip $2,200 into support.
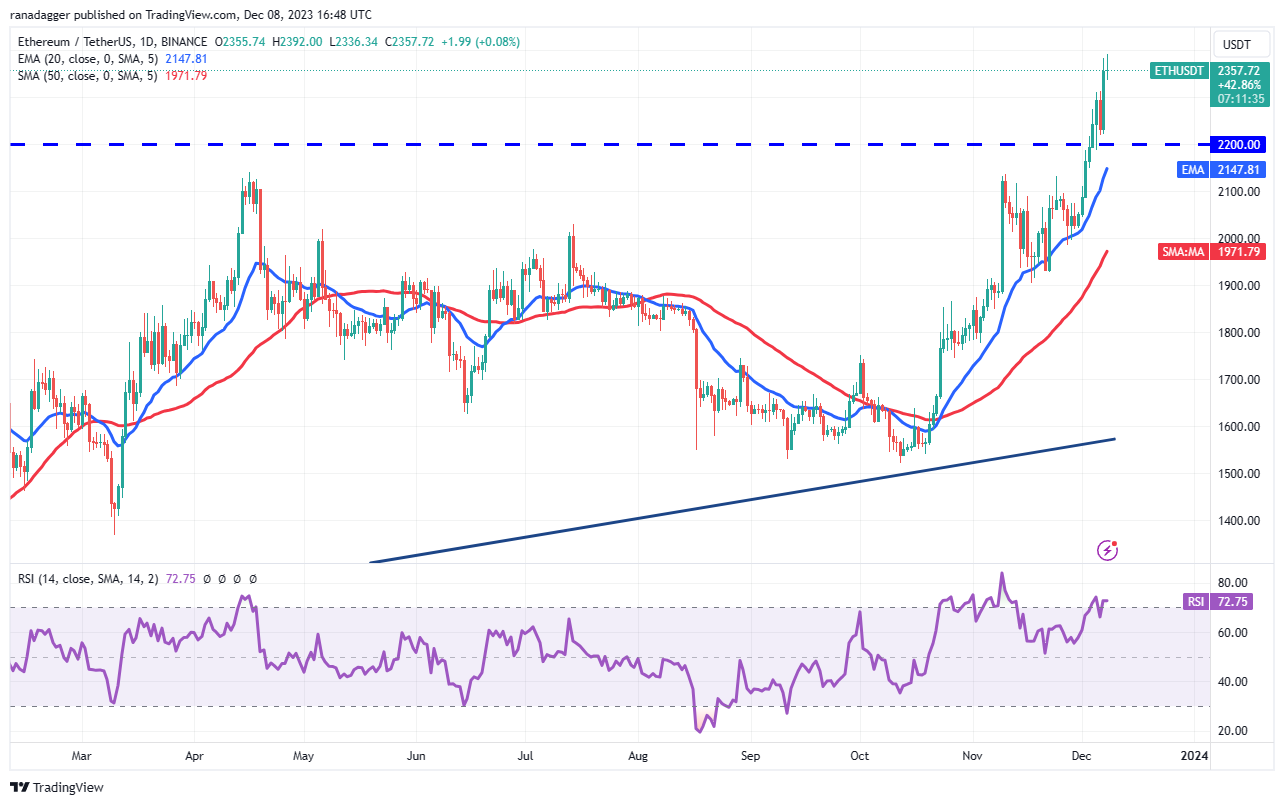
The ETH/USDT pair completed a bullish ascending triangle pattern when it broke out of $2,200. This bullish setup has a target objective of $3,400. However, it is unlikely to be a straight dash higher. Sellers will try to halt the advance near $2.500 and again at $3,000.
The critical support zone for the downside is between $2,200 and the 20-day EMA ($2,147). If the price skids below this zone, it may trap several aggressive bulls, resulting in long liquidation. That could start a steep correction toward $1,900.
BNB price analysis
BNB (BNB) remains stuck inside the $223 to $239 range, indicating a balance between supply and demand.
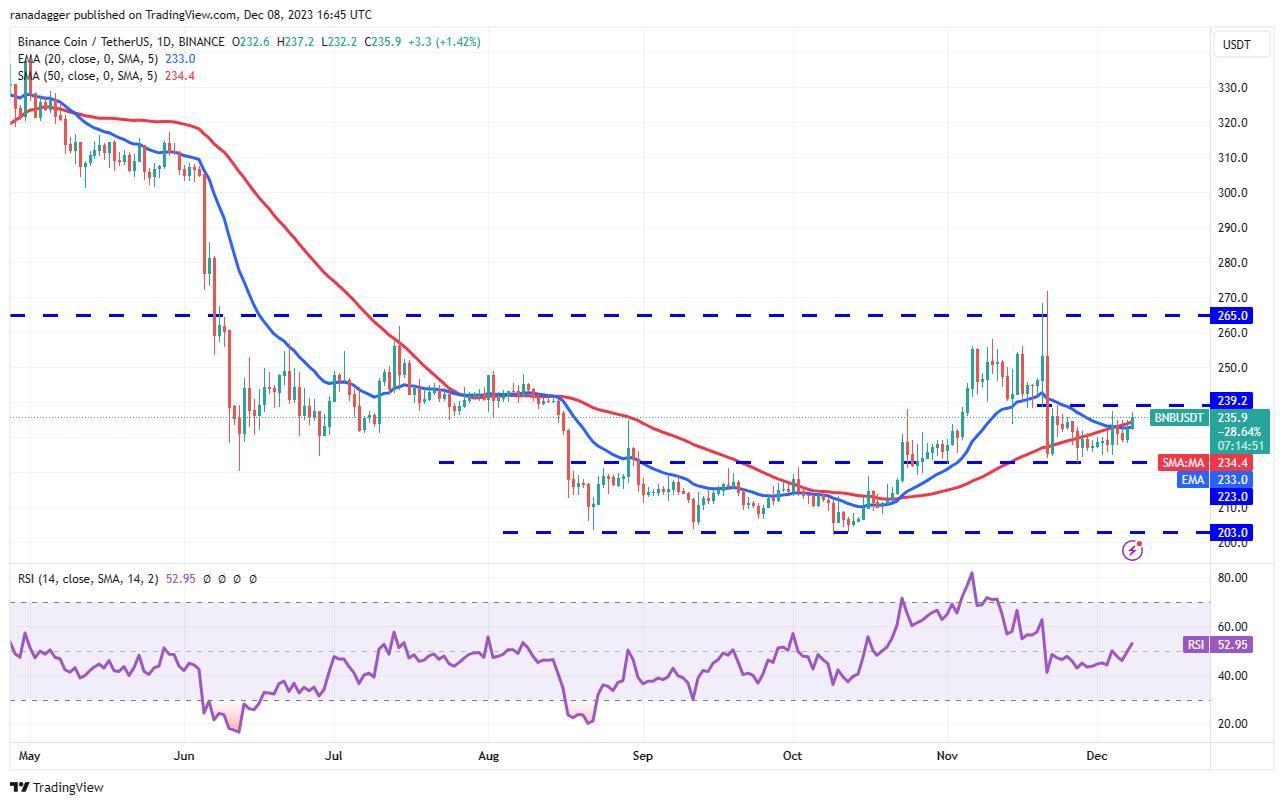
The bulls have pushed the price above the 20-day EMA ($233) and will try to overcome the barrier at $239. If they succeed, the BNB/USDT pair is likely to pick up momentum and jump toward the overhead obstacle at $265. A break and close above this level will complete a bullish inverse head-and-shoulders pattern.
This optimistic view will be invalidated in the near term if the price turns down and plummets below $223. That could sink the pair to the critical support at $203.
XRP price analysis
XRP (XRP) rebounded off the 20-day EMA ($0.62) on Dec. 6, signaling that lower levels are being purchased. The bulls will next try to push the price above $0.67.

However, the sellers are unlikely to give up easily. They will try to mount a stiff resistance at $0.67. If the price turns down from the current level, the XRP/USDT pair is likely to find support at the 20-day EMA.
If the rebound off the 20-day EMA rises above the barrier at $0.67, the XRP/USDT pair is likely to reach $0.74. This level may prove to be a difficult hurdle to cross.
The bears will have to sink and sustain the price below the 50-day SMA ($0.61) if they want to regain control.
Solana price analysis
Solana turned up on Dec. 7 and broke above the 52-week high at $68.20. This indicates the resumption of the uptrend.
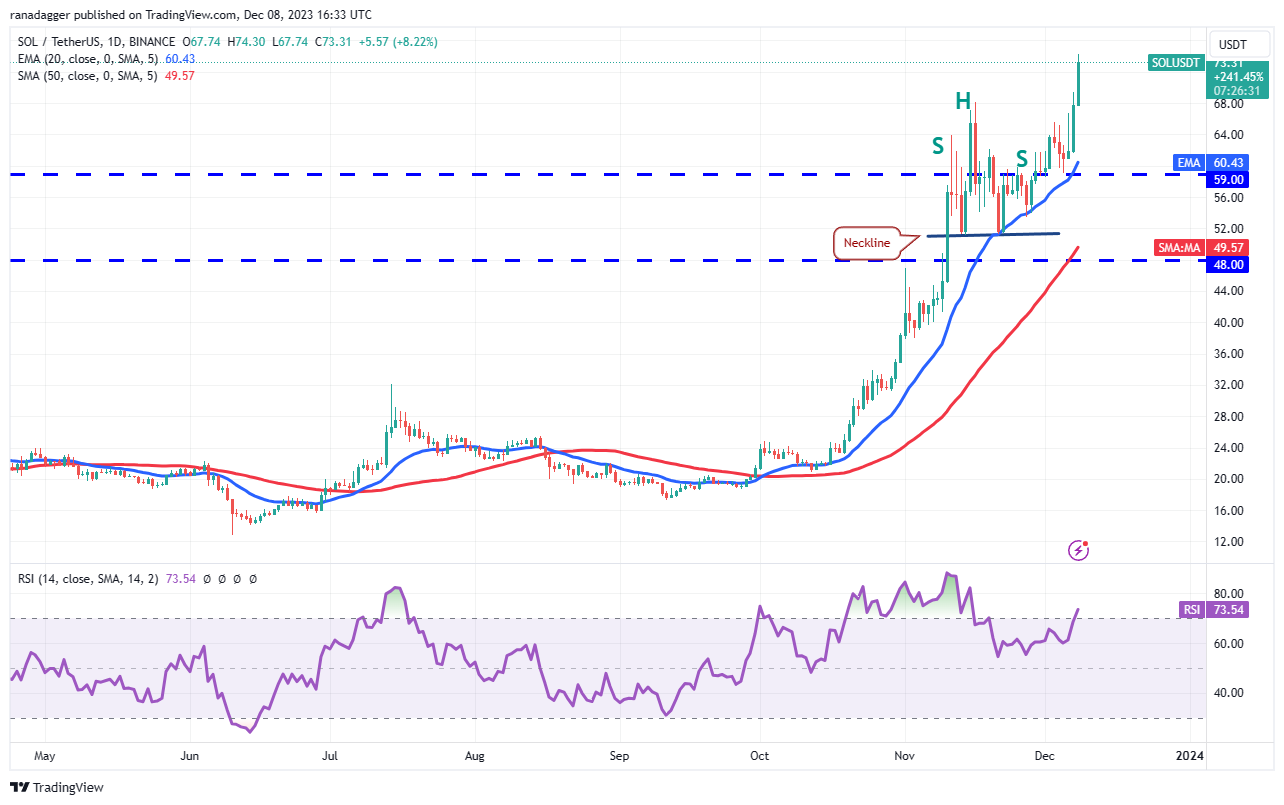
The rally above $68.20 invalidated the bearish H&S pattern, which is a positive sign. This attracts buying from the bulls who may have been sitting on the sidelines and short-covering by the aggressive bears. There is a minor hurdle at $78, but if it is scaled, the SOL/USDT pair could surge to $100.
If bears want to get back into the game, they will have to yank the price below the 20-day EMA ($60). The next stop on the downside is at $51.
Cardano price analysis
Cardano has been on a roll since closing above the $0.40 resistance on Dec. 4. Buyers pushed the price above $0.46 on Dec. 7 and followed that up with another move higher above $0.52 on Dec. 8.
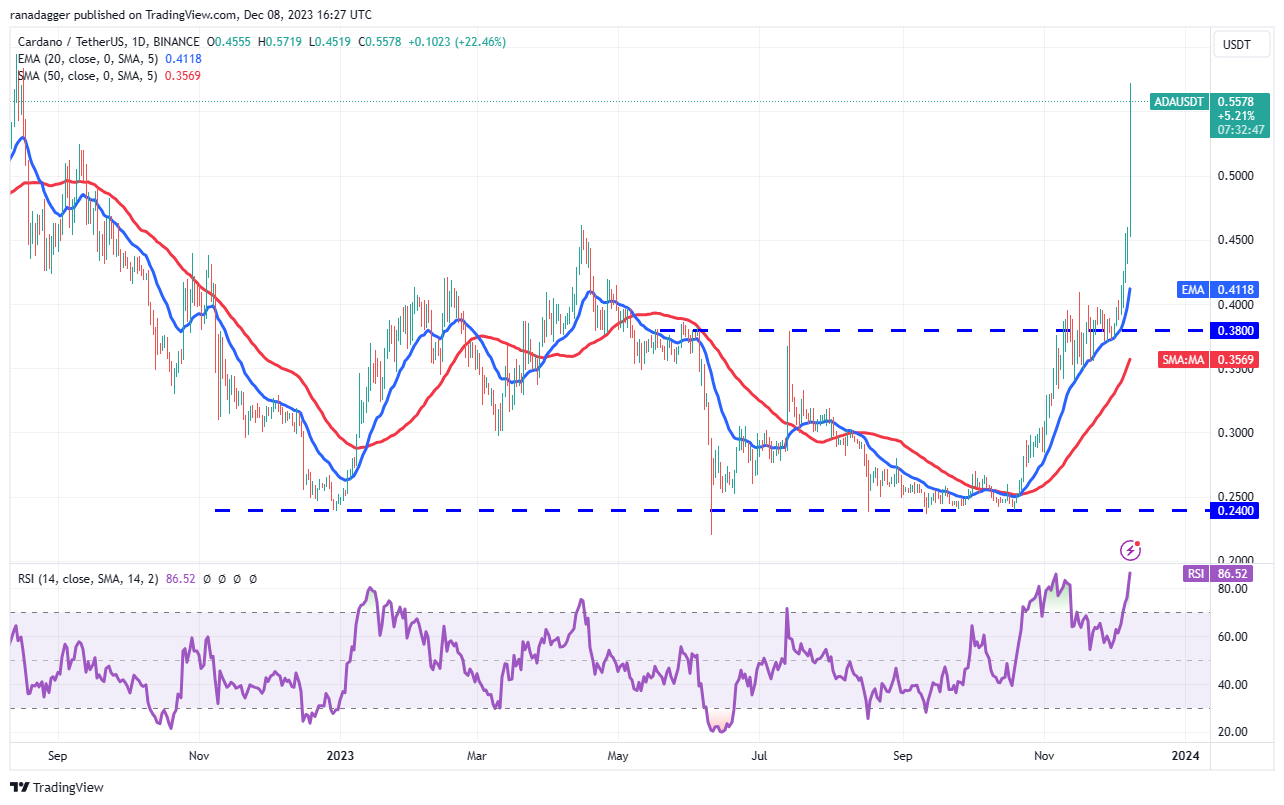
The next level to watch out for on the upside is $0.60, but the overbought level on the RSI suggests a minor correction or consolidation is possible in the near term. If bulls do not give up much ground from the current level, it increases the possibility of a rally to $0.70.
Contrarily, if the ADA/USDT pair turns down from the current level, it is likely to find support at $0.52 and again at $0.46. A slide below this support will clear the path for a possible decline to the 20-day EMA ($0.41).
Dogecoin price analysis
Dogecoin (DOGE) skyrocketed near $0.11 on Dec. 6 but the bulls could not sustain the higher levels as seen from the long wick on the candlestick.
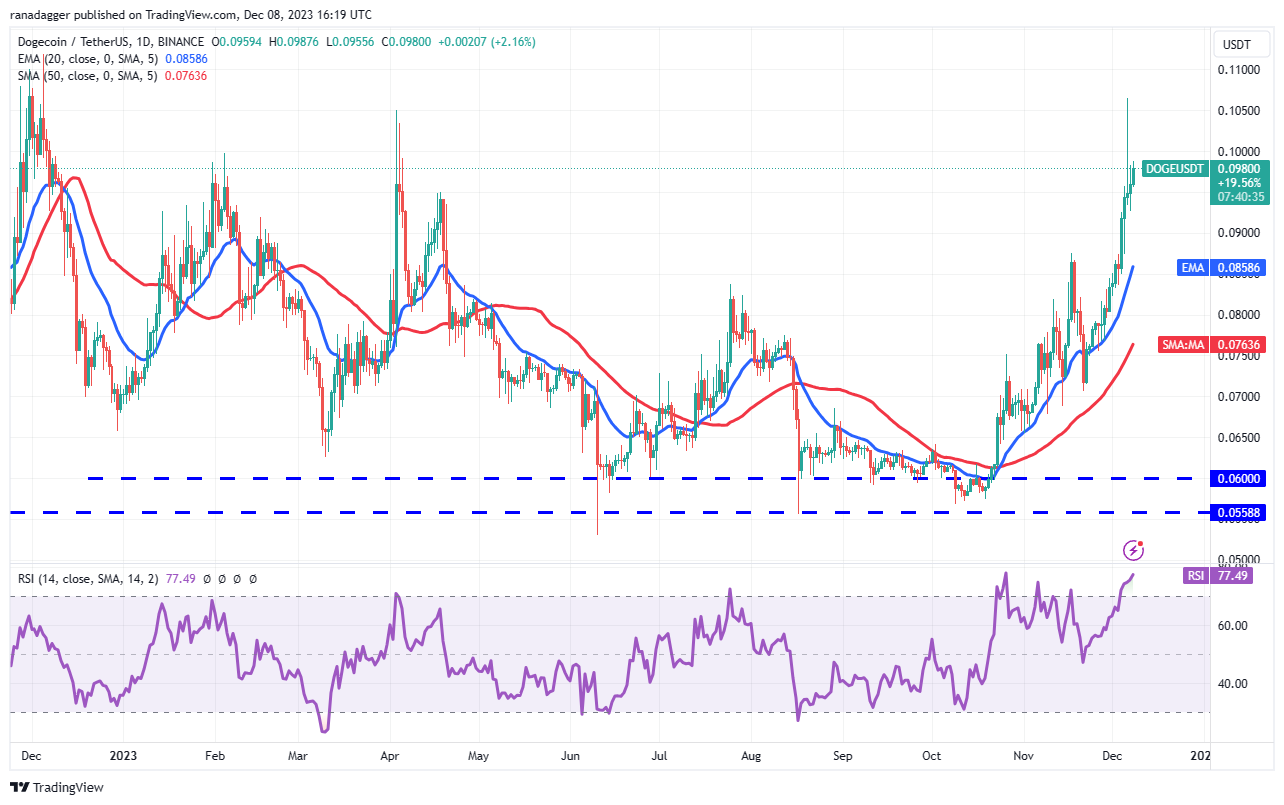
A minor advantage in favor of the bulls is that they have not allowed the price to remain below $0.10. This suggests that every little dip is being purchased. The bulls will again try to catapult the price above the $0.11 resistance. If they manage to do that, the DOGE/USDT pair could soar to $0.14 and later to $0.16.
The first sign of weakness will be a drop below the 20-day EMA ($0.09). That will indicate profit-booking by short-term traders. The pair may then drop to $0.07.
Related: Bitcoin’s many deaths: Is crypto market past ‘point of no return?’
Avalanche price analysis
Avalanche (AVAX) has been facing resistance near $28, but the bulls have not ceded ground to the bears. This suggests that bulls remain in control.
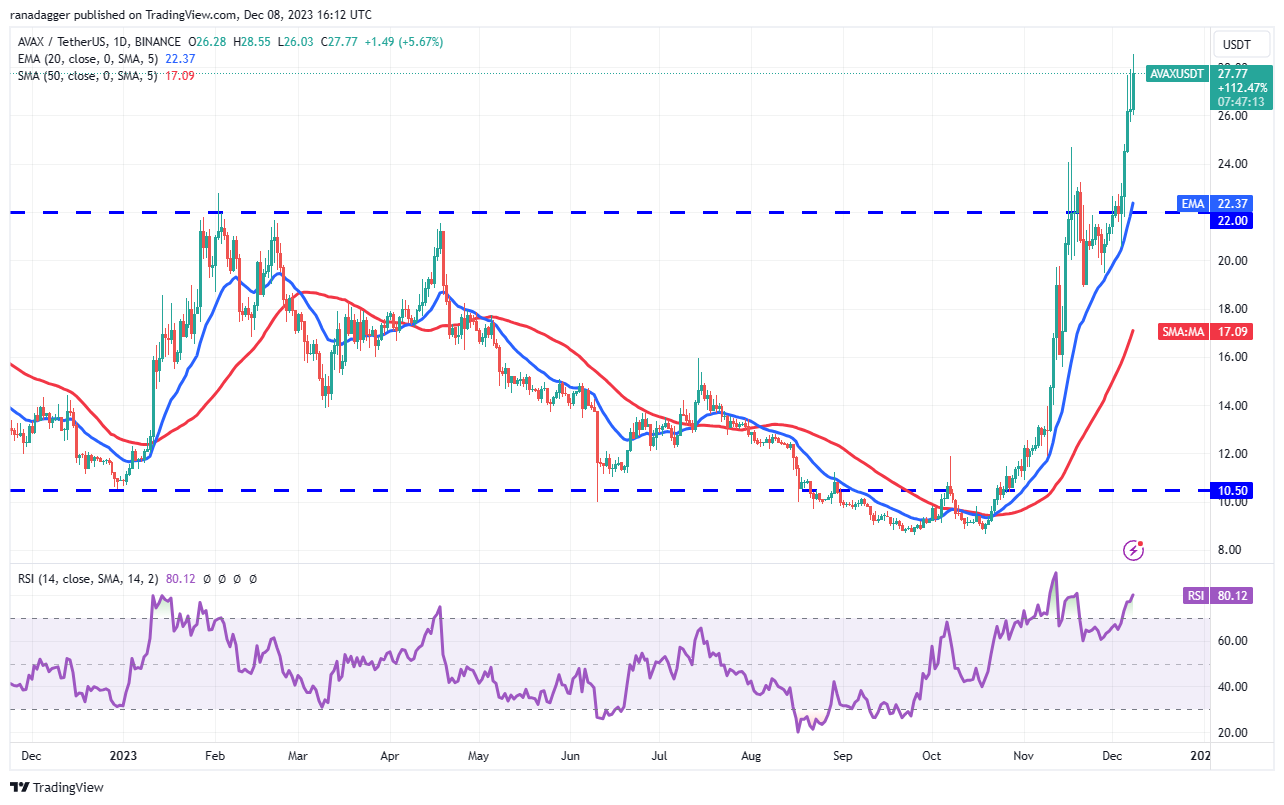
The bulls will try to resume the uptrend and kick the price to the overhead resistance at $31. This level is likely to attract aggressive selling by the bears. The overbought levels on the RSI also point to a near-term risk of a correction or consolidation.
The first support on the downside is at $24.69. If this level cracks, the AVAX/USDT pair may fall to the 20-day EMA ($22.37). Buyers are expected to fiercely protect this level because the next support is much lower at $18.90.
Chainlink price analysis
Chainlink (LINK) took support at the 20-day EMA ($15.04) on Dec. 7, indicating that the sentiment remains positive and traders are buying on dips.
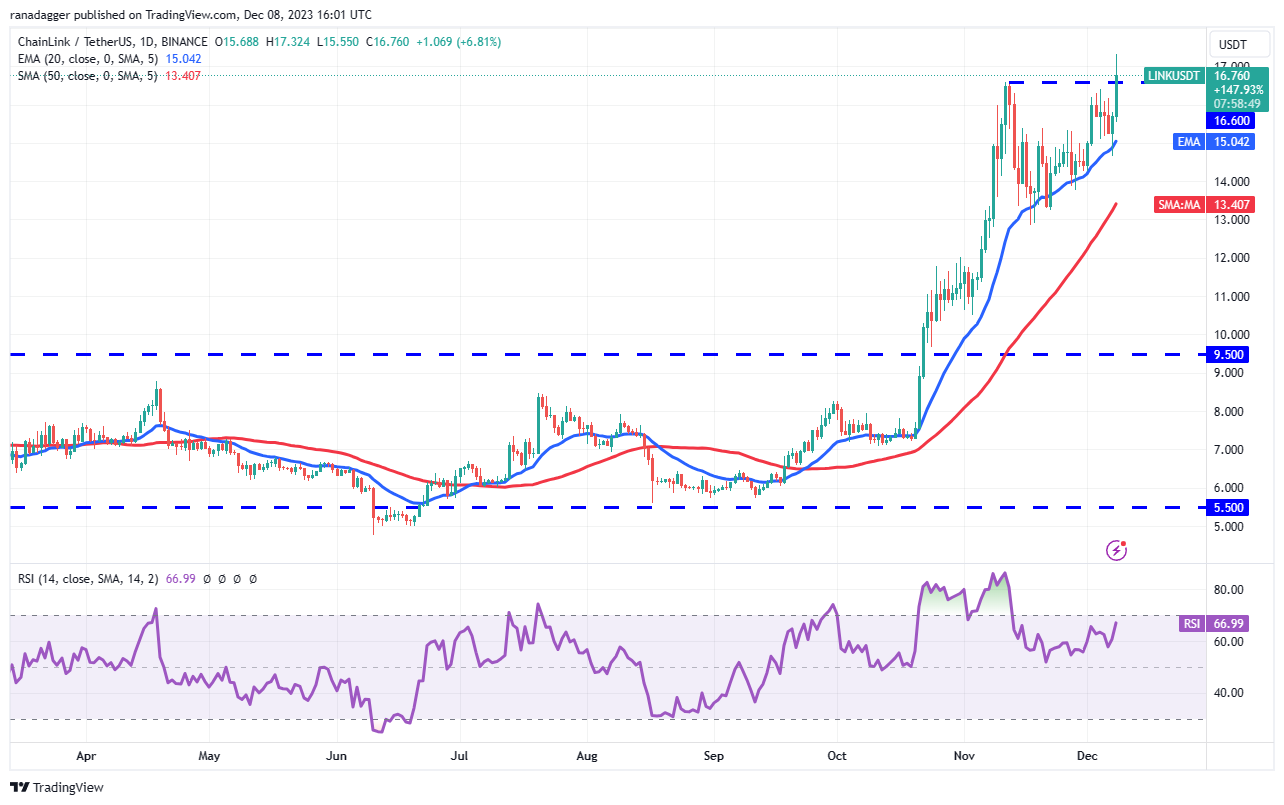
The bulls continued their buying on Dec. 8, pushing the price above the overhead resistance at $16.60. If buyers sustain the breakout, it will indicate the resumption of the uptrend. The LINK/USDT pair could jump to $18.30 and subsequently to $19.50.
On the contrary, if the price turns down and closes below $16.60, it will suggest that bears remain active at higher levels. That will enhance the prospects of a drop below the 20-day EMA. The pair could then tumble to $13.
Polygon price analysis
Polygon (MATIC) has been range-bound between $0.89 and $0.49 for the past several days. The bulls are trying to drive the price above the overhead resistance and start a new uptrend.
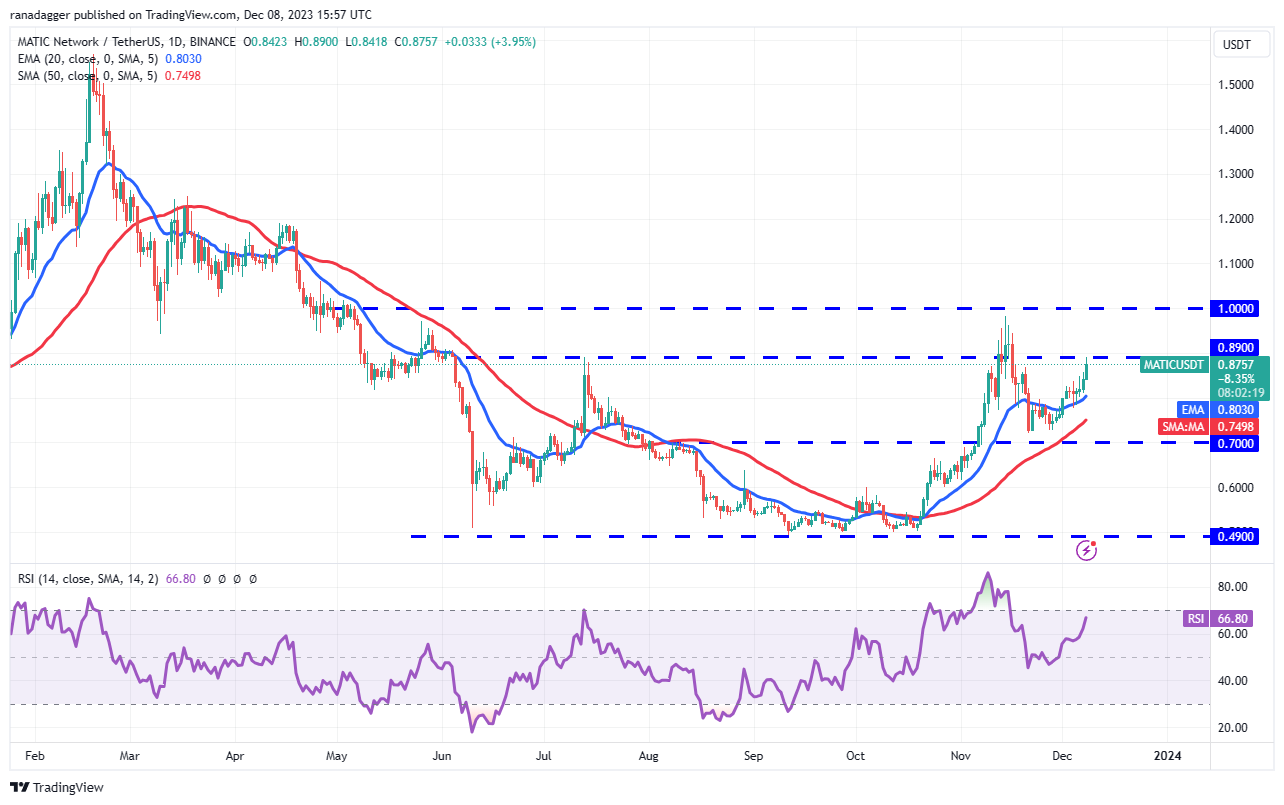
The 20-day EMA ($0.80) has started to turn up, and the RSI is near the overbought territory, indicating that the path of least resistance is to the upside. If buyers push the price above $0.89, the MATIC/USDT pair could reach the psychological level of $1. This level may again offer stiff resistance to the bulls.
If the price turns down from $1 but rebounds off $0.89, it will indicate that bulls remain in command. That could increase the possibility of a rally to $1.20. The bears will be back in the driver’s seat if they sink and maintain the price below the 50-day SMA ($0.75).
This article does not contain investment advice or recommendations. Every investment and trading move involves risk, and readers should conduct their own research when making a decision.
Add reaction


Leave A Comment