
Hong Kong tech company Meitu revealed on April 8 that it had added $10 million worth of Bitcoin (BTC) to its holdings which were purchased at an average rate of $57,000 per coin. After the latest purchase, Meitu’s total cryptocurrency portfolio consists of $49.5 million worth of Bitcoin and $50.5 million worth of Ether (ETH). This acquisition shows that institutional investors are confident that the rally in Bitcoin is still in its early stages.
Tom Jessop, Fidelity’s head of the crypto division, believes that Bitcoin has reached a tipping point and that traditional finance companies will continue to adopt cryptocurrency aggressively in the next few years. Jessop believes the massive monetary stimulus from governments and central banks has accelerated institutional adoption and this is a trend that could extend for at least another year.

While crypto adoption is on the rise, some legacy finance firms are still taking an anti-crypto approach. HSBC has reportedly blacklisted MicroStrategy stock and will not allow customers on its HSBC InvestDirect platform to buy shares from the company.
Will Bitcoin and major altcoins extend their uptrend and attract more buyers or will they enter a corrective phase? Let’s analyze the charts of the top-10 cryptocurrencies to find out.
BTC/USDT
The bears could not capitalize on Bitcoin’s break below the 20-day exponential moving average ($57,043) on April 7. Their failure to break the 50-day simple moving average ($54,572) support could have attracted buying from the aggressive bulls, resulting in the rebound on April 8.
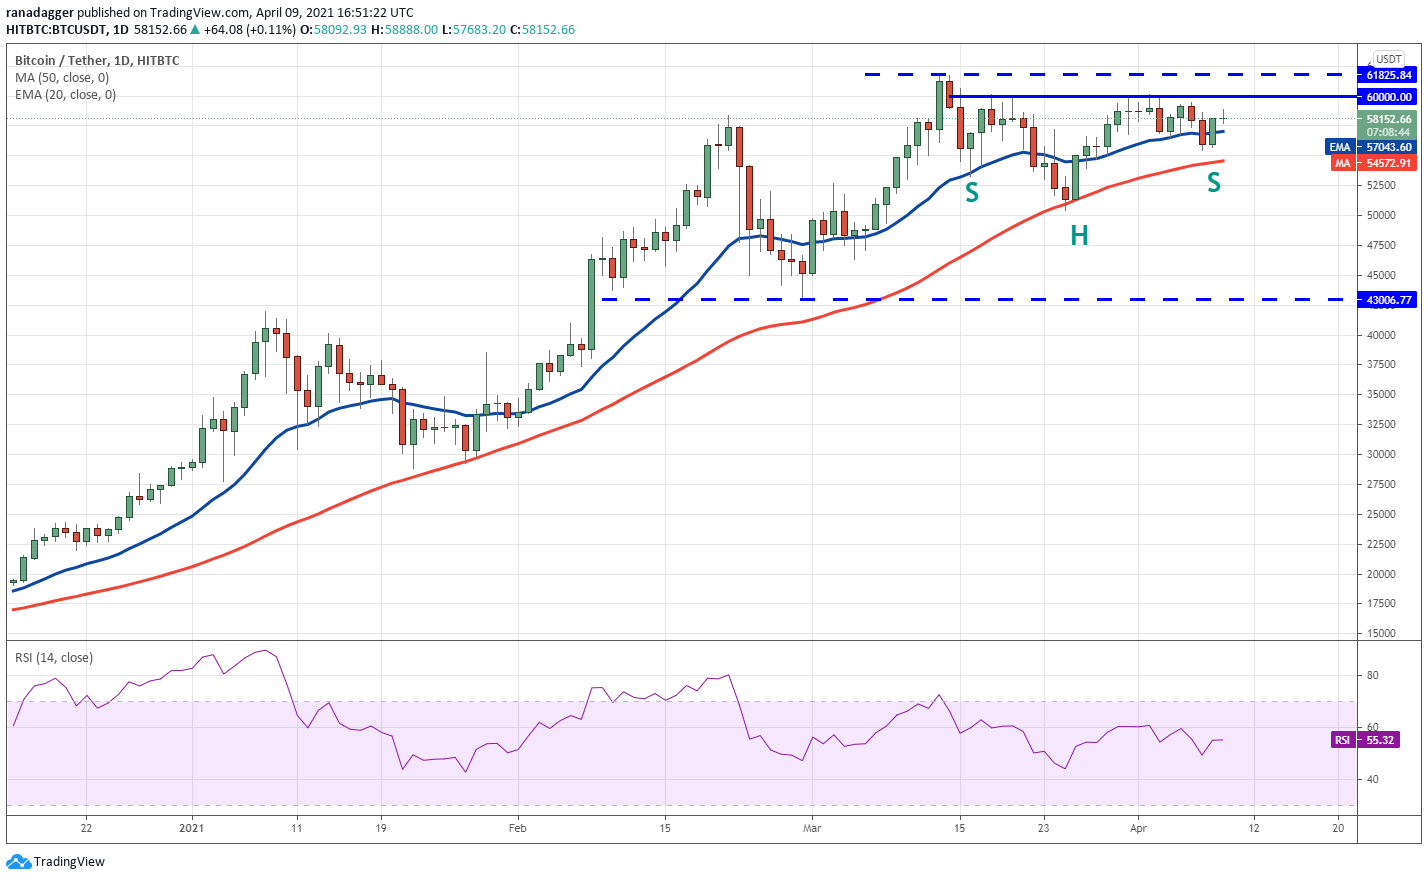
The BTC/USDT pair has formed an inverse head and shoulders pattern that will complete on a breakout and close above $60,000. This bullish setup has a target objective at $69,540. If the bulls sustain the momentum and clear this hurdle, the uptrend may reach the next target at $79,566.
Contrary to this assumption, if the price turns down from the current level, the bears will once again try to break the critical support at the 50-day SMA. If they succeed, the selling could intensify as short-term traders may rush to the exit. That could pull the pair down to $50,460.02 and then $43,006.77.
ETH/USDT
Ether’s (ETH) drop on April 7 was arrested at the 20-day EMA ($1,933), which shows the bulls are accumulating on dips. The price rebounded sharply on April 8 and rose above the resistance at $2,040.77.

However, the bears are likely to have other plans. They will try to pull the price below the 20-day EMA. If that happens, several aggressive bulls may get trapped. That could intensify the selling, resulting in a drop to the trendline. A break below this support will suggest a change in trend.
BNB/USDT
Binance Coin (BNB) continues to be in a strong uptrend. The bulls flipped the $348.69 level to support on April 7 and followed that up with a breakout to a new all-time high on April 8. This shows a strong appetite from the bulls.

On any correction, the first support to watch out for is the 20-day EMA ($334). A strong rebound off this support will suggest the sentiment remains bullish and traders are buying on dips.
However, if the BNB/USDT pair dips below the 20-day EMA, it will suggest that the bullish momentum is weakening.
XRP/USDT
XRP made successive inside day candlestick formations on April 7 and April 8. The current price action is pointing to another inside-day candlestick pattern today. The drop in daily volatility shows the altcoin is still digesting the recent gains.

Alternatively, if the indecision resolves to the downside, it will suggest that supply exceeds demand and traders have dumped their positions. If that happens, the pair could drop to the 20-day EMA ($0.72). A break below this level could pull the price down to $0.65.
ADA/USDT
Cardano (ADA) dipped below the 20-day EMA ($1.18) on April 7 but the bulls did not allow the price to slip below the 50-day SMA ($1.16). This shows the bulls are defending the moving averages aggressively.

If the price again reverses direction from $1.48, it will suggest that the range-bound action may continue for a few more days. On the other hand, if the bulls can drive the price above $1.48, the pair could resume the uptrend toward the next target objective at $2.
A break below the moving averages will be the first sign of weakness and that could result in a drop to the $1.02 support. If this level breaks down, the bears could start a deeper correction to $0.80.
DOT/USDT
Polkadot (DOT) bounced off the 20-day EMA ($38.68) on April 7, indicating buying on dips. The bulls will now try to push the price above the overhead resistance at $42.28.
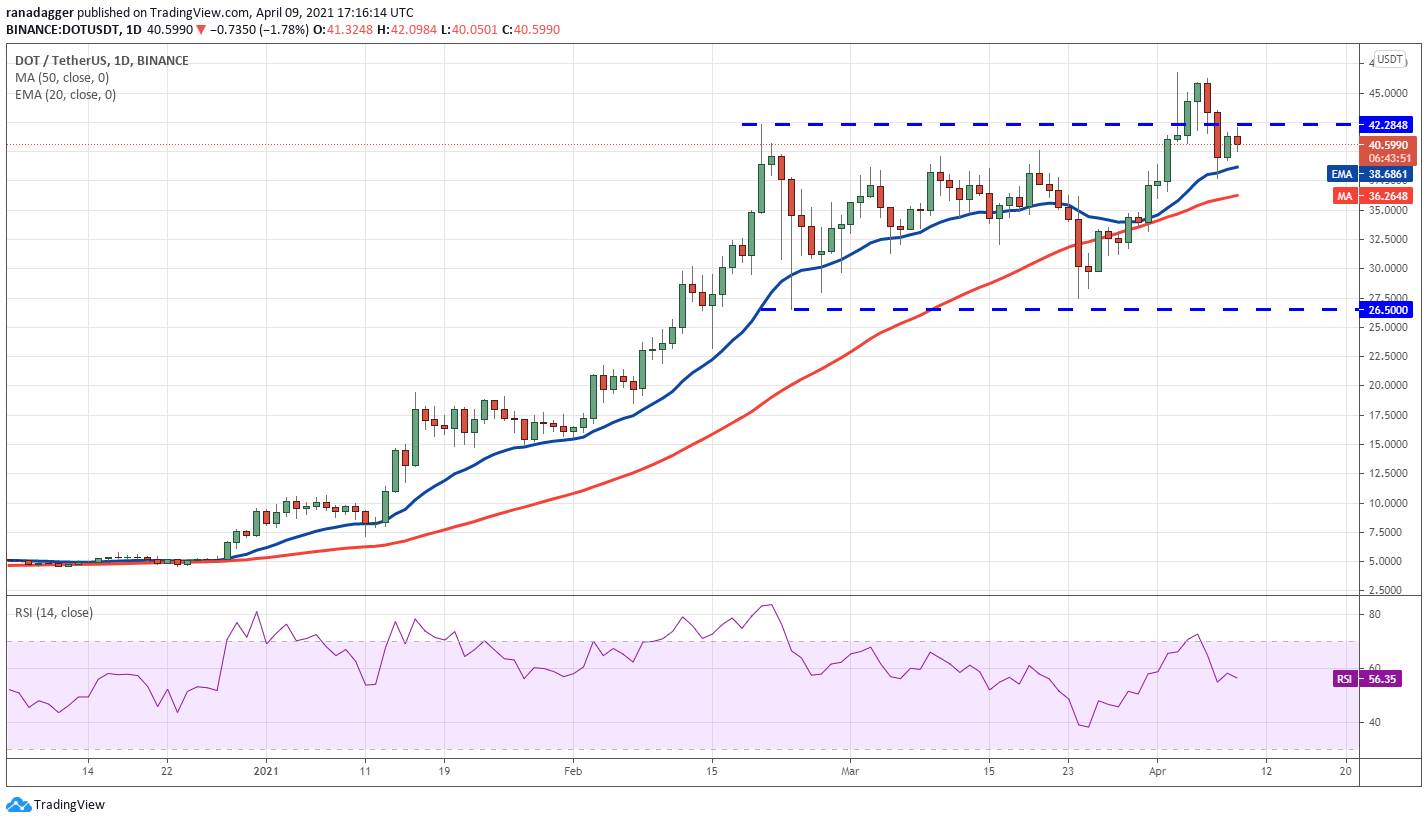
The gradually upsloping 20-day EMA and the RSI in the positive territory suggest the bulls have the upper hand.
However, if the price turns down from the current level and breaks below the moving averages, it will indicate that traders are closing their positions on rallies. That could result in a fall to $32.50 and then $26.50.
UNI/USDT
The bulls successfully held the $27.97 support on April 7, which is a positive sign as it shows accumulation on dips. Uniswap (UNI) bounced back above the 20-day EMA ($29.65) on April 8 and the buyers will now try to push the price above $32.50.

Contrary to this assumption, if the price turns down from the current level, the bears will make one more attempt to pull the price below the $27.97 to $25.50 support zone. If they manage to do that, the pair could start a deeper correction to $20.74.
LTC/USDT
Litecoin (LTC) successfully completed the retest of the breakout level from the symmetrical triangle on April 7. That was followed by a rebound on April 8, but the bulls are struggling to pick up momentum.

Contrary to this assumption, if the bulls sustain the momentum and propel the price above $246.96, the pair could start the next leg of the uptrend that may reach $307.42. The gradually rising 20-day EMA and the RSI above 59 suggest a minor advantage to the bulls.
LINK/USDT
Chainlink’s (LINK) sharp reversal on April 7 could not break below the 20-day EMA ($30.29). This shows the sentiment remains positive and the bulls are buying on dips. The rebound on April 8 rose above the $32 resistance but the bulls are struggling to build on this strength today.

On the other hand, if the bulls again defend the 20-day EMA, the LINK/USDT pair could rise to the all-time high at $36.93. A breakout and close above this resistance will suggest the bulls have absorbed the supply and that may indicate the start of the next leg of the uptrend.
However, if the price again turns down from $36.93, the pair could extend its stay inside the range for a few more days.
THETA/USDT
After the large range day on April 7, THETA made an inside day candlestick pattern on April 8 and has followed it up with another one today. This shows indecision among the bulls and the bears about the next directional move. While the bears are defending the overhead resistance, the bulls are buying on every minor dip.

On the contrary, if the bears sink the price below the 20-day EMA, it will be the first sign of a possible change in sentiment. It will suggest that the bulls are no longer buying the dips to the 20-day EMA. The next critical support to watch will be $10.35. If this level is taken out, a deeper correction to the 50-day SMA may start.
The views and opinions expressed here are solely those of the author and do not necessarily reflect the views of Cointelegraph. Every investment and trading move involves risk. You should conduct your own research when making a decision.
Market data is provided by HitBTC exchange.


Leave A Comment