
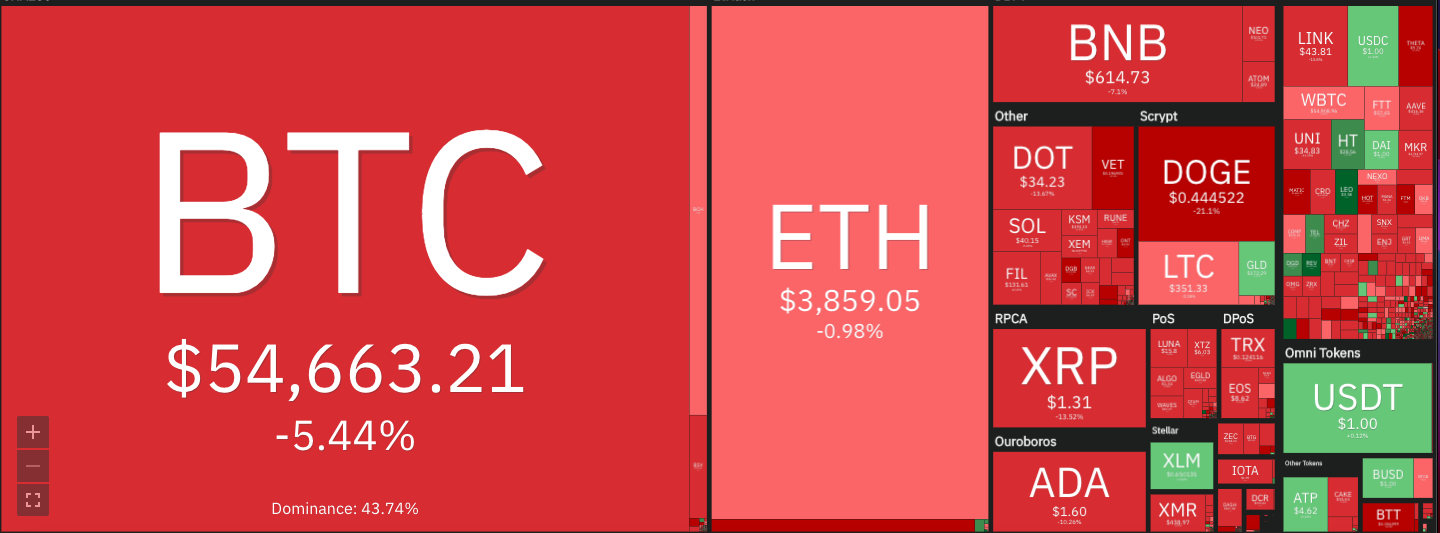
The astronomical rally in Ether (ETH) is not showing any signs of slowing down. The bulls easily cleared the overhead hurdle at $4,000 today, which also pushed the biggest altcoin’s market dominance to over 19%.
It is not only Ether that is witnessing sharp buying from traders. Litecoin (LTC) and Cardano (ADA) have also risen new all-time highs, suggesting a broad-based altcoin rally.
However, Bitcoin (BTC) seems to have lost its momentum as it continues to struggle near the $60,000 mark. That has pulled its market dominance to below 44% for the first time since July 2018.
“If gold’s monetary value is $4 trillion, then digital gold should move up to that total,” Yusko added. That means Bitcoin will have to rise to $235,000 in the future to fulfill Yusko’s prediction.
Let’s analyze the charts of the top-10 cryptocurrencies to spot the critical support and resistance levels.
BTC/USDT
Bitcoin has been sandwiched between the moving averages and the $58,966.53 resistance for the past two days. This tight range trading suggests a status of equilibrium between the bulls and the bears.
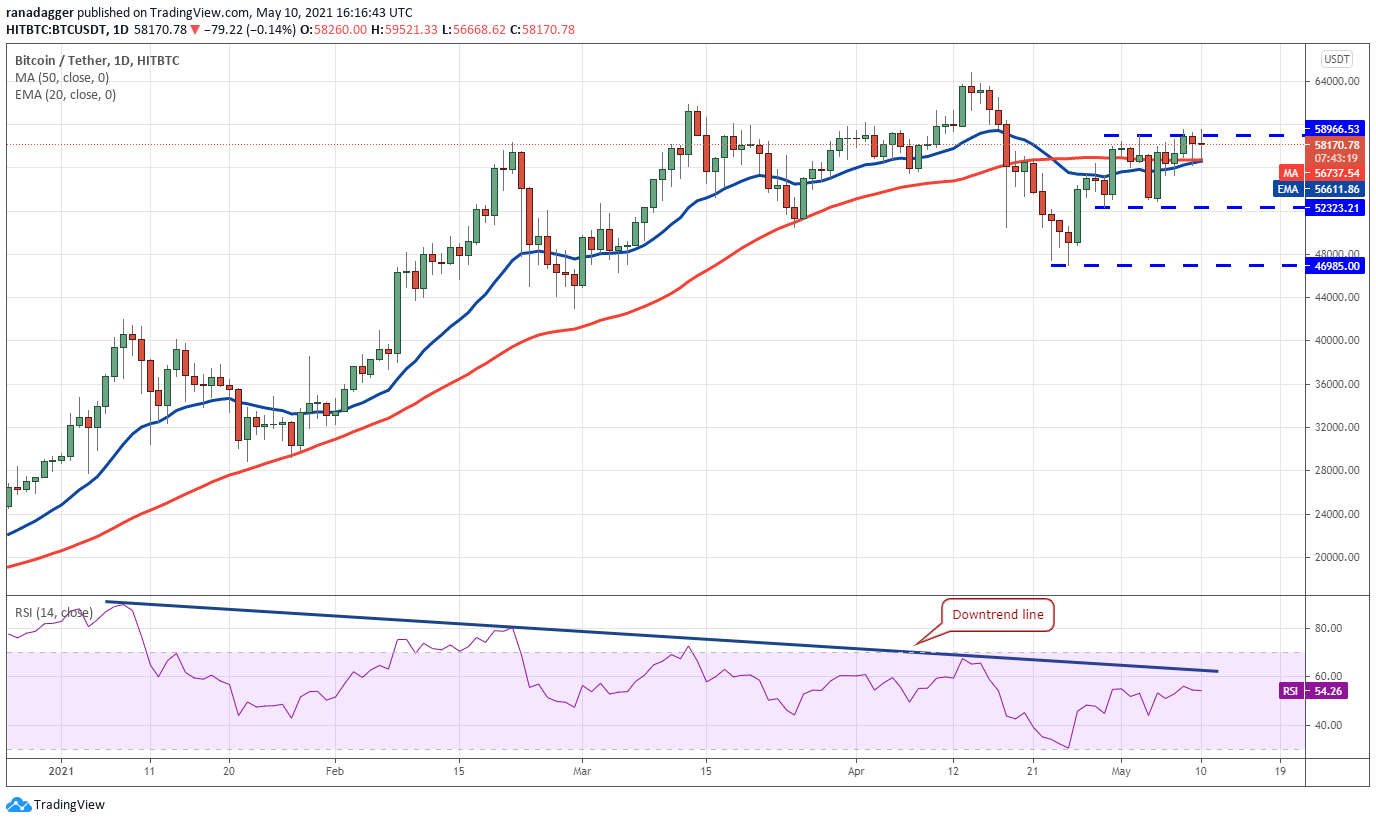
The gradually rising 20-day exponential moving average ($56,611) and the relative strength index (RSI) near the midpoint suggest a balance between supply and demand.
This balance may shift in favor of the bulls if the price sustains above $58,966.53. That could result in a march to the all-time high at 64,849.27. A break above this resistance may signal the resumption of the up-move.
Conversely, a break below $52,323.21 may indicate the start of a deeper correction to $46,985. A break below this support could trigger panic selling.
ETH/USDT
Ether’s rally has continued unabated. After forming a Doji candlestick pattern on May 9, the bulls have asserted their dominance today and pushed the price to a new all-time high. The sharp rally of the past few days has pushed the RSI above 83.
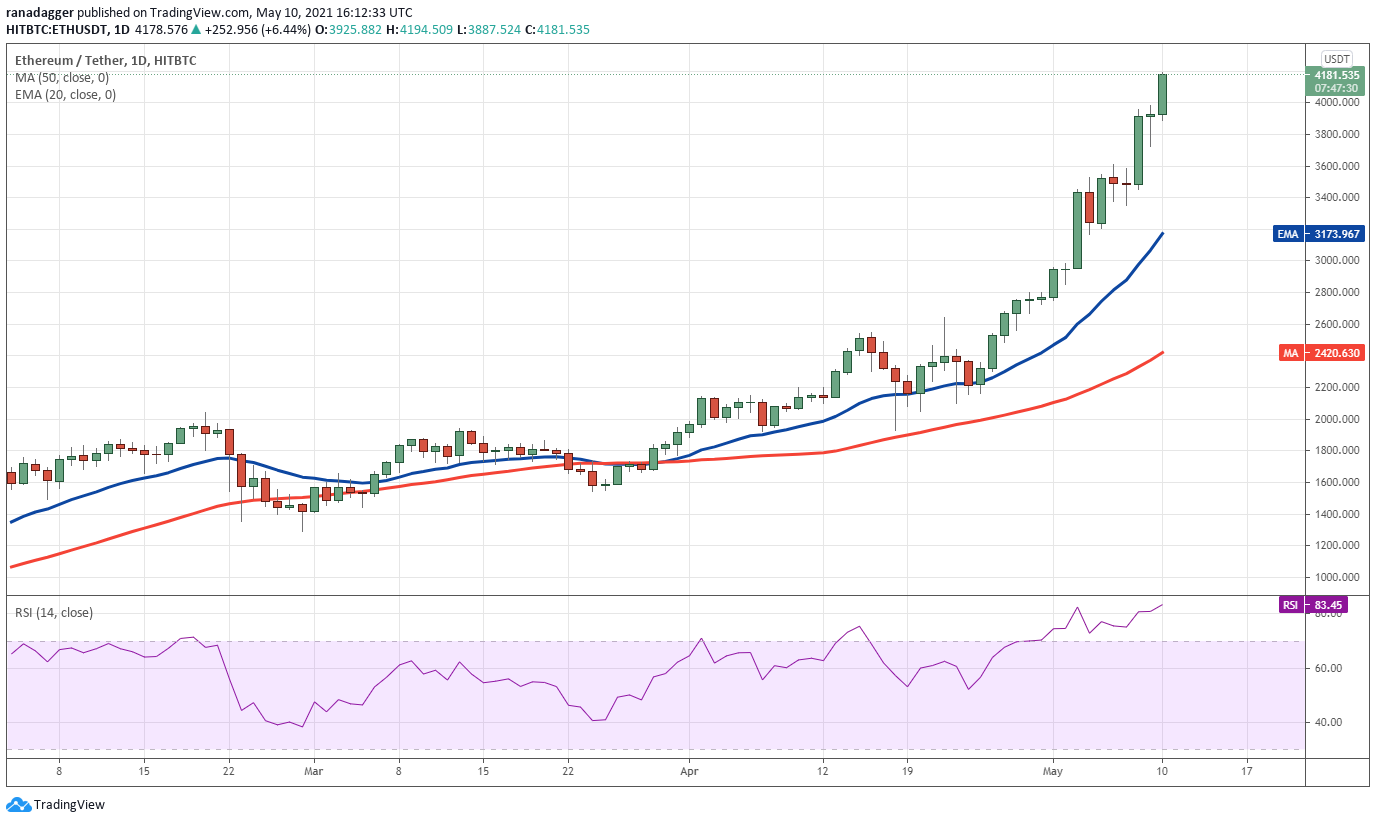
The first sign of the bullish momentum fading could be a correction that lasts for more than three days. A break below the 20-day EMA ($3,173) will signal the start of a deeper correction.
BNB/USDT
Binance Coin (BNB) rose to a new all-time high at $691.77 today but the bulls are struggling to sustain the price above the breakout level at $680. The long wick on the day’s candlestick suggests a lack of demand at higher levels.
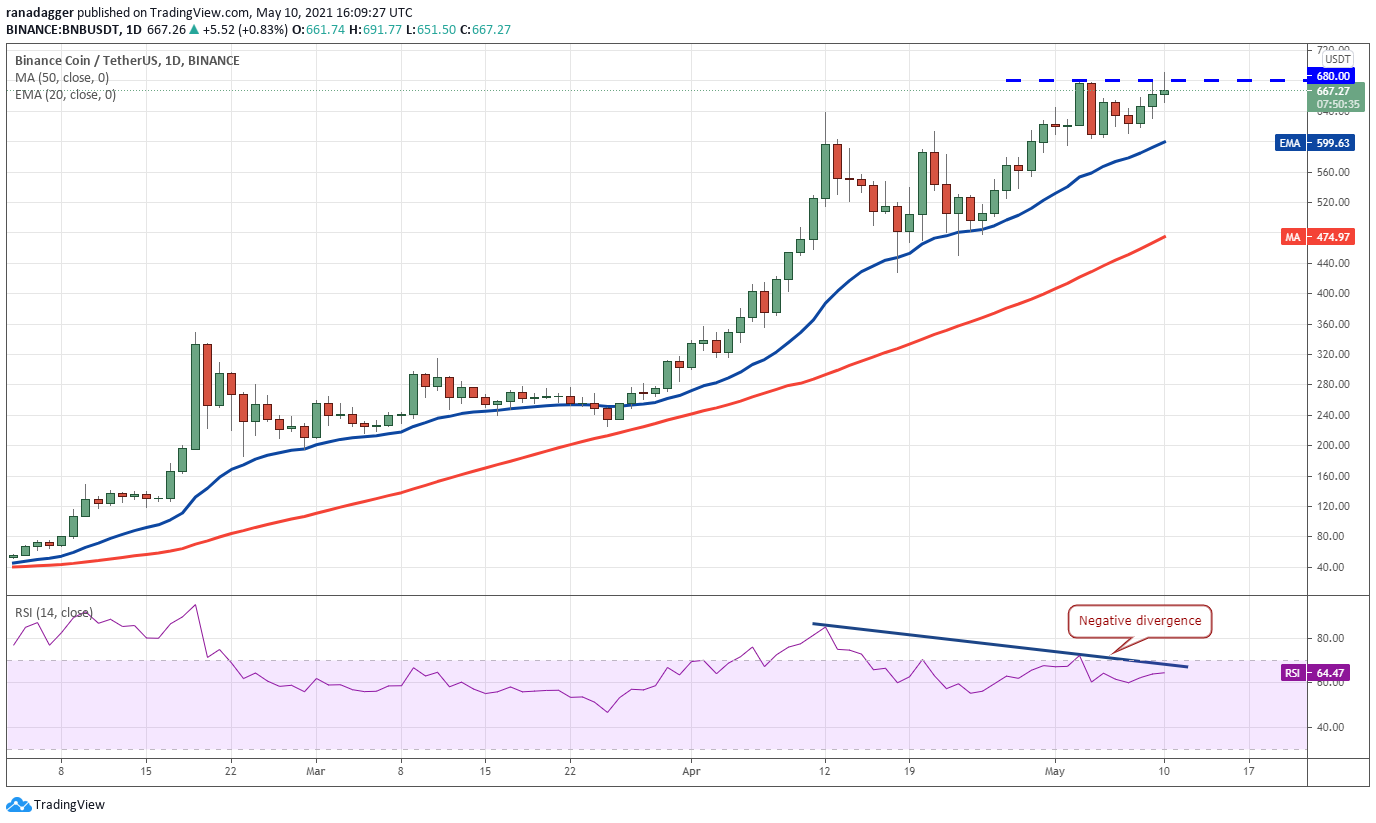
On the other hand, if the price rises from the current level or the 20-day EMA, the bulls will make one more attempt to push and sustain the BNB/USDT pair above $680. If they succeed, the pair could embark on a journey toward $760 and then $808.57.
DOGE/USDT
Dogecoin (DOGE) witnessed a sharp dump on May 9 but the bulls aggressively defended the 20-day EMA ($0.44) as seen from the long tail on the day’s candlestick. However, the buyers could not extend the recovery today and the price has resumed its journey toward the 20-day EMA.
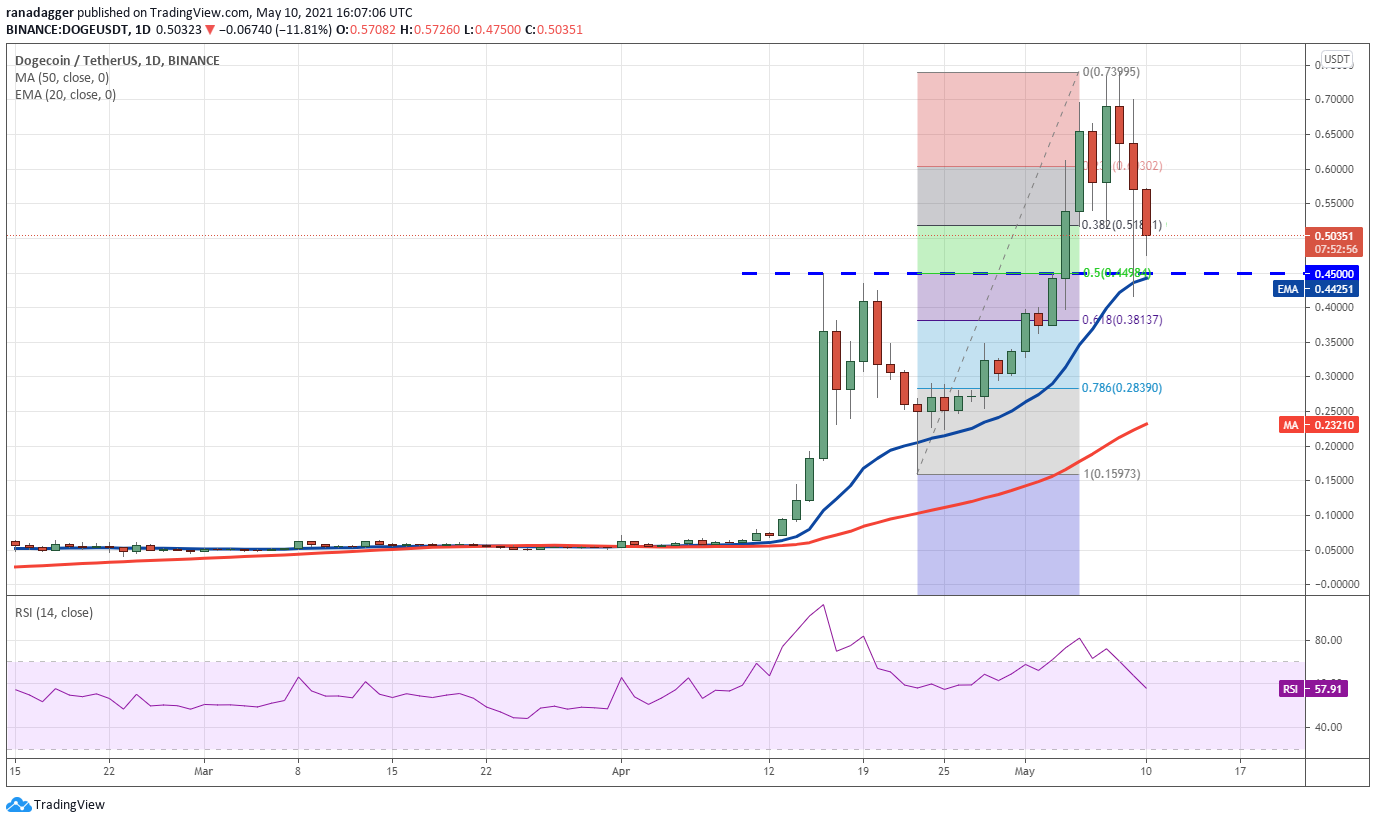
If the DOGE/USDT pair again rebounds off the 20-day EMA, it will suggest strong buying at lower levels. Such a move could keep the pair range-bound for a few more days.
This view will invalidate if the bears sink the price below the 20-day EMA. if that happens, the pair could drop to the 61.8% Fibonacci retracement level at $0.38.
XRP/USDT
XRP has repeatedly broken above the downtrend line since May 6 but the bulls have not been able to sustain the breakout. This suggests that traders may be using the rallies to lighten their long positions.
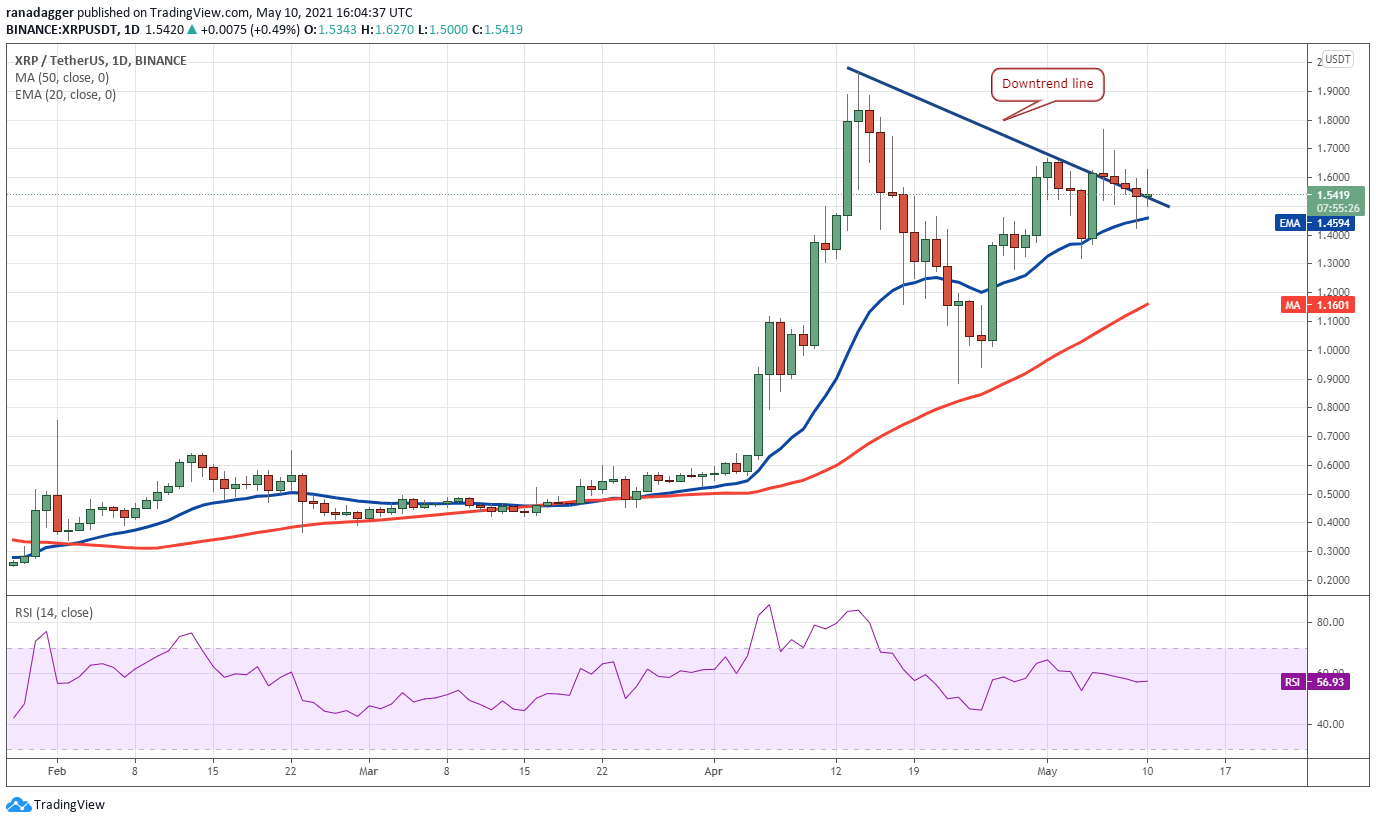
This positive view will nullify if the price turns down and breaks below the 20-day EMA. Such a move will suggest that supply exceeds demand. The XRP/USDT pair could then drop to the 50-day simple moving average ($1.16).
ADA/USDT
Cardano made a large outside day candlestick pattern on May 9, indicating strong buying at the breakout level of $1.48. However, the bulls have not been able to sustain the momentum today and the altcoin has formed an inside-day candlestick pattern.

The rising 20-day EMA ($1.45) and the RSI in the overbought territory also indicate the path of least resistance is to the upside. A break above $1.83 may open the doors for a rally to $2 and then $2.25.
Contrary to this assumption, if the ADA/USDT pair turns down and breaks below the 20-day EMA ($1.45), it will indicate a bull trap. That could pull the price down to $1.28 and then to $1.
DOT/USDT
Polkadot (DOT) is stuck between the moving averages and the $42.28 overhead resistance. This tight range trading near the stiff resistance is a positive sign as it shows that traders are in no hurry to dump their long positions.
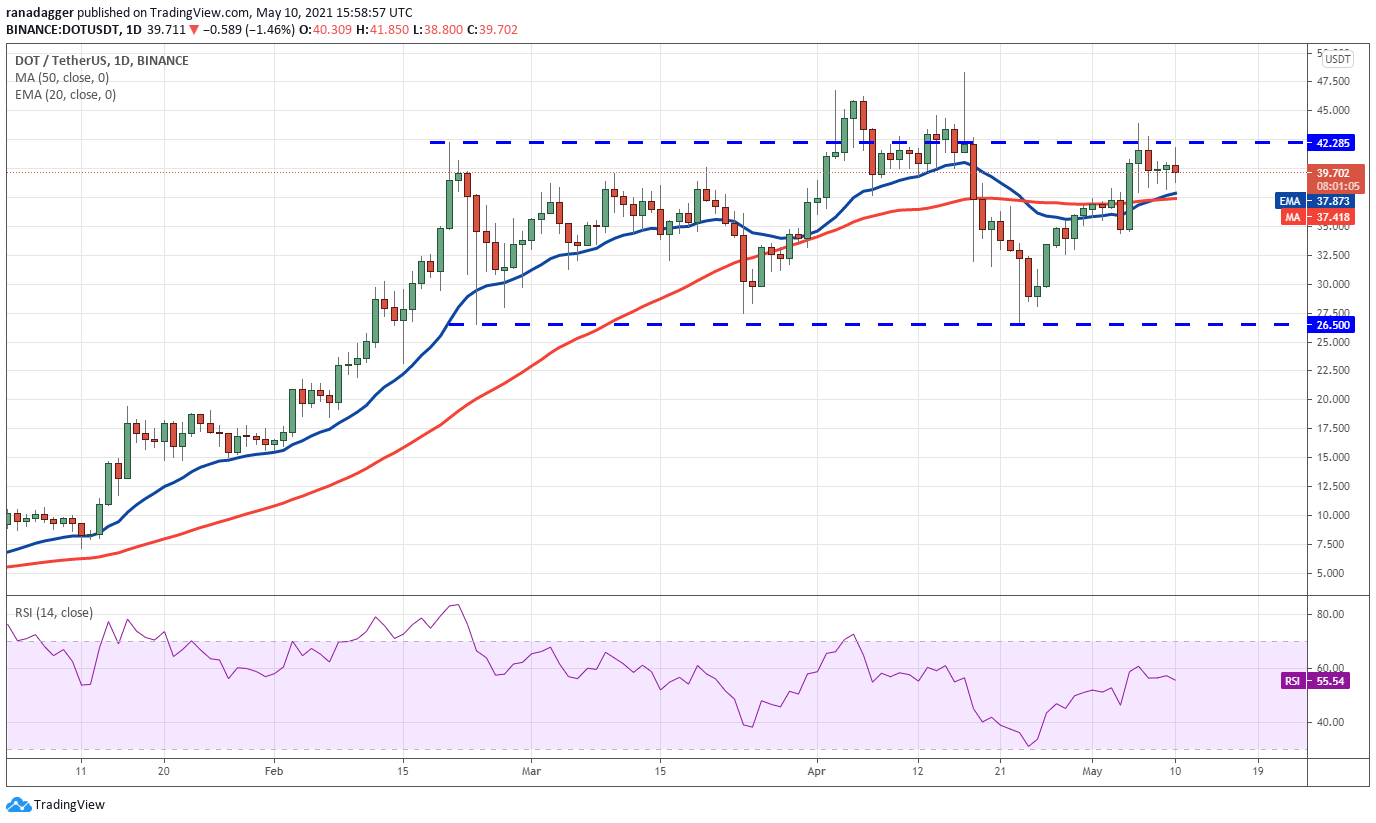
However, if the buyers push the price above $48.36, the DOT/USDT pair could start its journey to $58.06.
Alternatively, if the price breaks below the moving averages, the pair could drop to $34.36 and then to $32.56. If that happens, the pair may extend its stay inside the $26.50 to $42.28 range for a few more days.
BCH/USDT
Bitcoin Cash (BCH) is facing stiff resistance near the 52-week high at $1,600.89 as seen from the long wick on today’s candlestick. If the price slips below $1,400, the altcoin could drop to the 38.2% Fibonacci retracement level at $1,263.10 and remain range-bound for a few days.
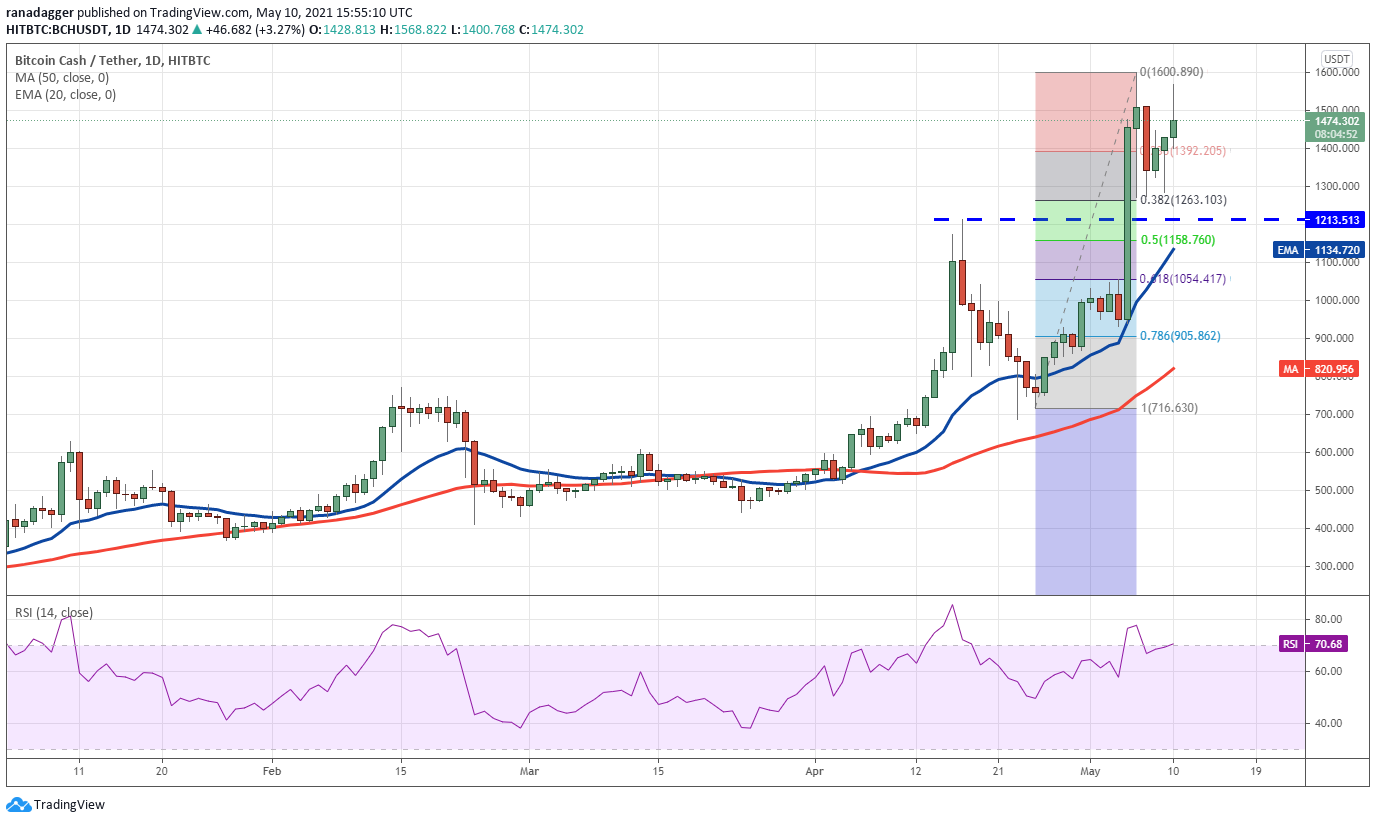
However, the upsloping moving averages and the RSI in the overbought zone suggest the path of least resistance is to the upside.
If the price rises from the current level or from $1,400 and breaks above $1,600.89, the pair could start the next leg of the uptrend, which has a target objective at $2,147.36.
LTC/USDT
Litecoin surged above the resistance line of the ascending broadening wedge pattern on May 9, indicating a pick-up in momentum. The altcoin hit a new all-time high at $412.76 today but the long wick on the candlestick suggests profit-booking at higher levels.
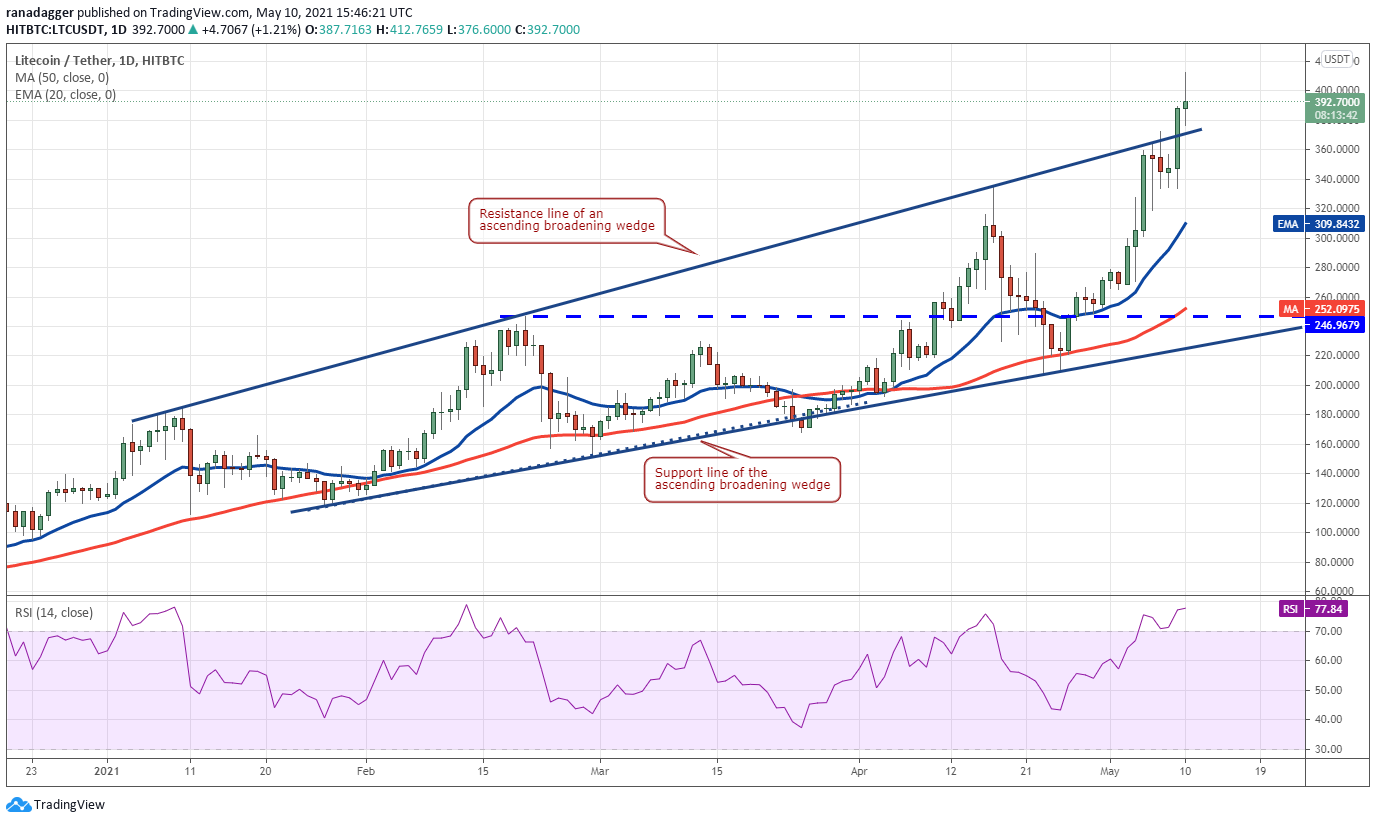
On the contrary, if the price re-enters the wedge, it will suggest that the breakout on May 9 was a bull trap. That could pull the price down to the 20-day EMA ($309). A strong rebound off this level will suggest the sentiment remains positive while a break below the 20-day EMA will clear the path for a drop to the support line of the wedge.
LINK/USDT
The bulls pushed Chainlink (LINK) above the resistance line of the ascending channel on May 5 but could not build up on the breakout. After hesitating for a few days, the bulls made a decisive up-move on May 9 and pushed the altcoin to $52.42.
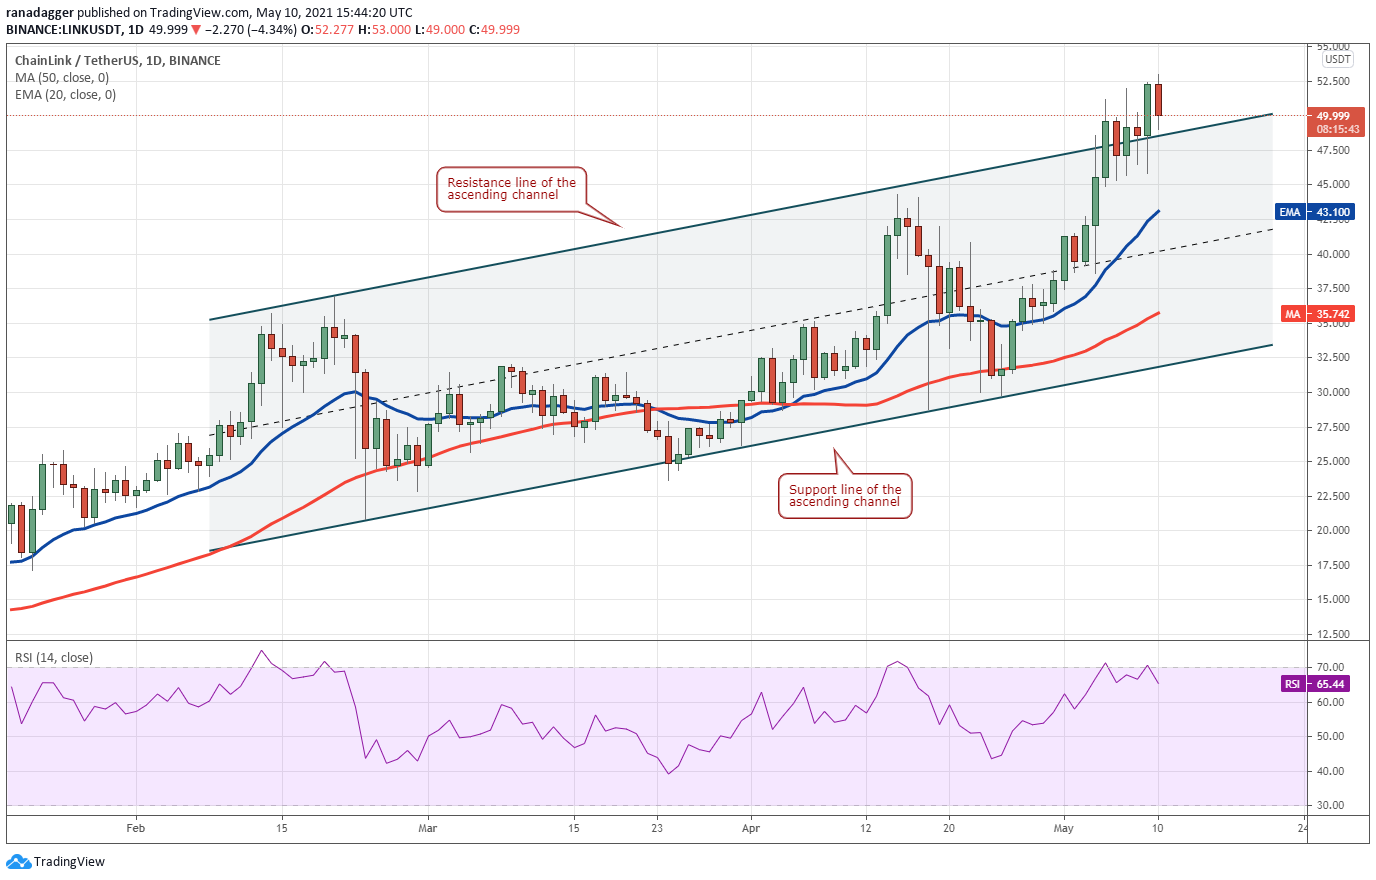
If the price rebounds off the 20-day EMA, the bulls may make one more attempt to resume the uptrend. On the contrary, a break below the 20-day EMA will suggest the current breakout was a bull trap. The pair could then drop to the support line of the channel.
The views and opinions expressed here are solely those of the author and do not necessarily reflect the views of Cointelegraph. Every investment and trading move involves risk. You should conduct your own research when making a decision.
Market data is provided by HitBTC exchange.

Leave A Comment