
In a bearish environment, traders latch on to every bit of negative news and make that a an excuse to sell. Bitcoin (BTC) dropped over $1,000 within a few minutes as news hit the stands that the third-largest Chinese bank, the Agricultural Bank of China, will not allow the use of its services for crypto transactions.
Although the bank later deleted its anti-crypto statement, the damage was already done. Similarly, traders have latched on to the news that the Chinese crackdown on Bitcoin miners and this has resulted in the hash rate dropping to an 8-month low.
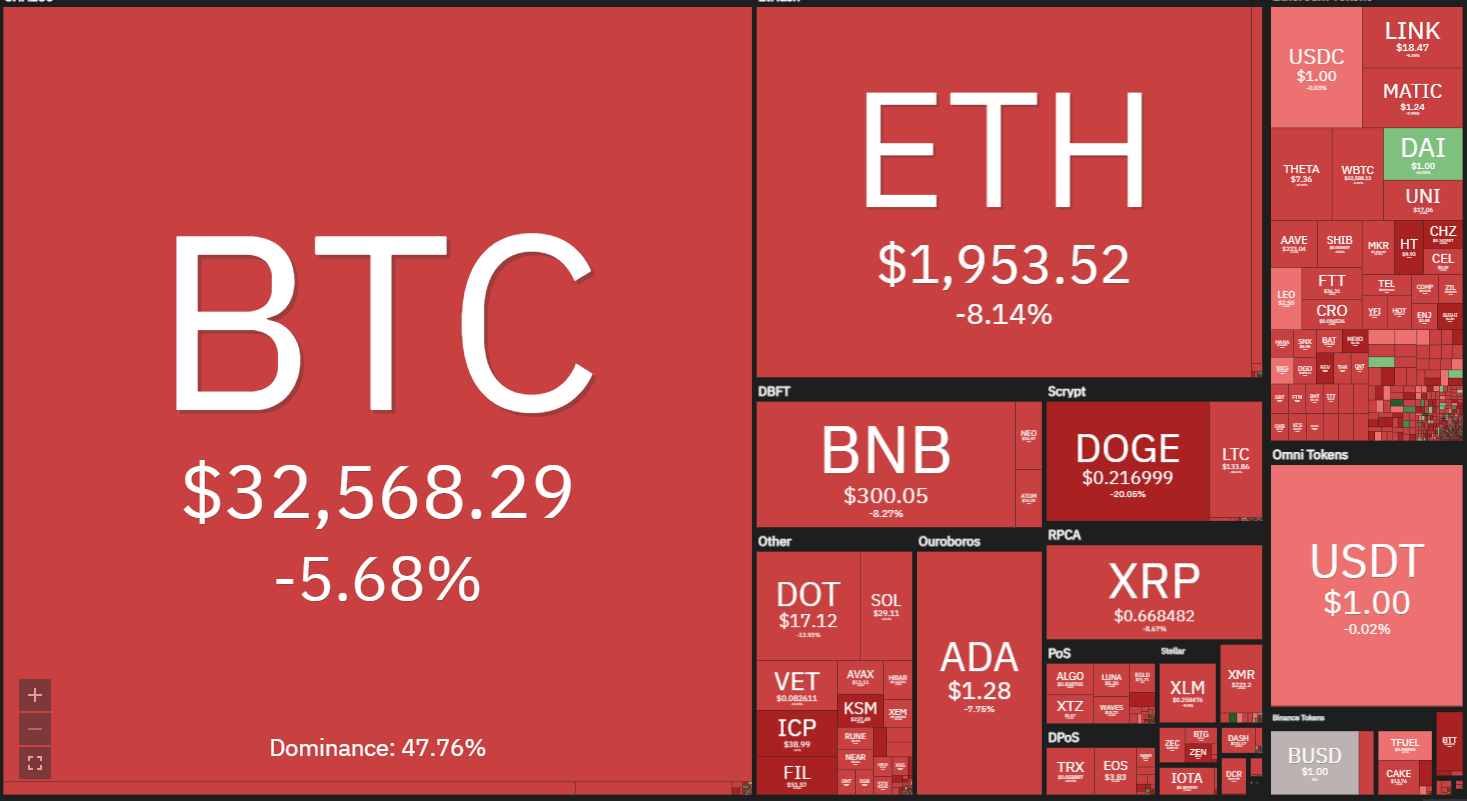
Among all the bearish news and price action, MicroStrategy has disclosed the purchase of 13,005 Bitcoin at an average price of $37,617. This takes the firm’s total holding to 105,085 Bitcoin at an average price of just over $26,000 per Bitcoin.
Will MicroStrategy’s purchase attract other institutional investors and result in a relief rally? Let’s study the charts of the top-10 cryptocurrencies to find out.
BTC/USDT
Bitcoin completed the dreaded death cross on June 19 and this seems to have attracted further selling from the bears. The sellers have pulled the price down to the critical support at $31,000 today.
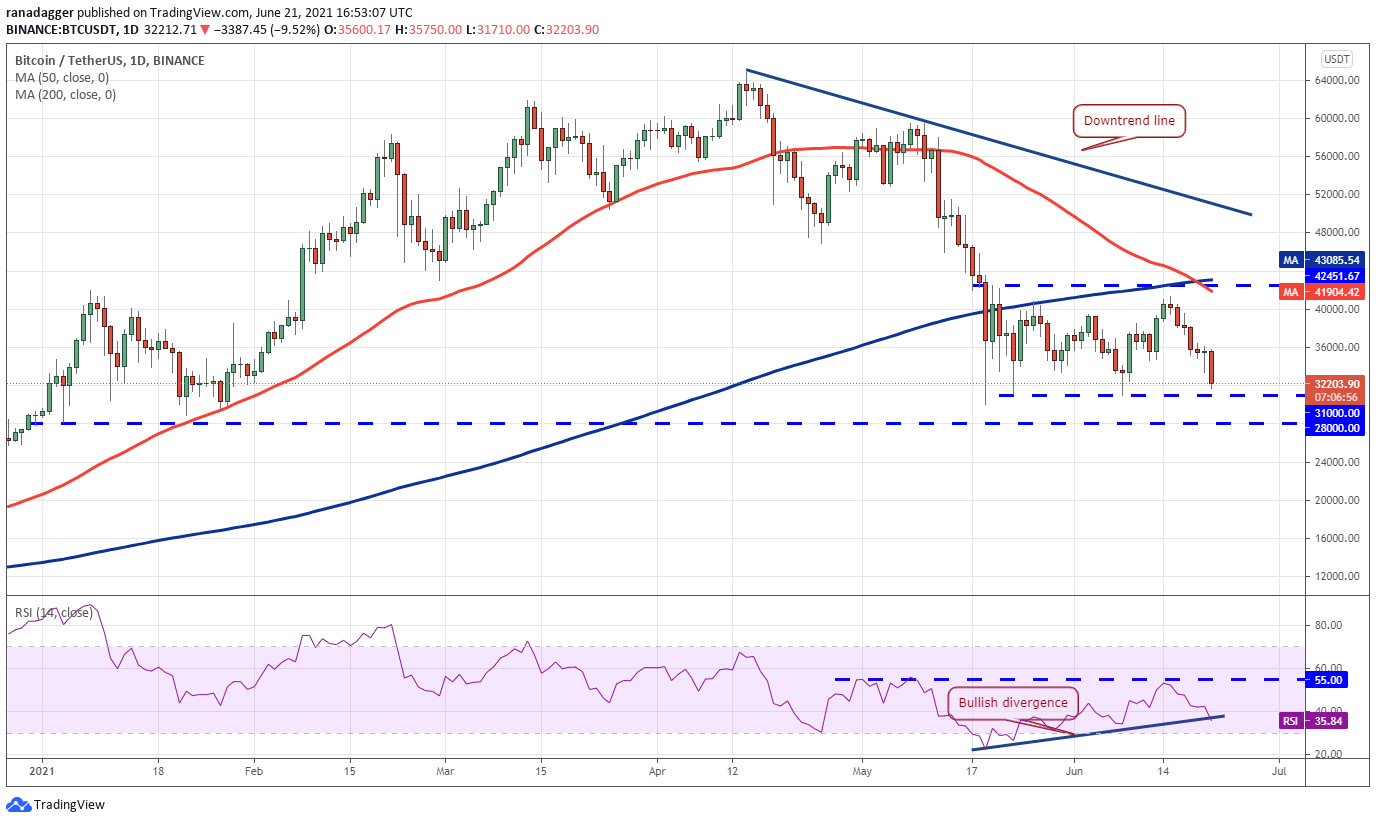
If the price rebounds off $31,000, the BTC/USDT pair will attempt to rise to $42,451.67. This could keep the pair range-bound between these two levels for a few more days.
On the upside, the rally is likely to face resistance at the 50-day simple moving average ($41,904). If the pair turns down from this resistance, the bears will again try to sink the price below $31,000.
If they succeed, the pair could decline to $28,000 and if this support also cracks, the next stop could be $20,000.
ETH/USDT
Ether (ETH) broke below the symmetrical triangle pattern on June 18. This indicated that the consolidation of the past few days has resolved in favor of the bears. Sustained selling has pulled the price down to the 200-day SMA ($1,870).
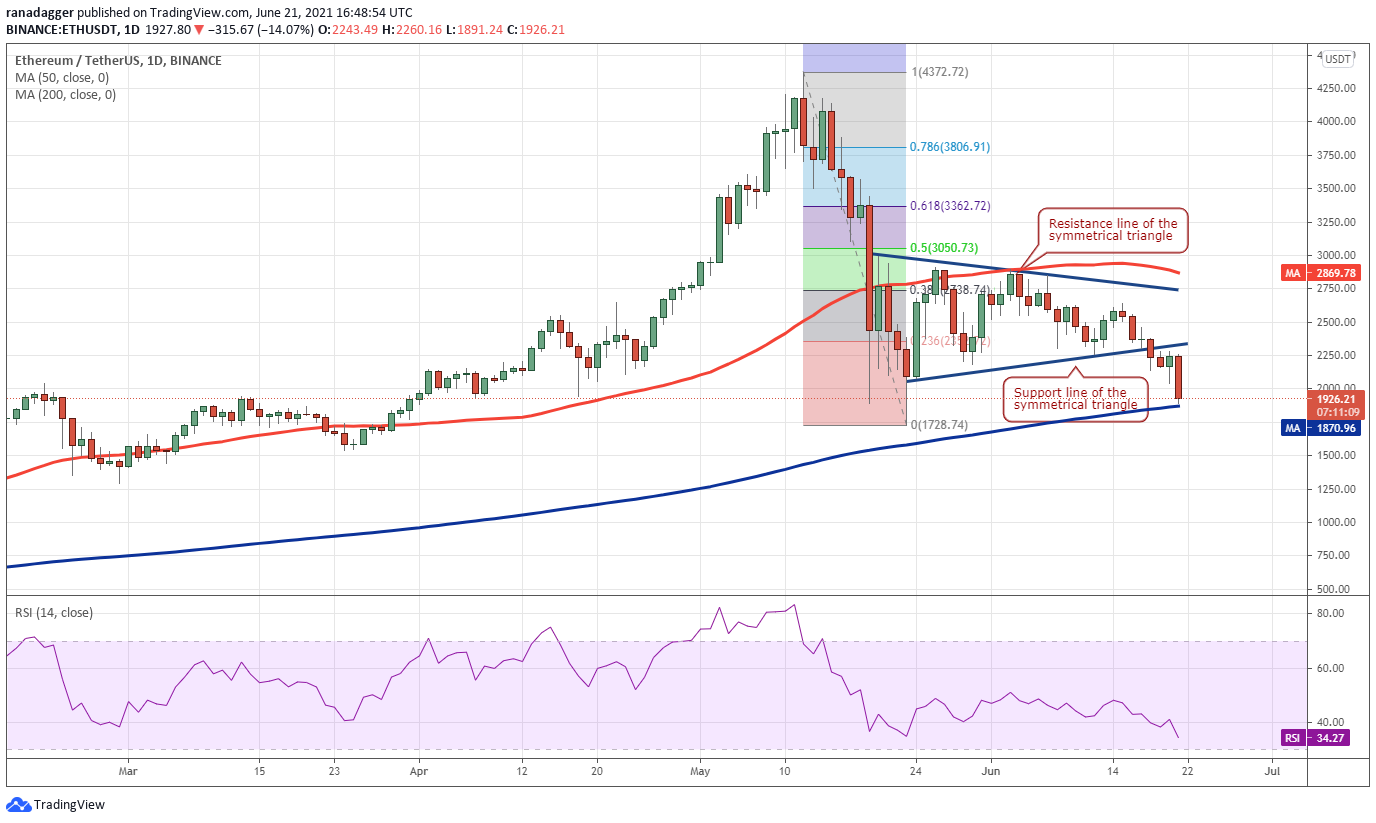
However, the 50-day SMA ($2,869) has started to turn down and the RSI has dipped below 35, suggesting that bears are in command. If bears sink the price below the support zone, the ETH/USDT pair could drop to $1,536.92 and then to $1,293.18.
BNB/USDT
Binance Coin (BNB) broke below the uptrend line on June 18 and the bears are currently attempting to sink the price below the $291.06 support.
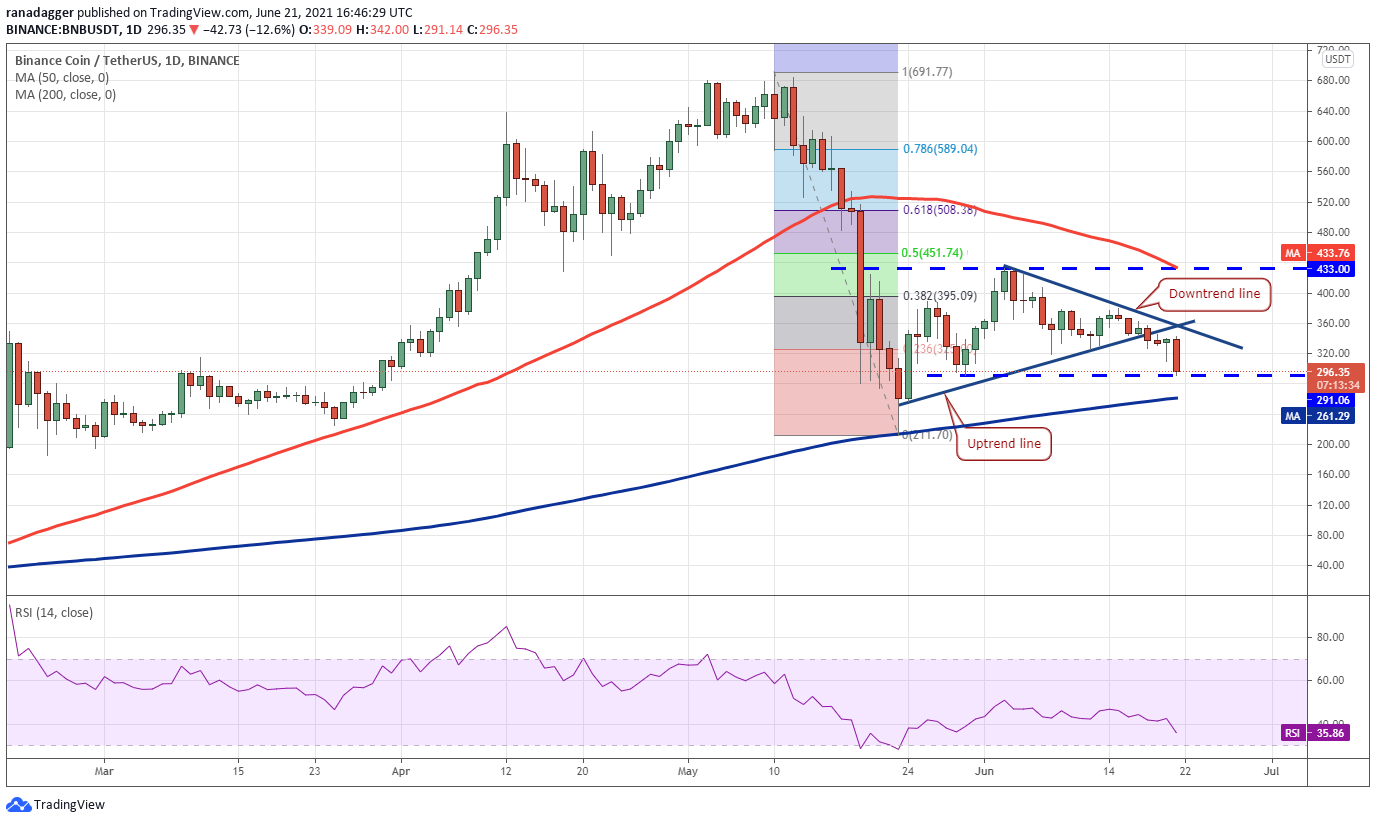
If the price rebounds off the 200-day SMA, the pair could rise to the downtrend line. A break above this resistance could clear the path for an up-move to $379.58 and then $433.
Contrary to this assumption, if the bears sink the price below the 200-day SMA, the pair could drop to $200 and then to $126.75.
Related: Classic bearish chart pattern forms for Bitcoin as BTC price tumbles to $32K
ADA/USDT
Cardano (ADA) has dropped below the critical support at $1.33 today. If bears sustain the price below this level, the altcoin could continue its decline and reach the next major support at $1.
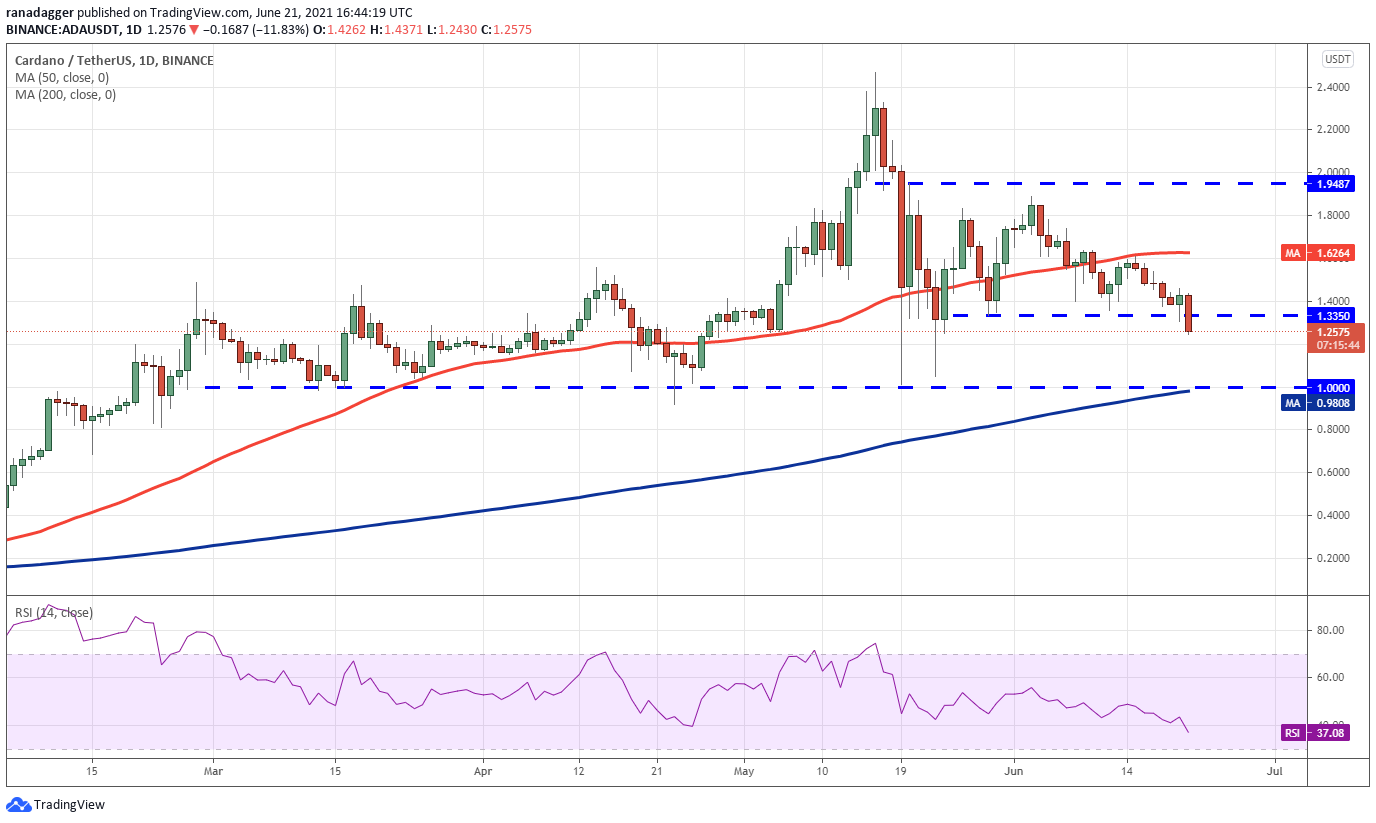
If the price turns down from this level, it will suggest that the sentiment has turned negative and traders are selling on rallies. A break below the 200-day SMA could open the doors for a further fall to $0.80 and then $0.68.
This negative view will invalidate if the price turns up from the current level and rises above the 50-day SMA ($1.62).
XRP/USDT
XRP bounced off the 200-day SMA ($0.72) on June 20 but the bulls could not sustain the price above $0.75. Renewed selling has pulled the price back below the 200-day SMA today.
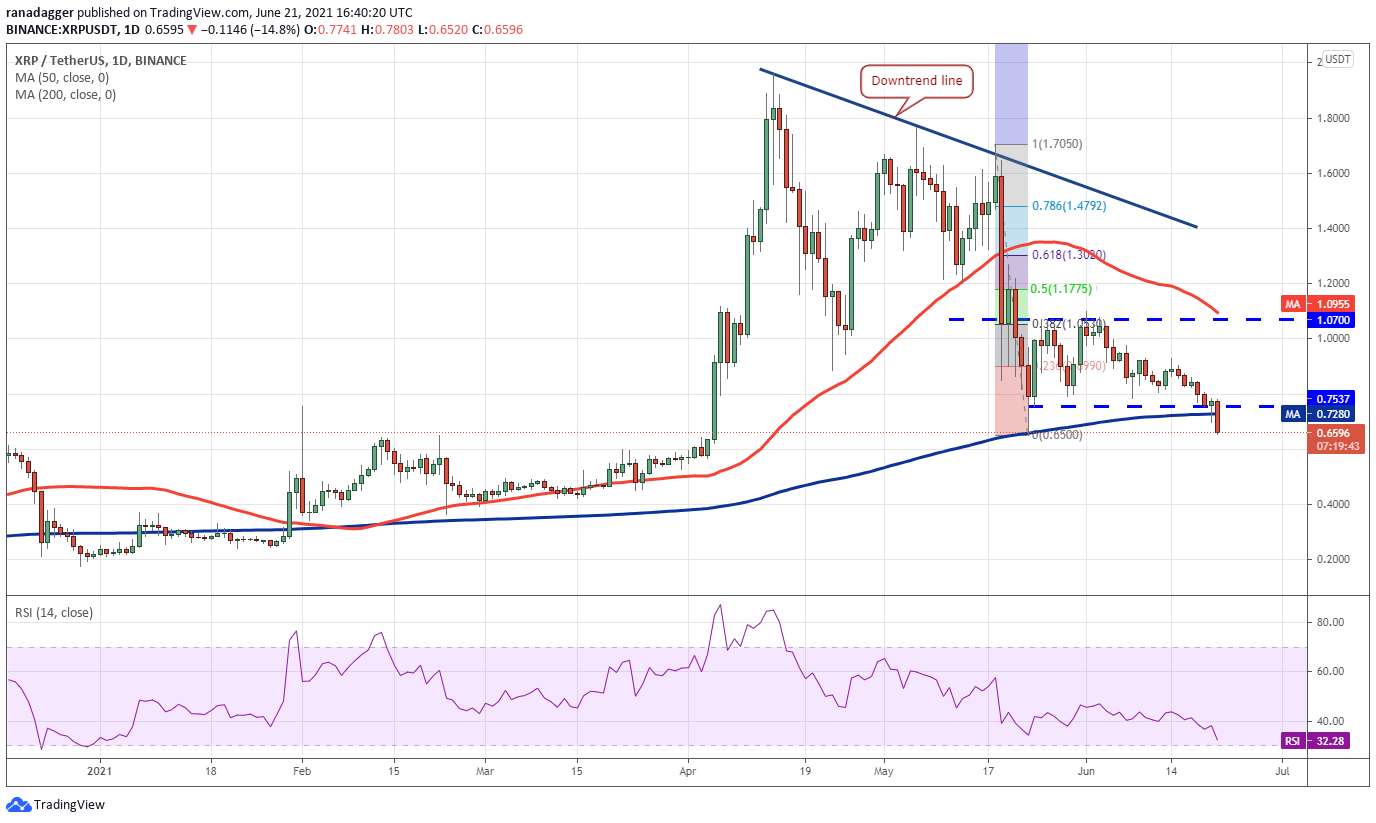
Conversely, if the price rebounds off $0.65, the buyers will make one more attempt to push and sustain the price above $0.75. If they manage to do that, it will suggest accumulation at lower levels. The pair may then rise to $0.93 and then to $1.07.
DOGE/USDT
Dogecoin (DOGE) broke below the neckline of a large head and shoulders pattern on June 18 and has continued lower. The bulls will now try to defend the $0.21 support aggressively.
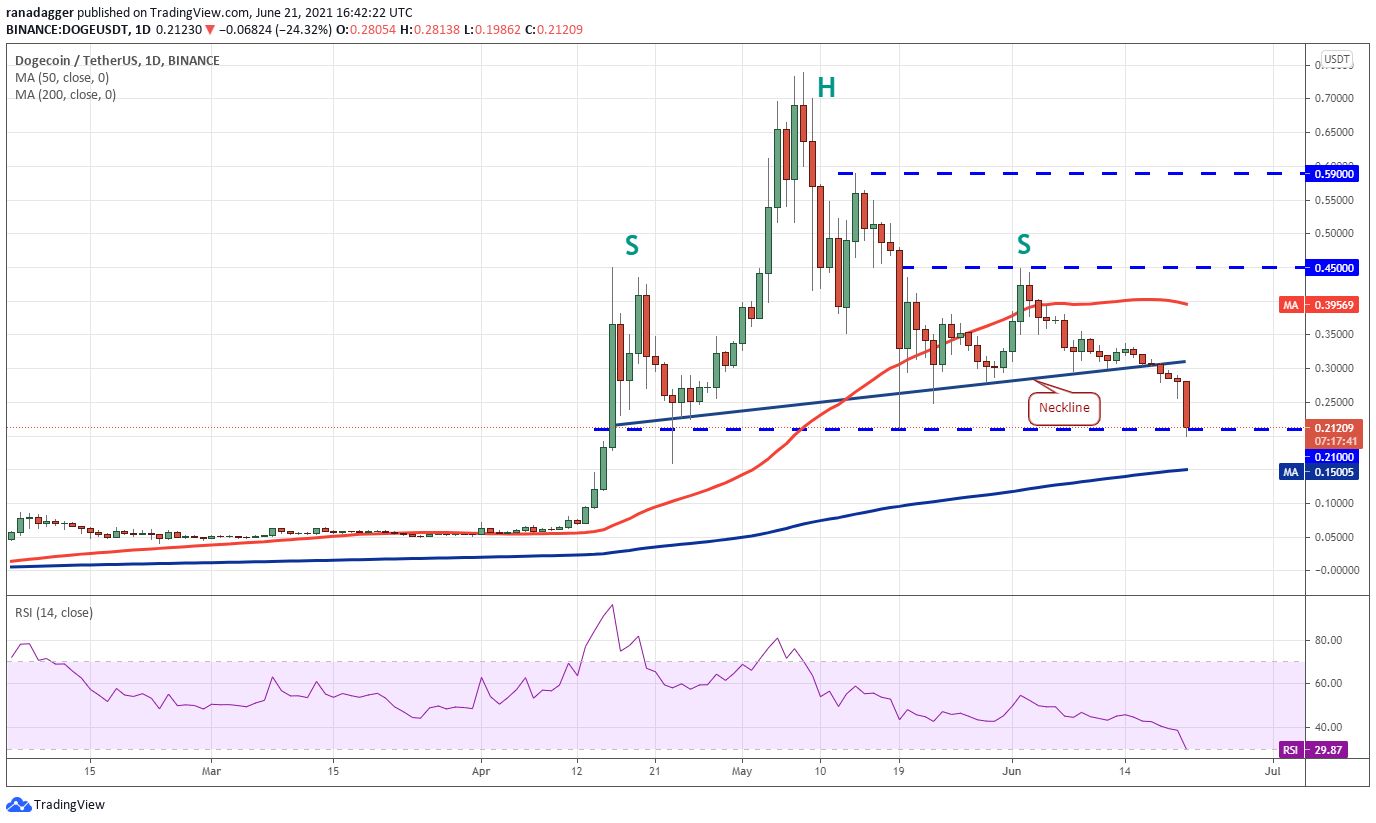
Conversely, if bears sink the price below $0.21, the pair could drop to the 200-day SMA ($0.15). The bulls may again try to stall the decline at this level but if they fail, the pair may drop to the next major support at $0.10.
DOT/USDT
Polkadot (DOT) slipped below the support line of the triangle on June 20 but the bulls pushed the price back into the triangle. However, the sellers are in no mood to relent and they have again pulled the price below the support line today.
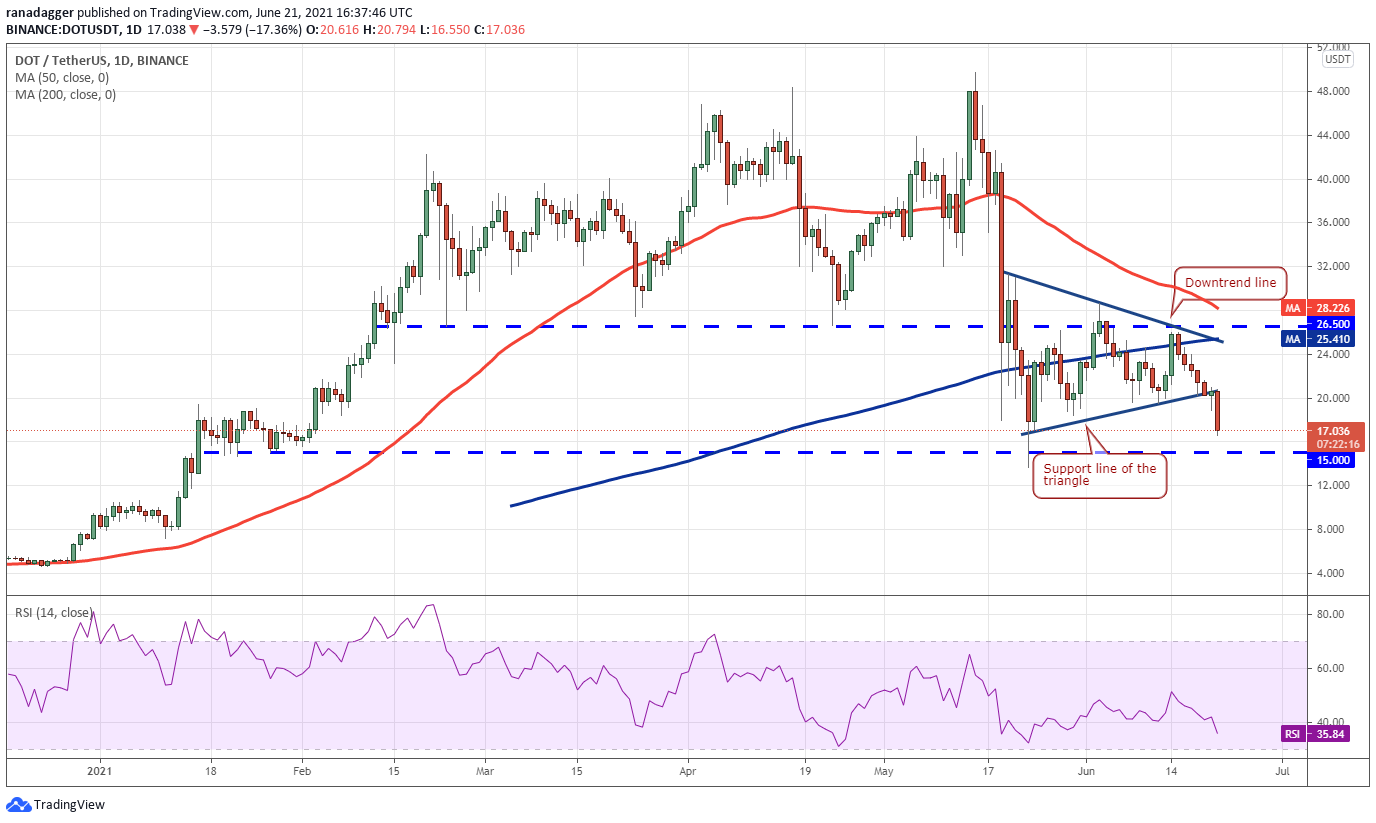
Therefore, the bulls will attempt to defend the $15 support aggressively. A strong rebound off this level could push the price to $20 and then to the downtrend line. A breakout and close above this resistance will be the first sign of strength.
Contrary to this assumption, if bears sink the price below $15, the pair could witness further selling and decline to the next major support at $7.50.
UNI/USDT
Uniswap (UNI) broke below the 200-day SMA ($22.20) on June 18. The failure of the bulls to defend this critical support indicated that supply exceeds demand. The buyers tried to stage a recovery on June 20 but failed to push the price above the 200-day SMA.
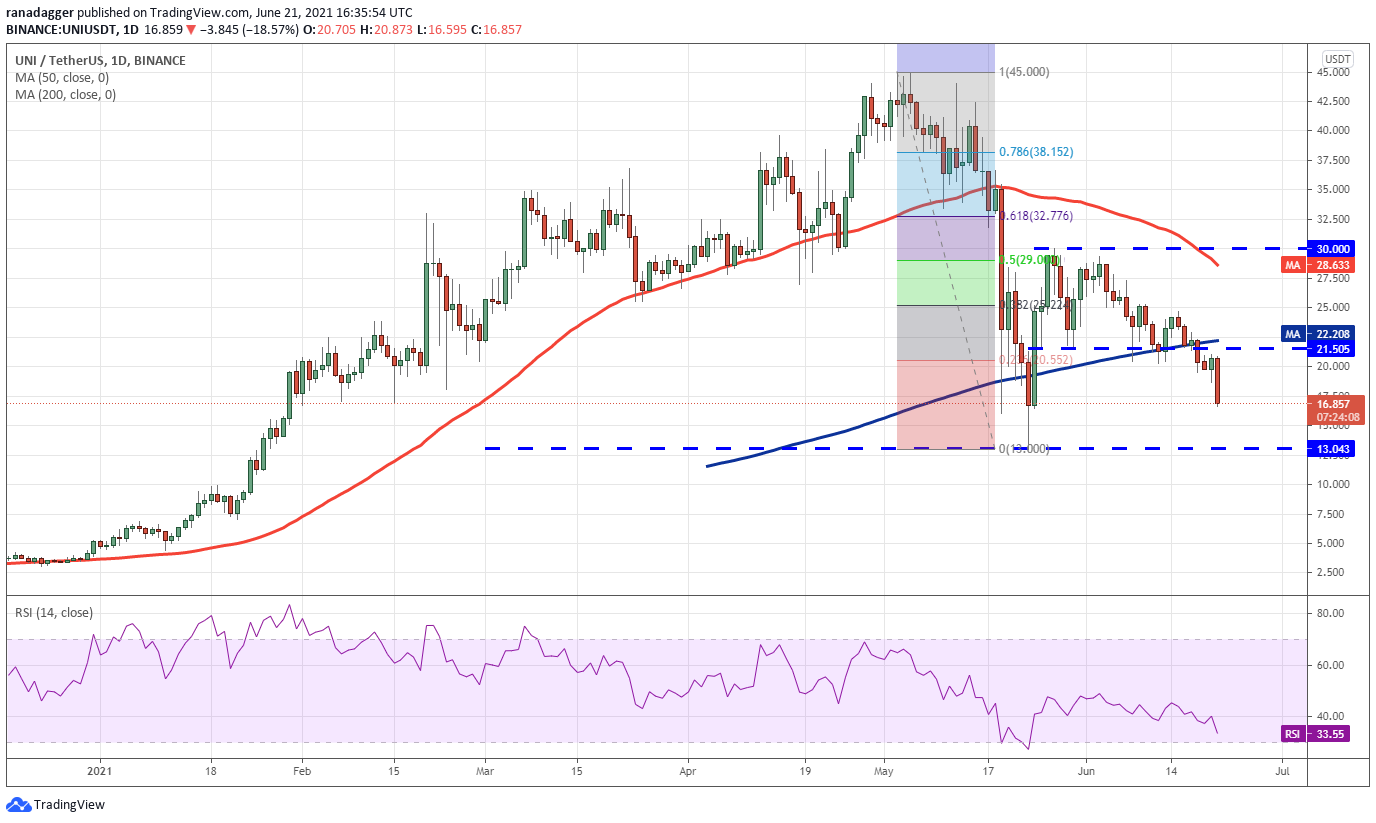
The bulls are likely to defend the $13.04 support aggressively. If the price rebounds off this level, the pair could consolidate between $13.04 and $21.50 for a few days. On the contrary, a break below $13.04 could pull the price down to $10.
BCH/USDT
Bitcoin Cash (BCH) has plunged below the $538.11 support, completing the descending triangle pattern. There is a minor support at $468.13 but if this support cracks, the selling could intensify further.
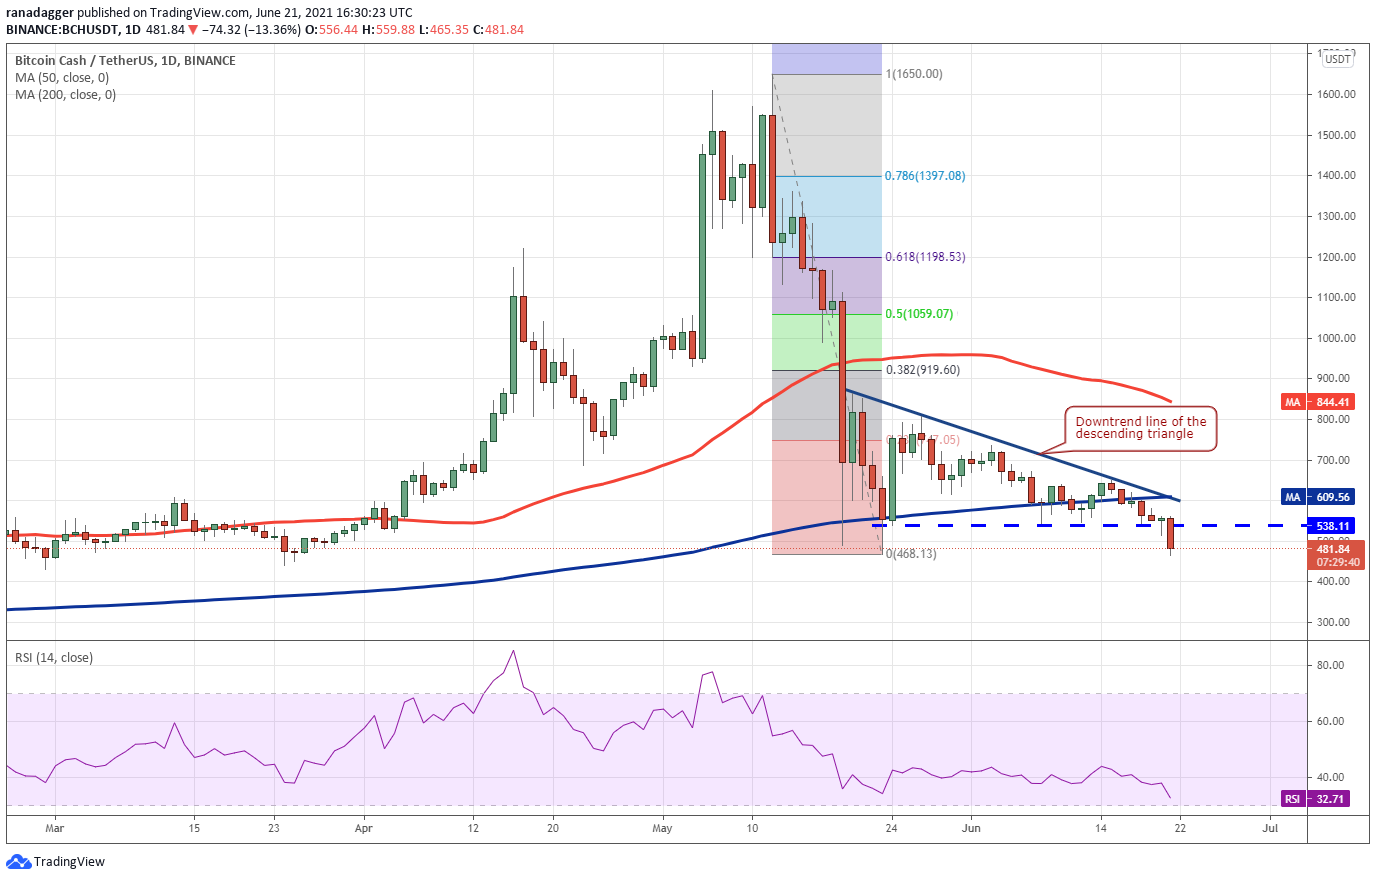
This bearish view will invalidate if the price turns up and quickly rises above the 200-day SMA ($609). Such a move will suggest that the bulls aggressively bought at lower levels. The pair may then rise to the 50-day SMA.
LTC/USDT
Litecoin (LTC) broke below the support line on June 18, indicating a lack of urgency among the bulls to buy at that level. The failure to push the price back above the support line in the past two days has attracted further selling today.
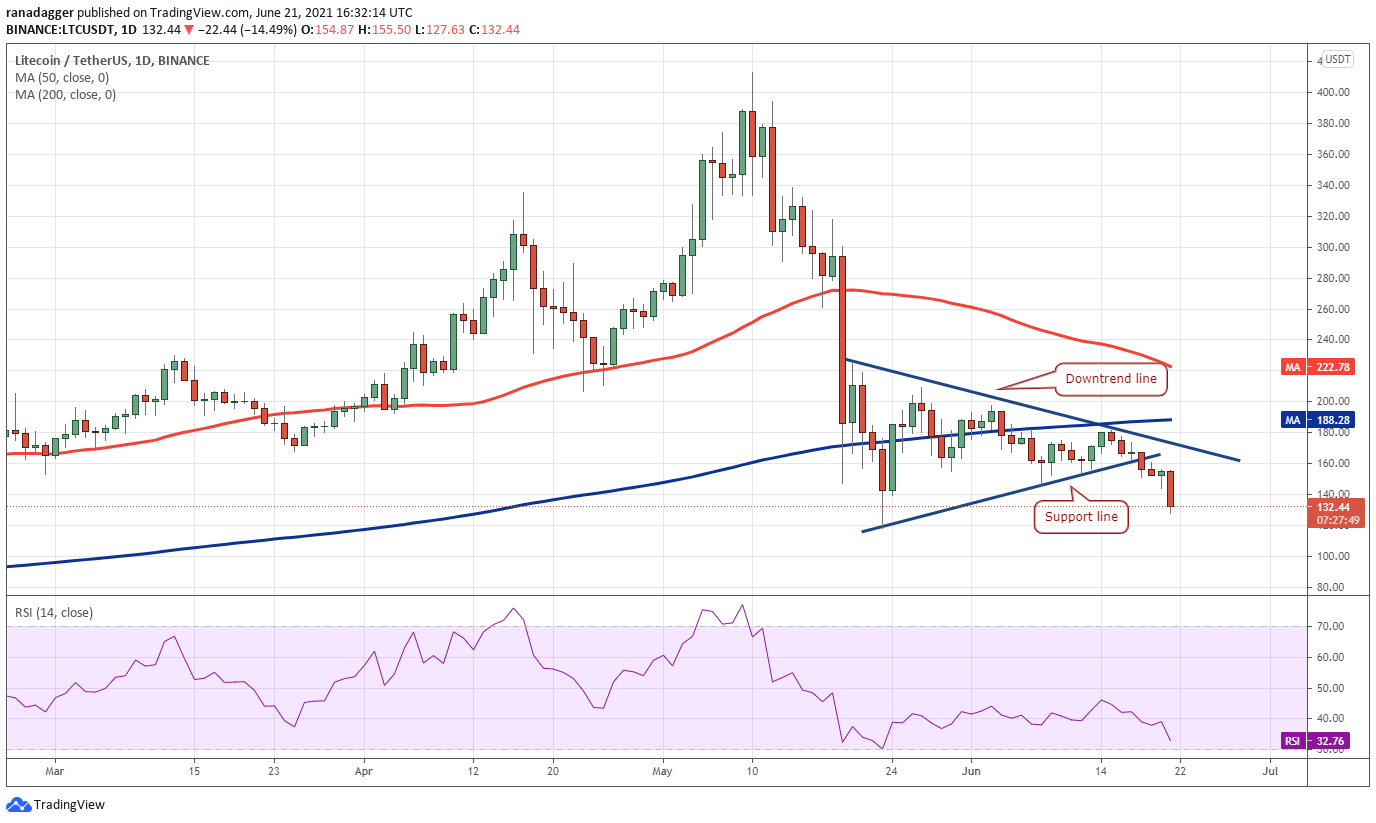
On the contrary, if the price rebounds off $118.03, the bulls will try to push the price to the downtrend line. A breakout and close above this level will be the first indication of strength. A trend change may be signaled after the bulls propel and sustain the price above the 50-day SMA.
The views and opinions expressed here are solely those of the author and do not necessarily reflect the views of Cointelegraph. Every investment and trading move involves risk. You should conduct your own research when making a decision.
Market data is provided by HitBTC exchange.

Leave A Comment