Bitcoin (BTC) price remains jittery and throughout this week, every relief rally is being sold into. This is a classic bear market reaction and may not end in a hurry. However, the current price action should not worry investors because the longer the time spent in a bottoming formation, the stronger the base for the next leg of the up-move.
In a recent note to investors, JPMorgan said that Bitcoin’s fair value may remain between $23,000 and $35,000 over the medium term. The bank pointed out that outflows from crypto Bitcoin funds since the fall on May 19, show a lack of demand from institutional investors. Another reason that may be capping Bitcoin’s price is the massive unlocking of Bitcoin from the Grayscale Bitcoin Trust fund at the end of the six-month lock-up period.
Although not a game-changer, the Purpose Bitcoin exchange-traded fund has seen an average inflow of 86.15 Bitcoin between May 15 and June 24, according to Glassnode data. This has boosted the ETF’s assets under management to 21,114 BTC. This shows that smart investors are gradually chipping away instead of trying to time the bottom.
Let’s study the charts of the top-10 cryptocurrencies to determine the critical support levels that could be touched if the downtrend continues.
BTC/USDT
Bitcoin’s rebound off the $31,000 to $28,000 support zone has turned down from the 20-day exponential moving average ($35,788) today. The downsloping moving averages and the relative strength index (RSI) in the negative territory indicate an advantage to the bears.
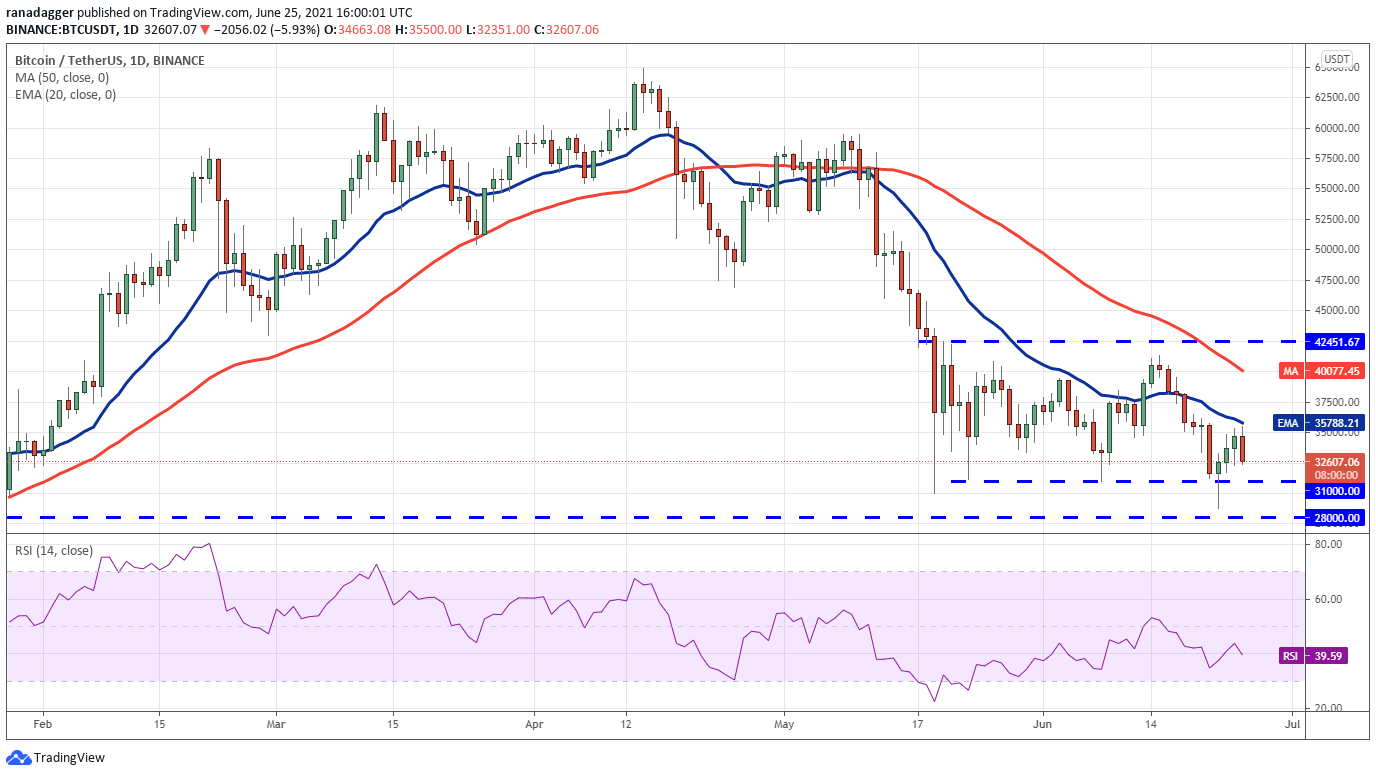
However, the bulls will not give up easily. They are likely to defend the support zone aggressively. If the price rebounds off this zone once again, the bulls will try to push the price above the 20-day EMA.
If they manage to do that, the BTC/USDT pair could continue its consolidation between $28,000 and $42,451.67 for the next few days. A breakout and close above this range will be the first sign that the downtrend may have ended.
ETH/USDT
Ether’s (ETH) rebound off the $1,728.74 support fizzled out at $2,045 on June 23. This suggests a lack of buyers at higher levels. Both moving averages have turned down and the RSI is near the oversold zone, indicating that the path of least resistance is to the downside.
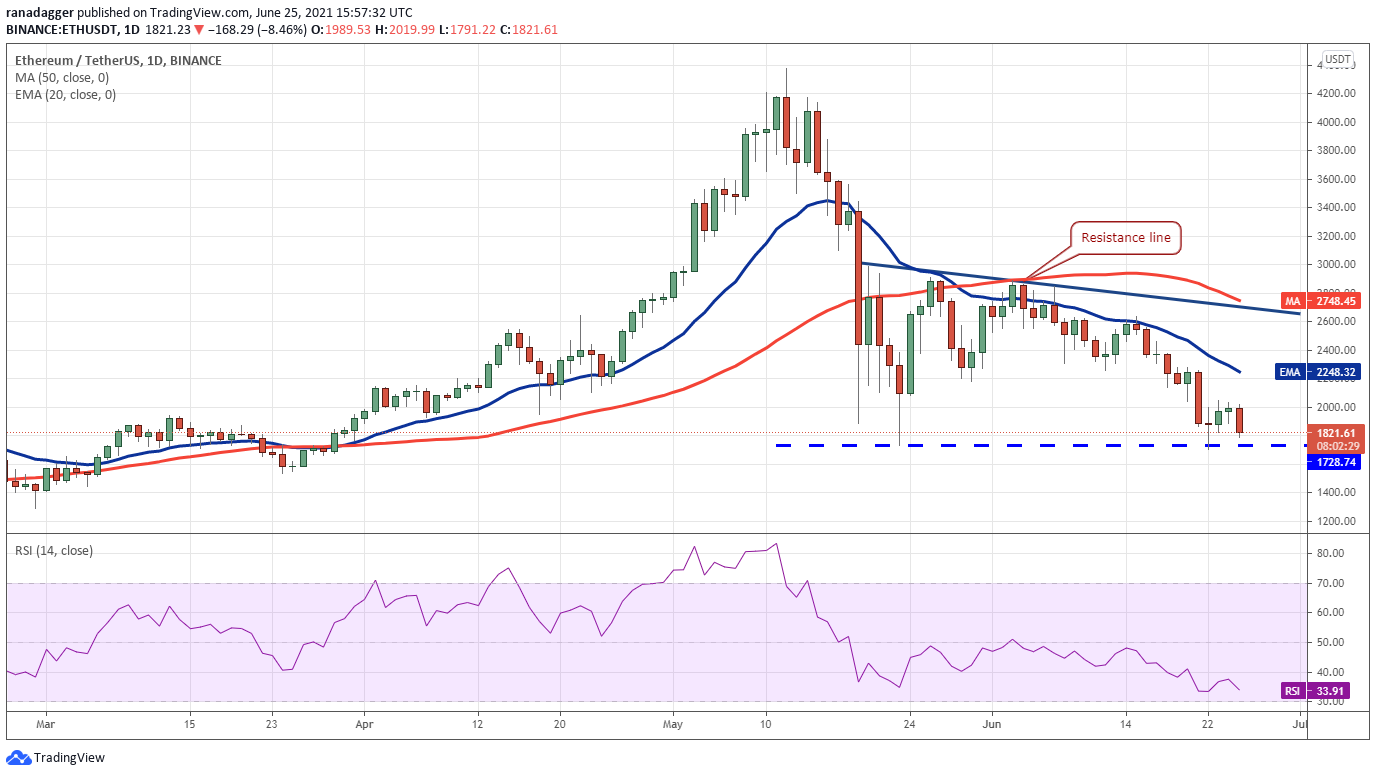
Contrary to this assumption, if the price again rebounds off $1,728.74, it will suggest that the bulls are defending this level aggressively. A breakout and close above the 20-day EMA ($2,248) will be the first indication that a bottoming formation may have started.
BNB/USDT
Binance Coin’s (BNB) bounce off the $211.70 support is facing stiff resistance at the 20-day EMA ($332). This suggests that the sentiment remains negative and traders are selling on rallies.
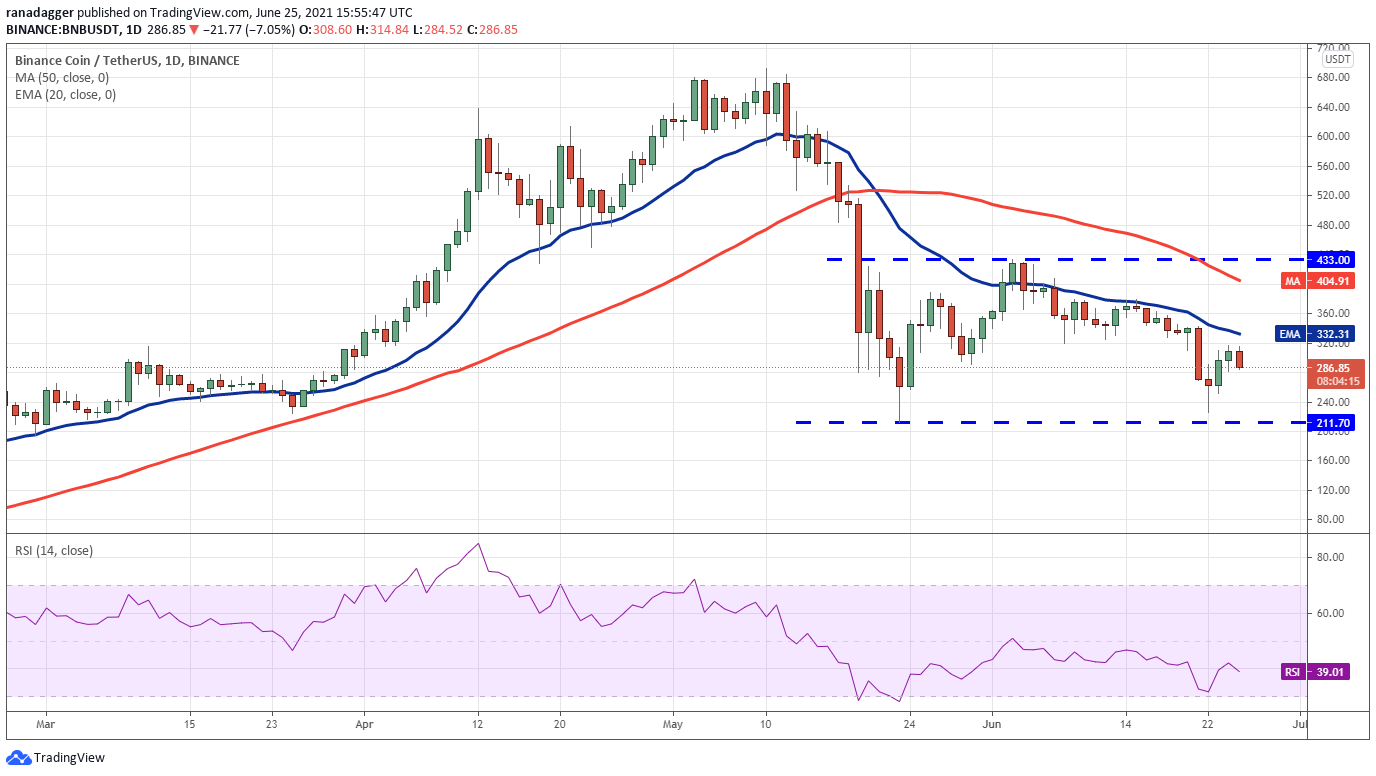
Alternatively, if the price rebounds off the $211.70 support, it will suggest strong accumulation by the bulls at this level. If the buyers propel the price above the 20-day EMA, the pair could rise to $433. A breakout and close above this resistance will be the first sign that the downtrend may be over.
ADA/USDT
Cardano (ADA) rebounded off the $1 support on June 22 but the bulls seem to have hit a wall at the 20-day EMA ($1.42). This suggests that the bears have not thrown in the towel yet and are trying to maintain the upper hand.
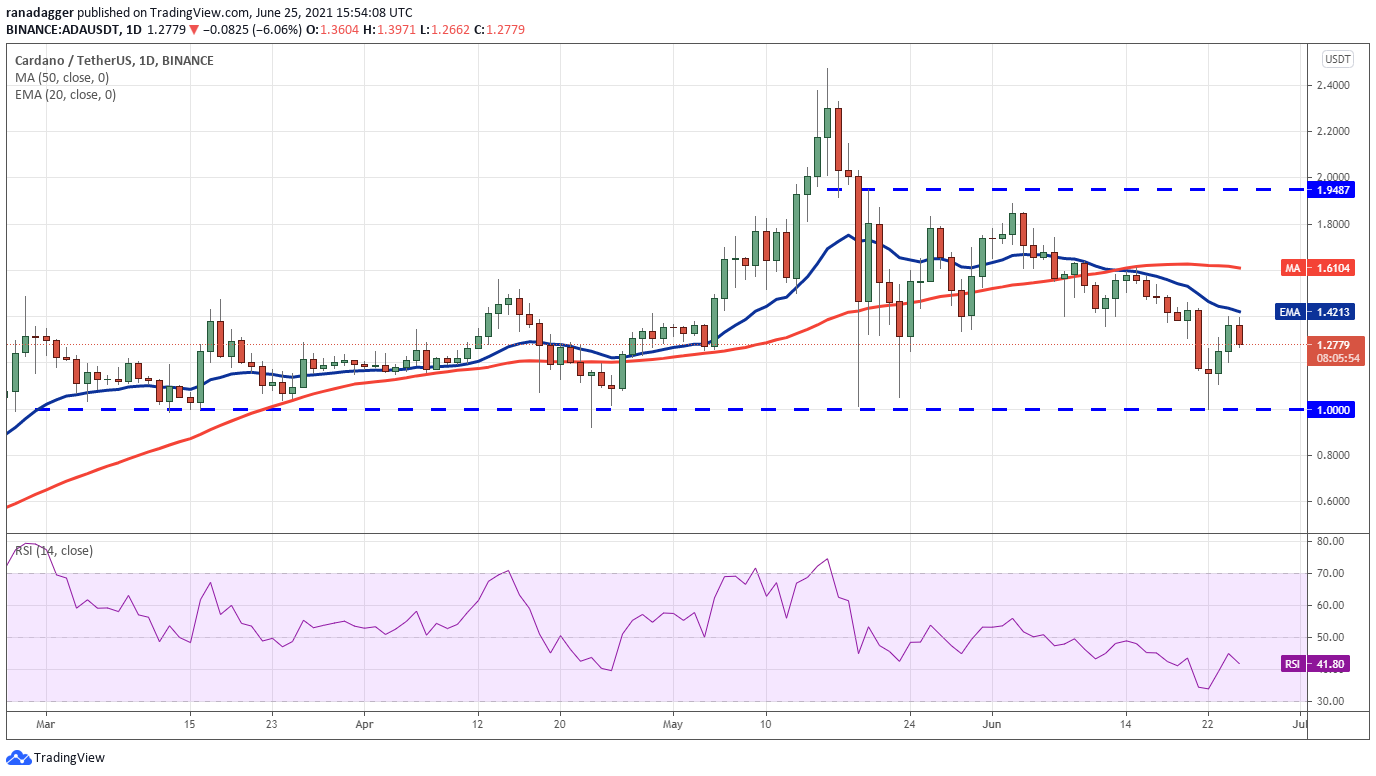
The ADA/USDT pair could then drop to $0.68 and if the selling intensifies, the decline could even extend to $0.40.
However, the bulls will have other plans. They will again try to defend the $1 support. If they succeed, the pair may break out of the 20-day EMA and rise to the 50-day simple moving average ($1.61).
DOGE/USDT
Dogecoin (DOGE) rebounded off the $0.15 support on June 22 and reached the 20-day EMA ($0.28) today. After the sharp relief rally of the past three days, the bears are likely to defend the zone between the 20-day EMA and the neckline aggressively.
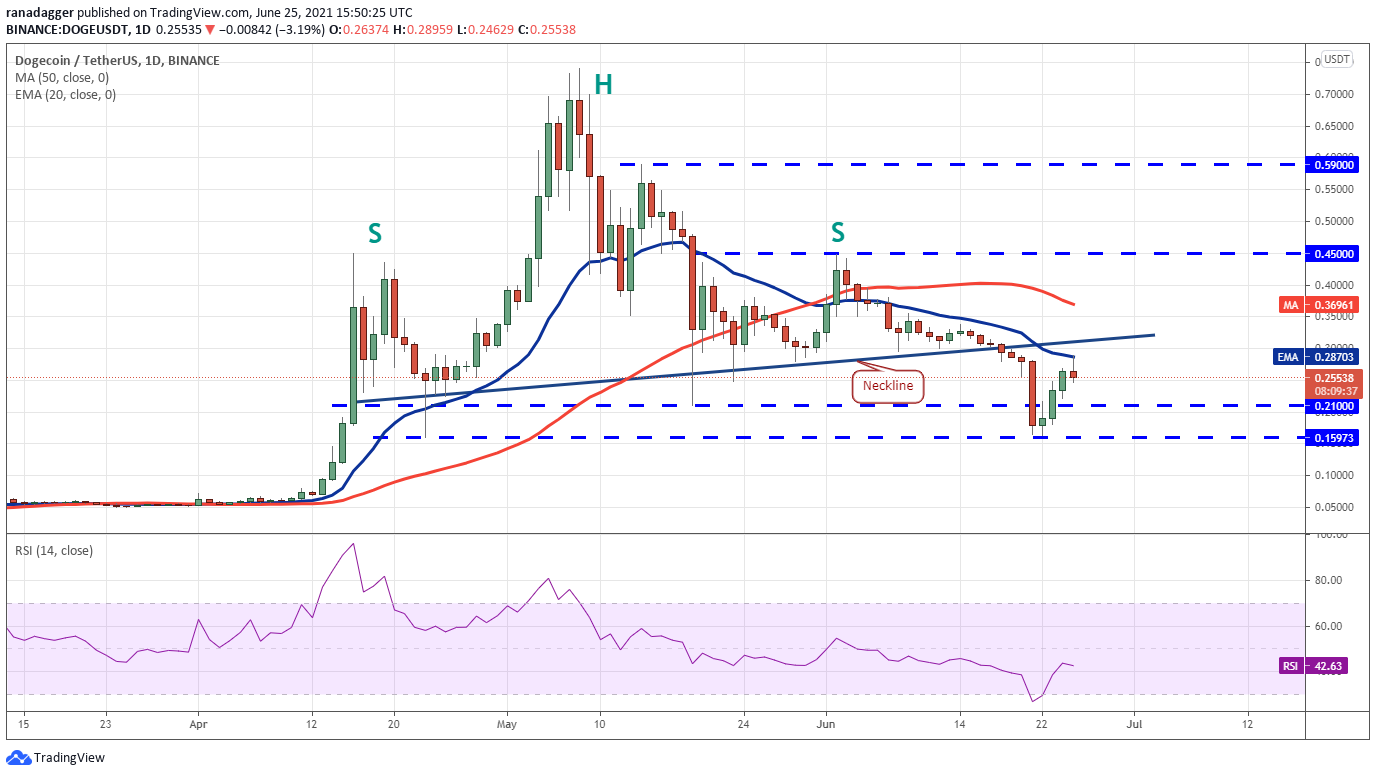
On the other hand, if the bulls defend the next drop to the $0.21 support, it will signal strength. A breakout and close above the neckline will be the first sign that the pair’s correction could be over and a bottoming formation may begin.
XRP/USDT
XRP’s rebound off the $0.50 support in the past few days could not even reach the breakdown level of $0.75. This suggests a lack of urgency among the traders to buy at these levels.
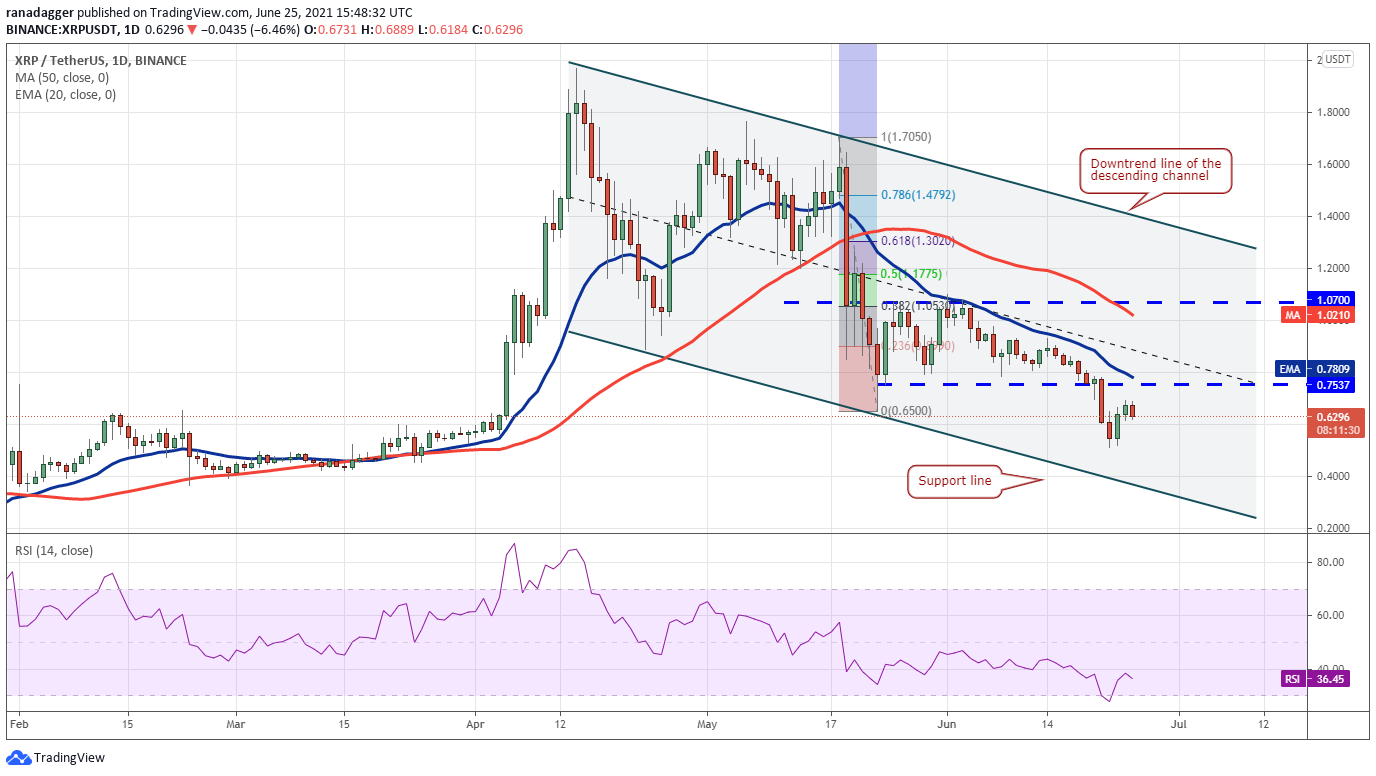
On the contrary, if the bulls buy the next dip to the $0.50 support, it will suggest accumulation at lower levels. The bulls will have to push and sustain the price above the 20-day EMA to suggest that the selling pressure is reducing.
DOT/USDT
Polkadot’s (DOT) rebound off $13 has been weak as the bulls have not even been able to push the price to the 20-day EMA ($20). This suggests that traders are in no great hurry to buy at the current levels.
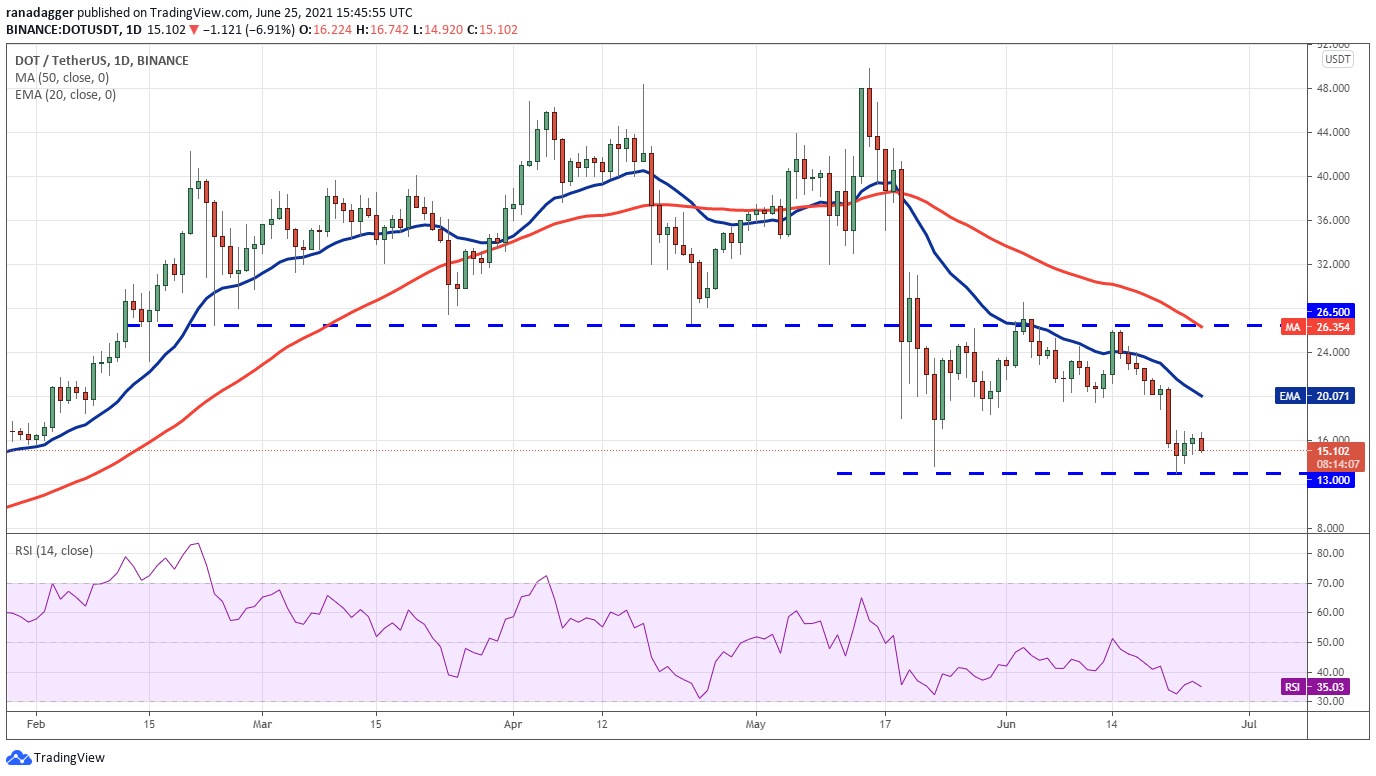
Conversely, if the price rebounds off $13 and rises above $17, the pair may rise to the 20-day EMA. A breakout and close above this resistance will open the doors for a move to $26.50. If the price turns down from this level, the pair may consolidate between $13 and $26.50 for the next few days.
UNI/USDT
Uniswap’s (UNI) rebound off $13 hit a wall at $18.60 on June 24. This suggests that demand dries up at higher levels. The downsloping moving averages and the RSI in the negative zone indicate that bears are in control.
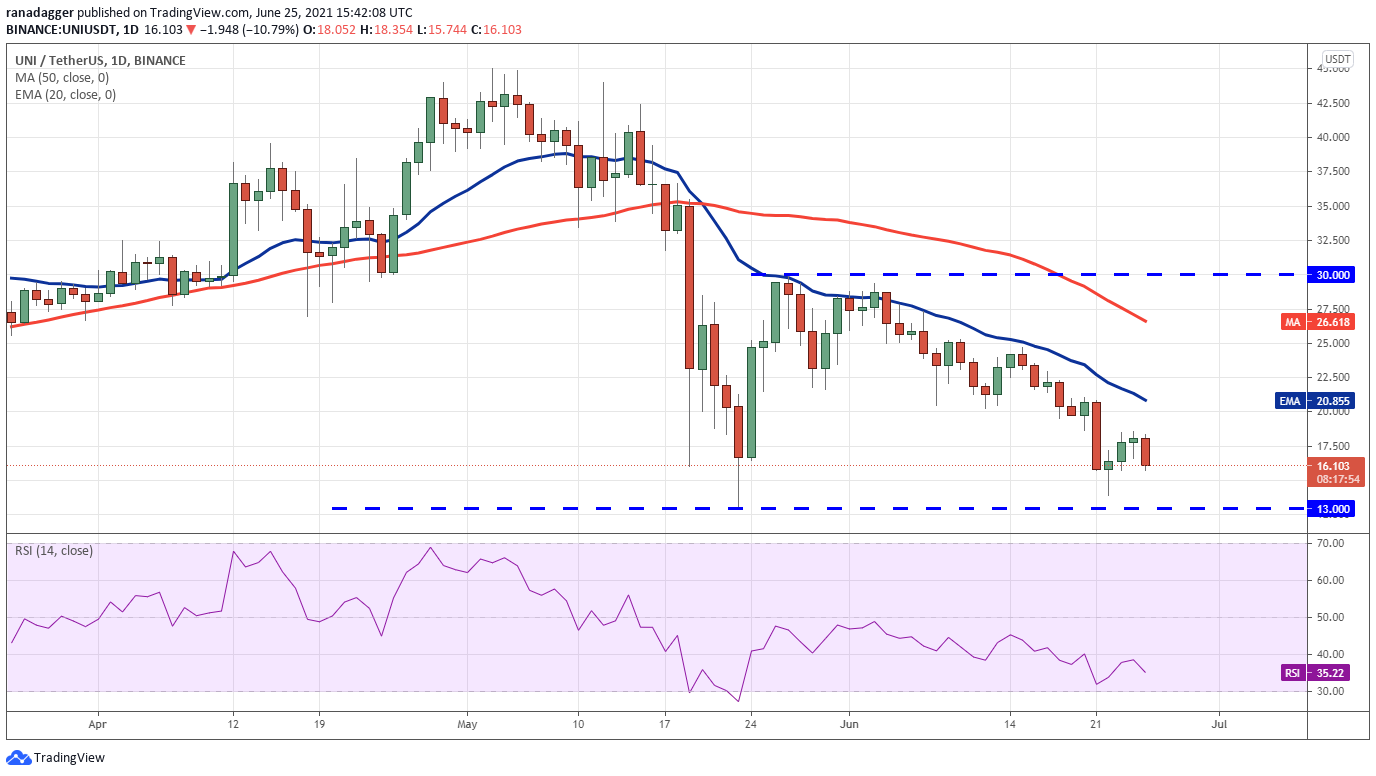
Alternatively, if the bulls again defend the $13 support, it will suggest accumulation at lower levels. The buyers will then try to drive the price above the 20-day EMA ($20). If they succeed, the pair could rally to the 50-day SMA ($26) and then to $30.
Related: Elon Musk agrees to speak with Twitter CEO Jack Dorsey at Bitcoin event
BCH/USDT
The bulls are struggling to thrust Bitcoin Cash (BCH) above the breakout level at $538.11, which suggests a lack of urgency among the bulls to accumulate at the current levels.
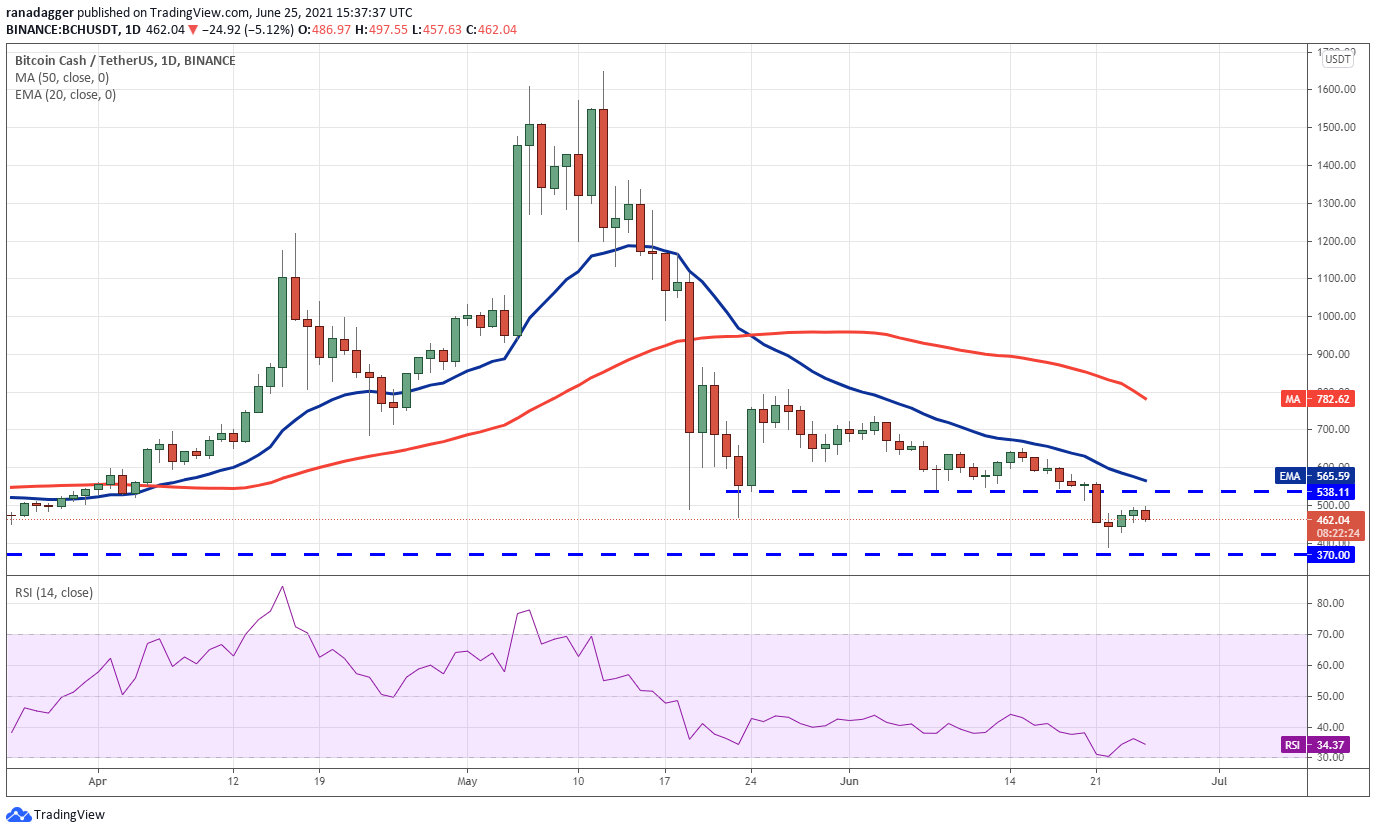
If they do that, the BCH/USDT pair could drop to the psychological support at $300 and then to $270. Contrary to this assumption, if the price again rebounds off $370, it will indicate strong buying at lower levels. The bulls will then attempt to push the price above the 20-day EMA ($565). If that happens, the pair may rally to the 50-day SMA ($782).
LTC/USDT
Litecoin’s (LTC) rebound off the $118 support lacks strength. This suggests that traders are not convinced that a bottom has been made. The downsloping moving averages and the RSI in the negative territory suggest that bears are in command.
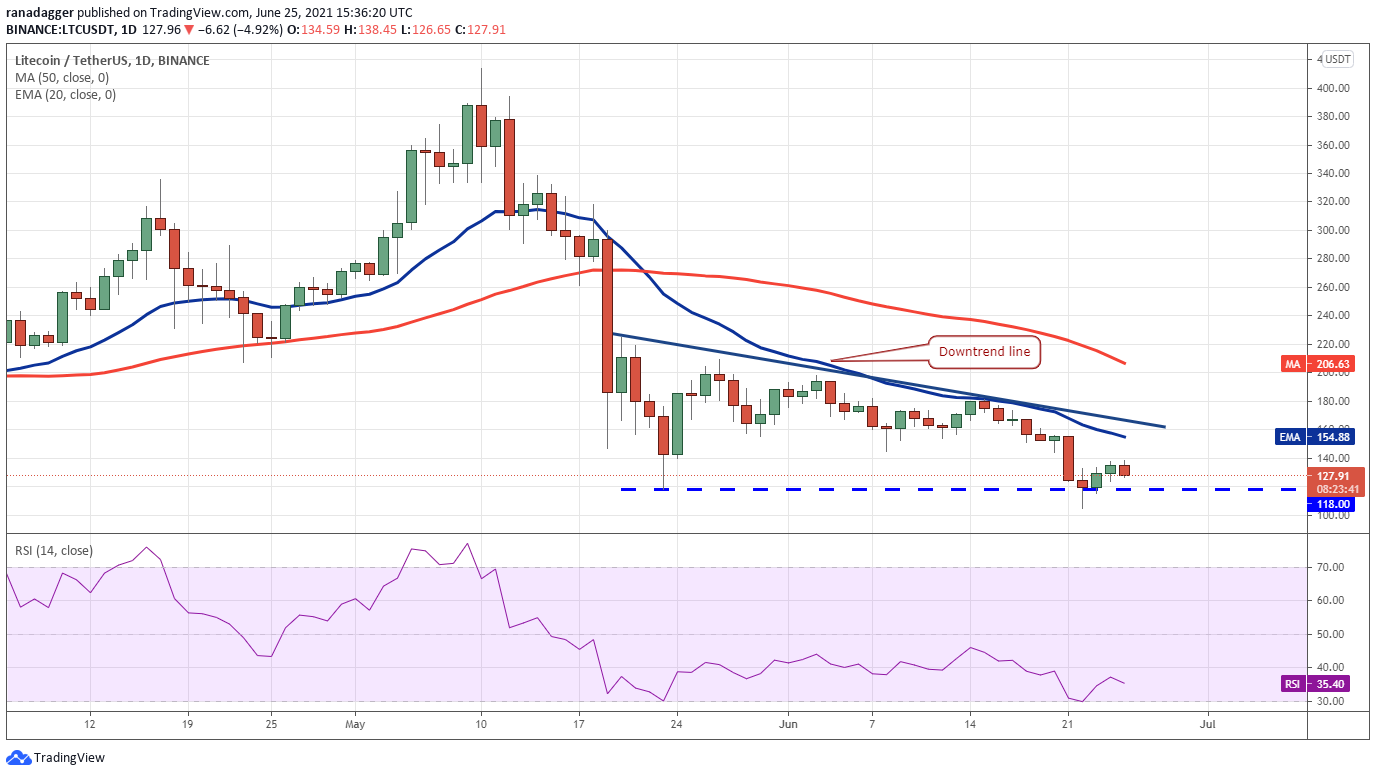
On the contrary, if the price rebounds off $118 once again, the bulls will again try to push the price to the downtrend line. A breakout and close above this resistance will suggest that the sellers are losing their grip. The pair could then rally to the 50-day SMA ($206).
The views and opinions expressed here are solely those of the author and do not necessarily reflect the views of Cointelegraph. Every investment and trading move involves risk. You should conduct your own research when making a decision.
Market data is provided by HitBTC exchange.

Leave A Comment