
A large part of the recent leg of Bitcoin’s (BTC) rally started after BlackRock filed to list a spot Bitcoin exchange-traded fund (ETF) on June 15. Several applications by other firms have been rejected by the United States Securities and Exchange Commission in the past. However, BlackRock’s filing has a 50% possibility of getting approved, said Bloomberg senior ETF analyst Eric Balchunas.
Another bullish catalyst for the cryptocurrency markets could be a filing by asset manager Fidelity Investments to launch its Bitcoin spot ETF. CoinShares Chief Strategy Officer Meltem Demirors said that firms managing $27 trillion of assets are “actively” pursuing efforts to allow their clients exposure in the crypto space.
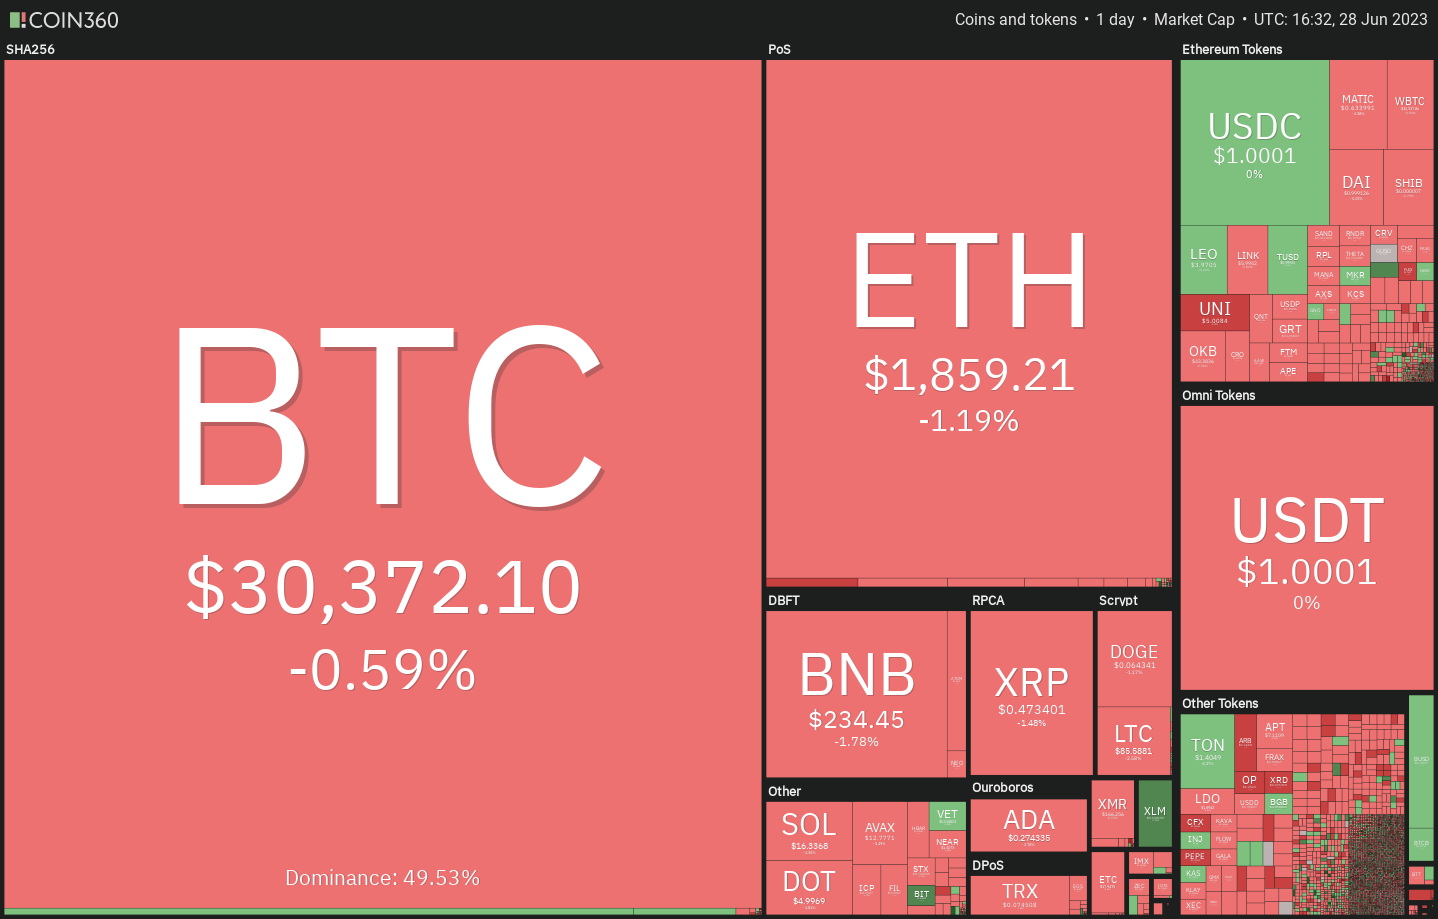
Will Bitcoin and altcoins break out of their respective overhead resistance levels or could they start a short-term correction? Let’s study the charts of the top-10 cryptocurrencies to find out.
Bitcoin price analysis
Buyers tried to catapult Bitcoin above the overhead resistance of $31,000 on June 27 but the bears did not budge. This keeps the price stuck inside the tight range between $31,000 and $29,500.

If buyers propel the price above $31,000, the BTC/USDT pair may resume its uptrend. The bears may try to stall the up-move at $32,400 but the buyers are likely to bulldoze their way through.
The first indication of weakness will be a close below $29,500. That may pull the price to the 20-day exponential moving average ($28,696). If this level cracks, the pair may stay range-bound between $31,000 and $24,800.
Ether price analysis
Ether’s (ETH) narrow range trading between $1,936 and $1,861 resolved to the downside on June 26. The bulls pushed the price back into the range on June 27 but could not sustain the higher levels.

Contrarily, if the price rebounds off the moving averages, it will suggest that the bulls are fiercely defending the level. The bulls will then make one more attempt to overcome the barrier at $1,937. If they succeed, the ETH/USDT pair could rally to the psychological level of $2,000 and then to $2,142.
BNB price analysis
BNB (BNB) has reached the first support at $230. This level has not been broken since June 13, hence the bulls will try to defend it aggressively.
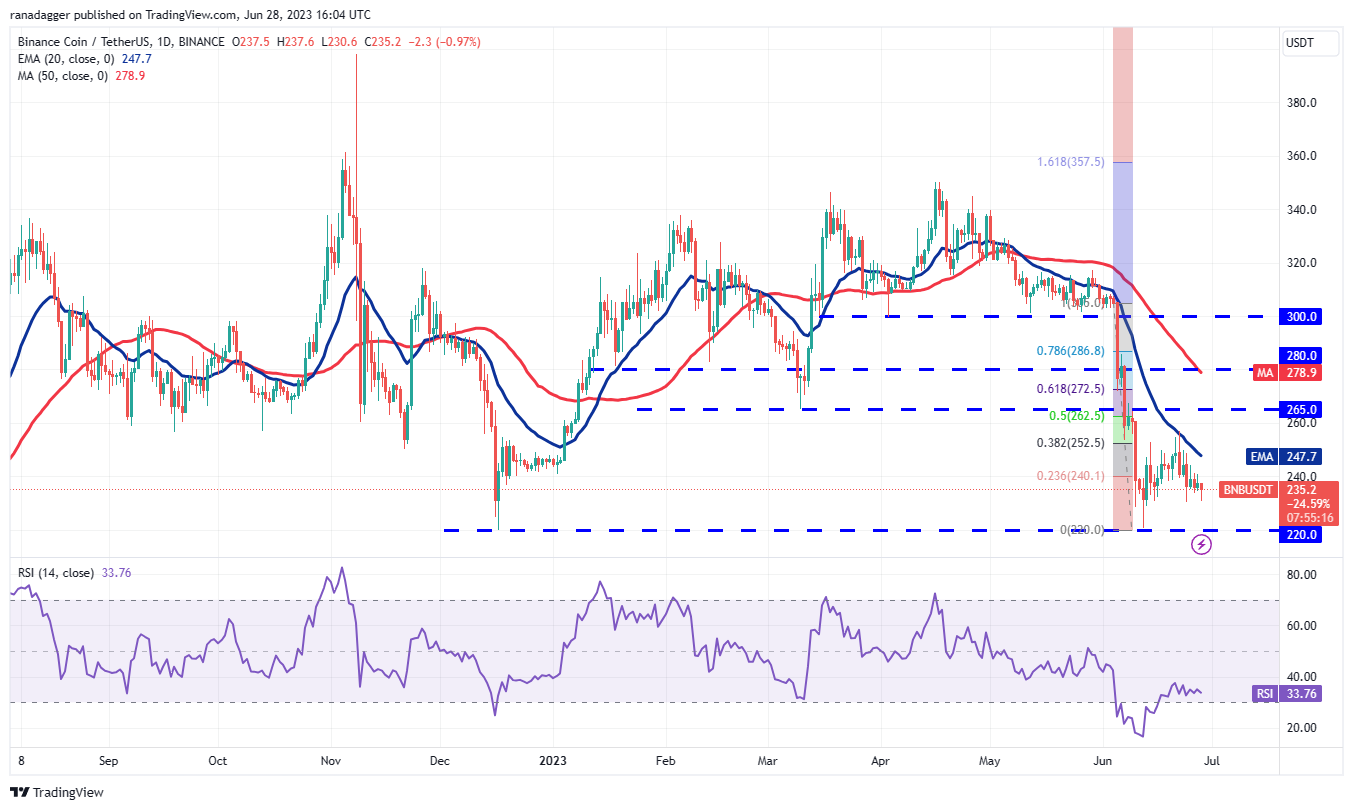
On the contrary, if the price dumps below $230, the pair could fall to the vital support at $220. This remains the key level to keep an eye on in the near term because a break and close below it may start the next leg of the downtrend to $200.
XRP price analysis
XRP (XRP) closed below the 50-day simple moving average ($0.48) on June 26 and the attempts by the bulls to push the price back above the level failed on June 27. This suggests that the bears are trying to flip the 50-day SMA into resistance.
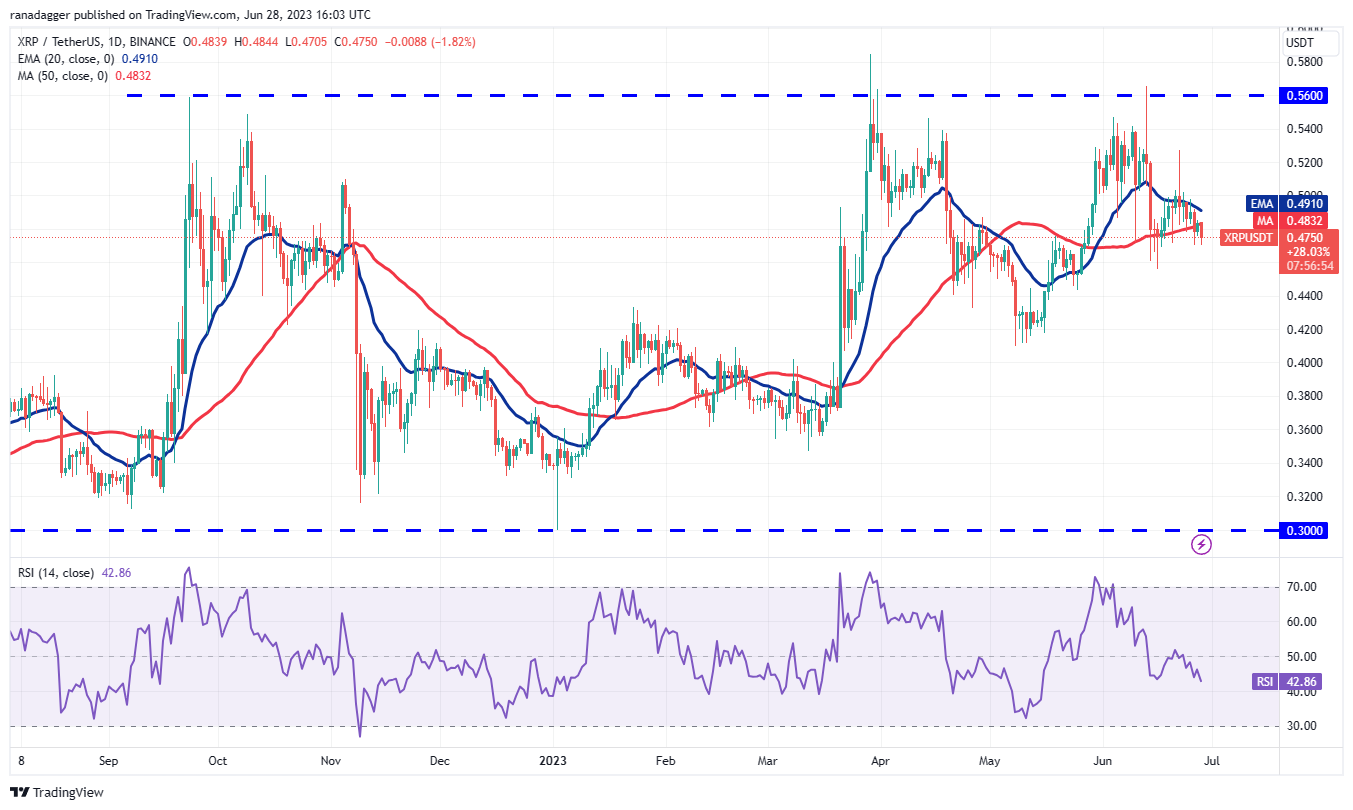
This negative view will invalidate in the near term if the price turns up from the current level and breaks above the 20-day EMA. That could open the doors for a possible rally to $0.53 and then to $0.56.
Cardano price analysis
The failure of the bulls to shove Cardano (ADA) above the overhead resistance of $0.30 may have resulted in profit booking.
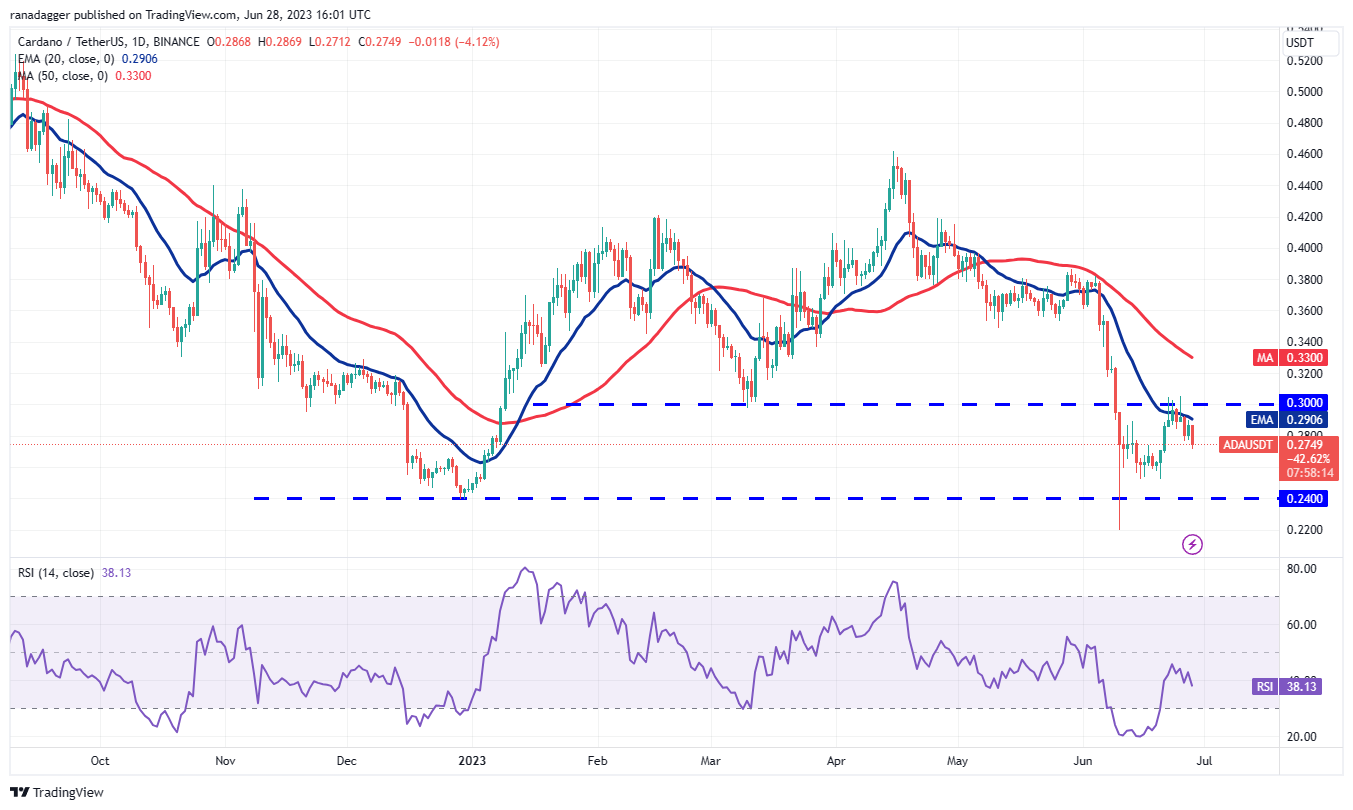
Buyers will have to kick and maintain the price above $0.30 to signal the start of a sustained recovery. The pair may first ascend to the 50-day SMA ($0.33) and later to $0.38. On the downside, a break and close below $0.24 may start the next leg of the downtrend.
Dogecoin price analysis
Dogecoin (DOGE) tripped below the 20-day EMA ($0.07) on June 26, indicating that the bears are fiercely defending the overhead resistance of $0.07.
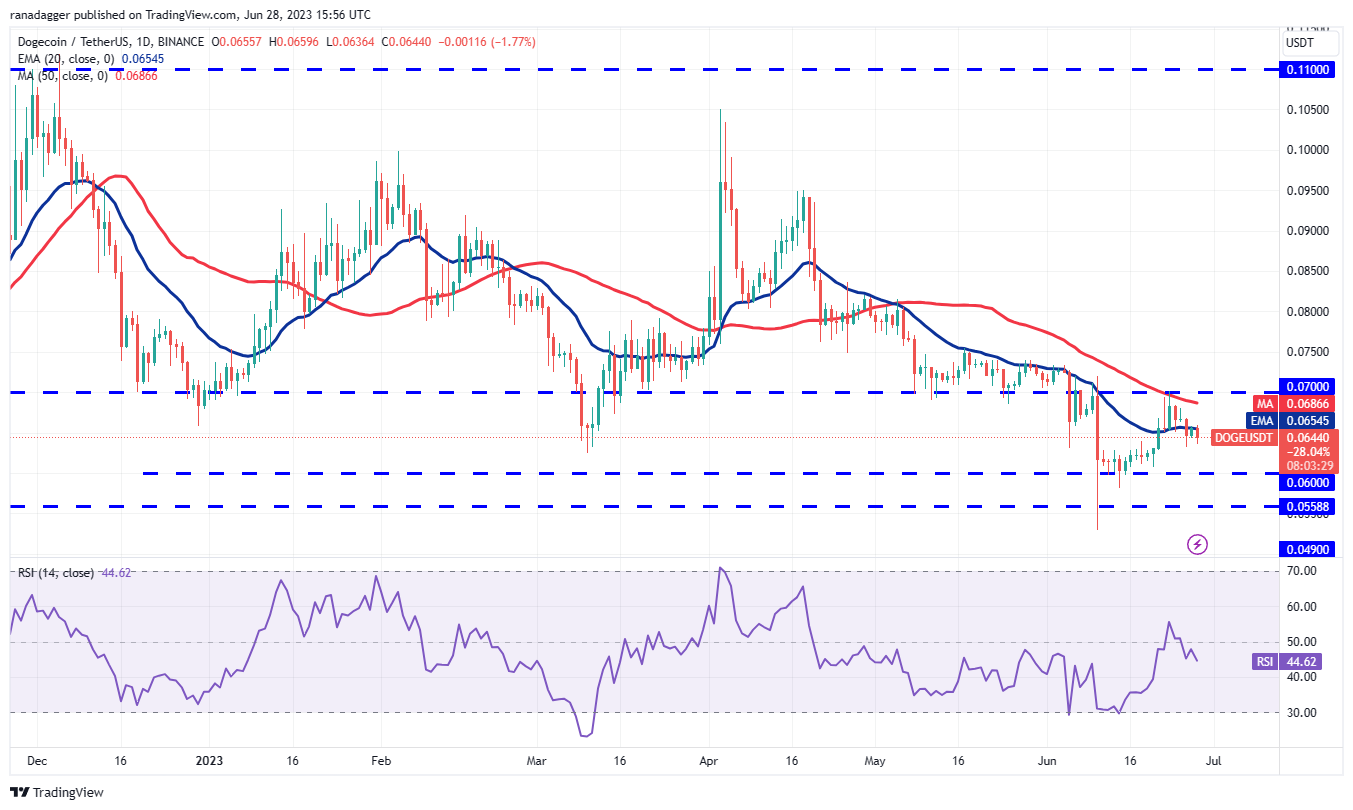
The flattish 20-day EMA and the RSI just below the midpoint also signal a possible consolidation in the near term. Buyers will have to overcome the barrier at $0.07 to start the next leg of the up-move to $0.08 and then to $0.10.
Solana price analysis
Solana (SOL) turned down from the 20-day EMA ($16.84) on June 26 and fell to the immediate support at $16.18. The bulls guarded the level on June 27 but they could not thrust the price above the 20-day EMA.
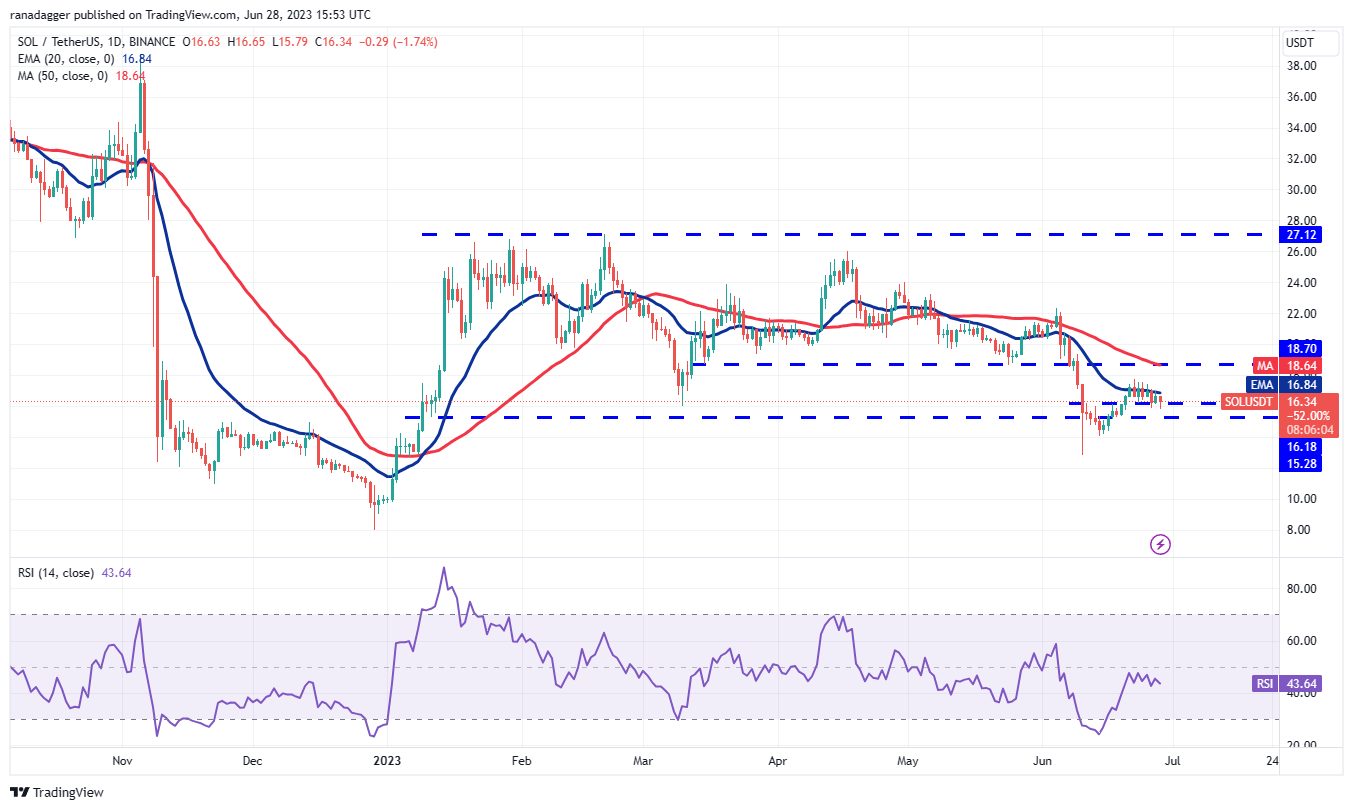
On the upside, the first sign of strength will be a break and close above the 20-day EMA. The pair may pick up momentum after the price rises above $17.75. The next stop is likely to be the breakdown level of $18.70.
Related: Ethereum price won’t see $2K anytime soon, market data suggests
Litecoin price analysis
The bulls managed to keep Litecoin (LTC) above the moving averages for the past few days but they could not start a rebound. This may tempt the bears to seize control.
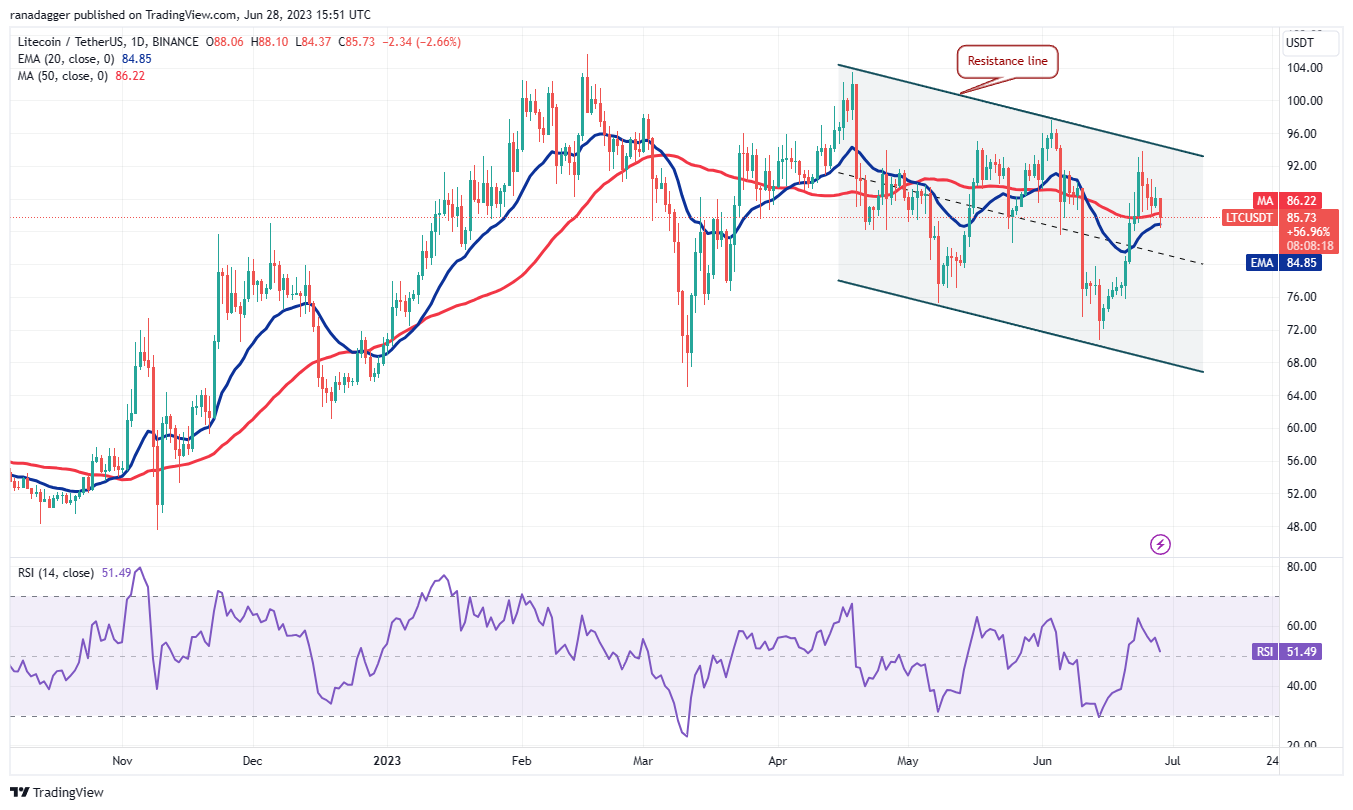
If bulls want to maintain their hold, they will have to quickly propel the price above the resistance line of the channel. The pair may then start an up-move, which could reach the overhead resistance at $105. The bears are expected to mount a strong defense at this level.
Polygon price analysis
Polygon (MATIC) traded in a narrow range near the overhead resistance of $0.69 for the past few days but the bulls failed to push the price above it.
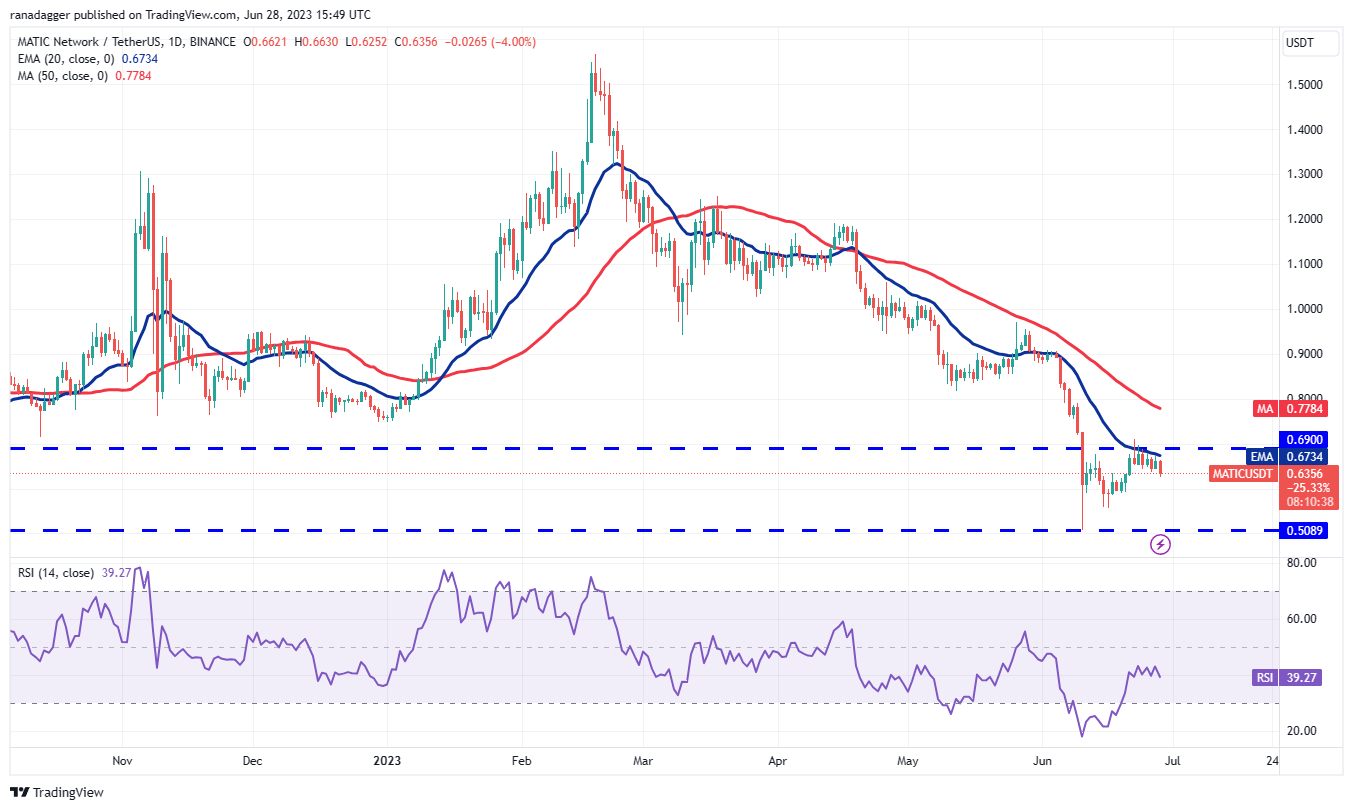
If bulls want to gain the upper hand, they will have to drive and sustain the price above $0.69. The MATIC/USDT pair may then climb to the 50-day SMA ($0.78).
Polkadot price analysis
Polkadot (DOT) has been trading near the breakdown level of $5.15 for the past five days. Although the bears successfully defended the level, a positive sign is that the bulls have not allowed the price to dip below the 20-day EMA ($4.91).
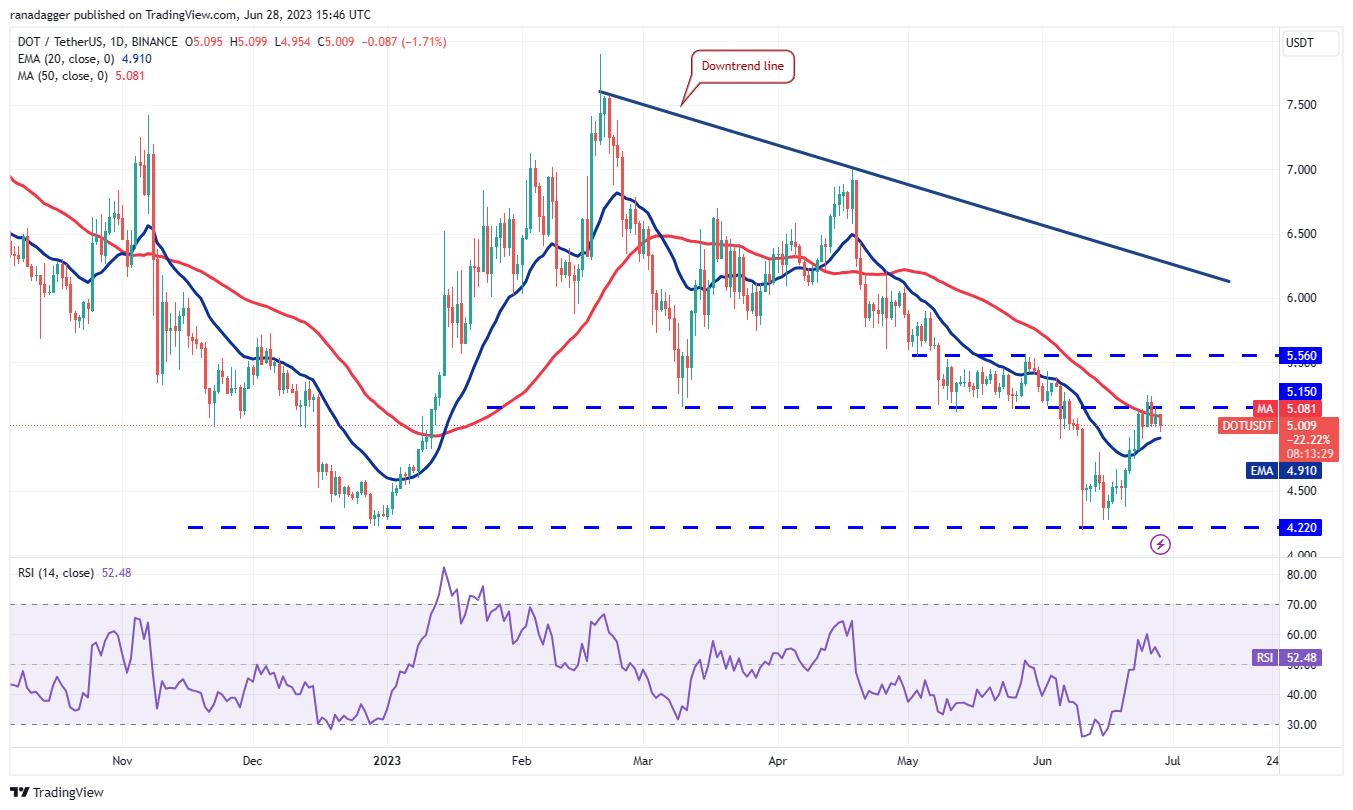
Contrary to this assumption, if the price turns down and breaks below the 20-day EMA, it will suggest that the bears are active at higher levels. The pair may then remain range-bound between $5.15 and $4.22 for a few days.
This article does not contain investment advice or recommendations. Every investment and trading move involves risk, and readers should conduct their own research when making a decision.
This article is for general information purposes and is not intended to be and should not be taken as legal or investment advice. The views, thoughts, and opinions expressed here are the author’s alone and do not necessarily reflect or represent the views and opinions of Cointelegraph.

Leave A Comment