
Bitcoin continues to test investors’ patience, as it remains stuck inside a tight range. Although the near term is boring, traders need to be on their toes because narrow ranges are generally followed by a sharp increase in volatility. The only problem is that it is difficult to predict the direction of the breakout with certainty.
Glassnode’s latest weekly newsletter highlighted that Bitcoin’s (BTC) consolidation has shrunk the Bollinger Bands, which are separated by just 4.2%. Citing various on-chain indicators, the authors concluded that investors are unwilling to sell, and in several aspects, it looks similar to “periods like 2016 and 2019-20, characterized by choppy market conditions.”
Will Bitcoin plunge below the support of the range and start a new downward move, dragging several altcoins lower? Let’s study the charts of the top 10 cryptocurrencies to find out.
Bitcoin price analysis
Bitcoin has been sustaining below the 20-day exponential moving average (EMA) of $30,067 since July 17, which is a negative sign. It shows a lack of aggressive buying at current levels.
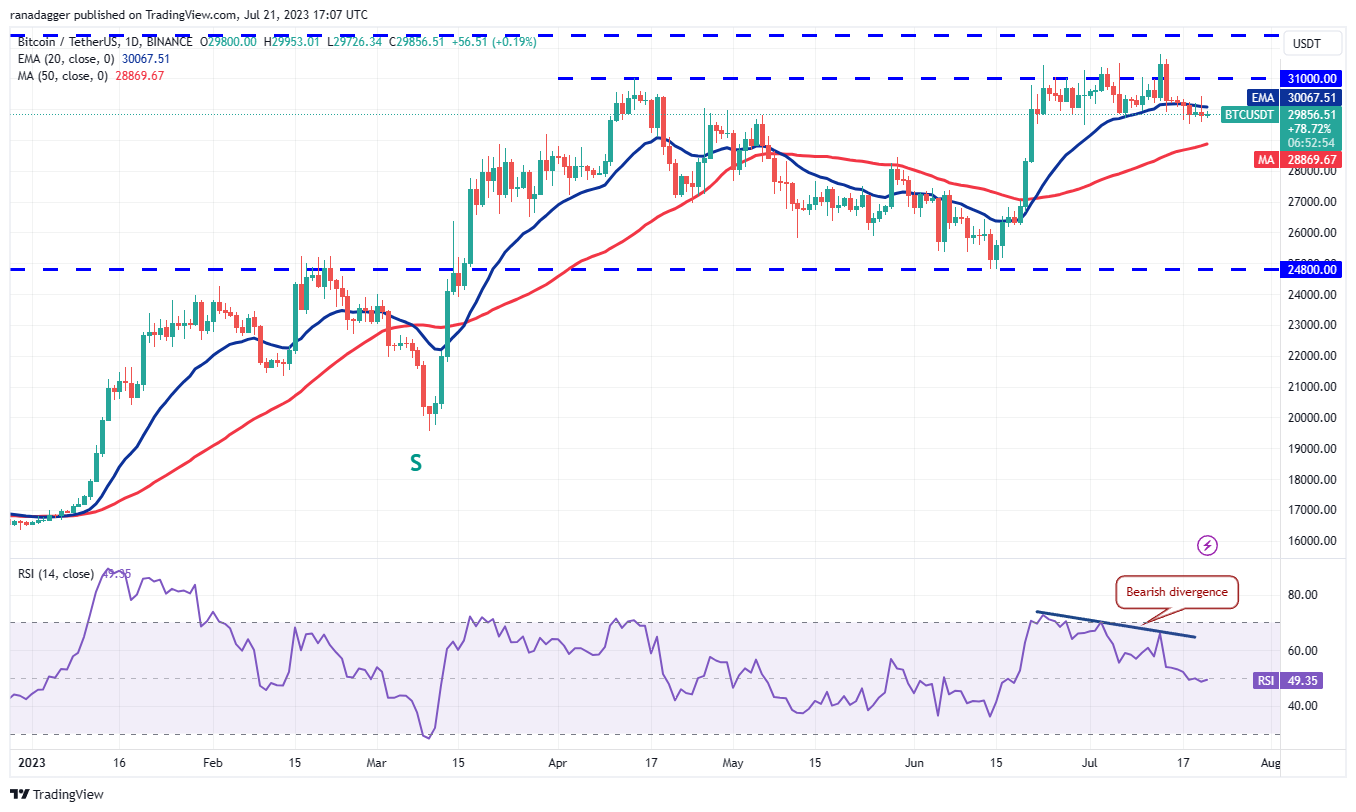
If they succeed, it will indicate that the consolidation has resolved in favor of the bears. The BTC/USDT pair may then skid to the 50-day simple moving average (SMA) of $28,869 and thereafter to $27,500.
Conversely, if the price turns up sharply and breaks above the 20-day EMA, it will suggest that the pair may rise to $31,000. A new uptrend could be expected on a break and close above $32,400.
Ether price analysis
Ether (ETH) has been trading near the 20-day EMA ($1,896) for the past few days. This suggests a state of equilibrium between the bulls and the bears.
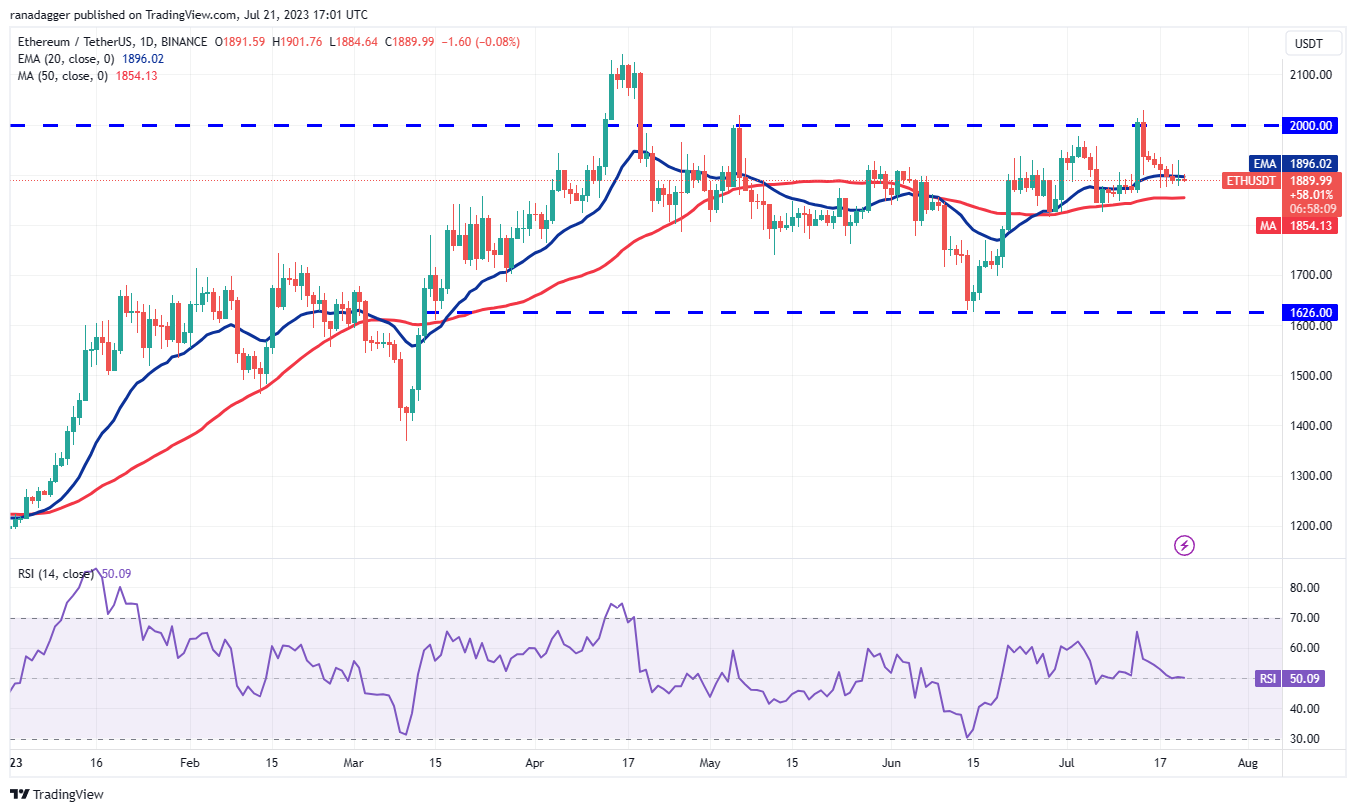
Contrarily, if the price turns up from the current level or the 50-day SMA and rises above $2,000, it will signal that bulls are in the driver’s seat. The pair may then soar to $2,141 and eventually to $2,200.
XRP price analysis
The bulls propelled XRP (XRP) above the overhead resistance of $0.83 on July 19 and 20, but they could not build upon this strength.
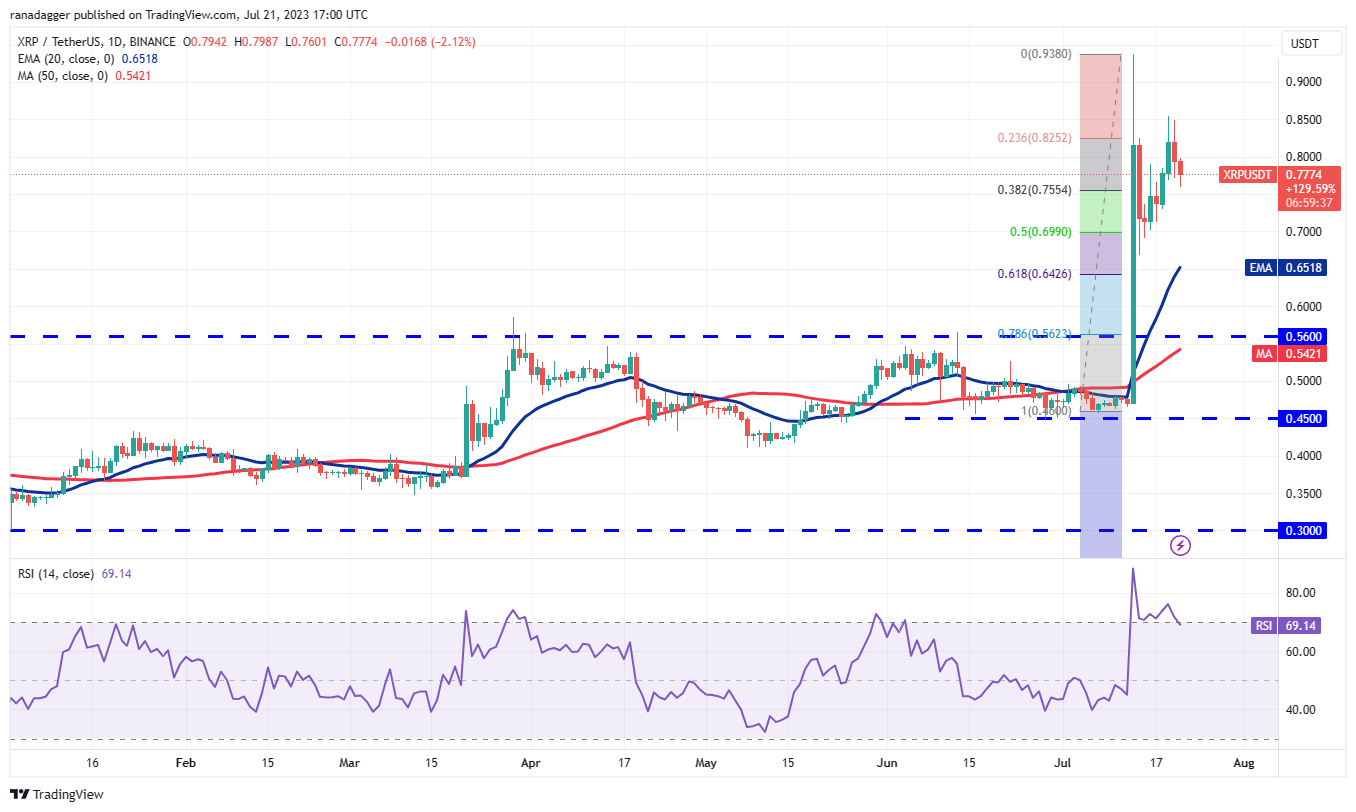
If the price rebounds off this level, the XRP/USDT pair may continue its range-bound action between $0.65 and $0.85 for some time.
A break and close above $0.85 could open the doors for a possible retest of $0.94, while a drop below $0.65 could sink the pair to $0.56.
BNB price analysis
BNB (BNB) continues to trade inside the symmetrical triangle pattern, suggesting indecision between the bulls and the bears.

If buyers thrust the price above the triangle, the BNB/USDT pair may rise to the overhead resistance at $265. This is an important resistance to keep an eye on because a break above it will clear the path for a potential rally to $280 and then to $300.
The bears will have to sink and sustain the price below the triangle to seize control. The selling could intensify further if the $220 support gives way.
Cardano price analysis
Cardano’s (ADA) bounce off the 20-day EMA ($0.31) on July 19 fizzled out at $0.33 on July 20. This suggests that bears are selling on relief rallies.
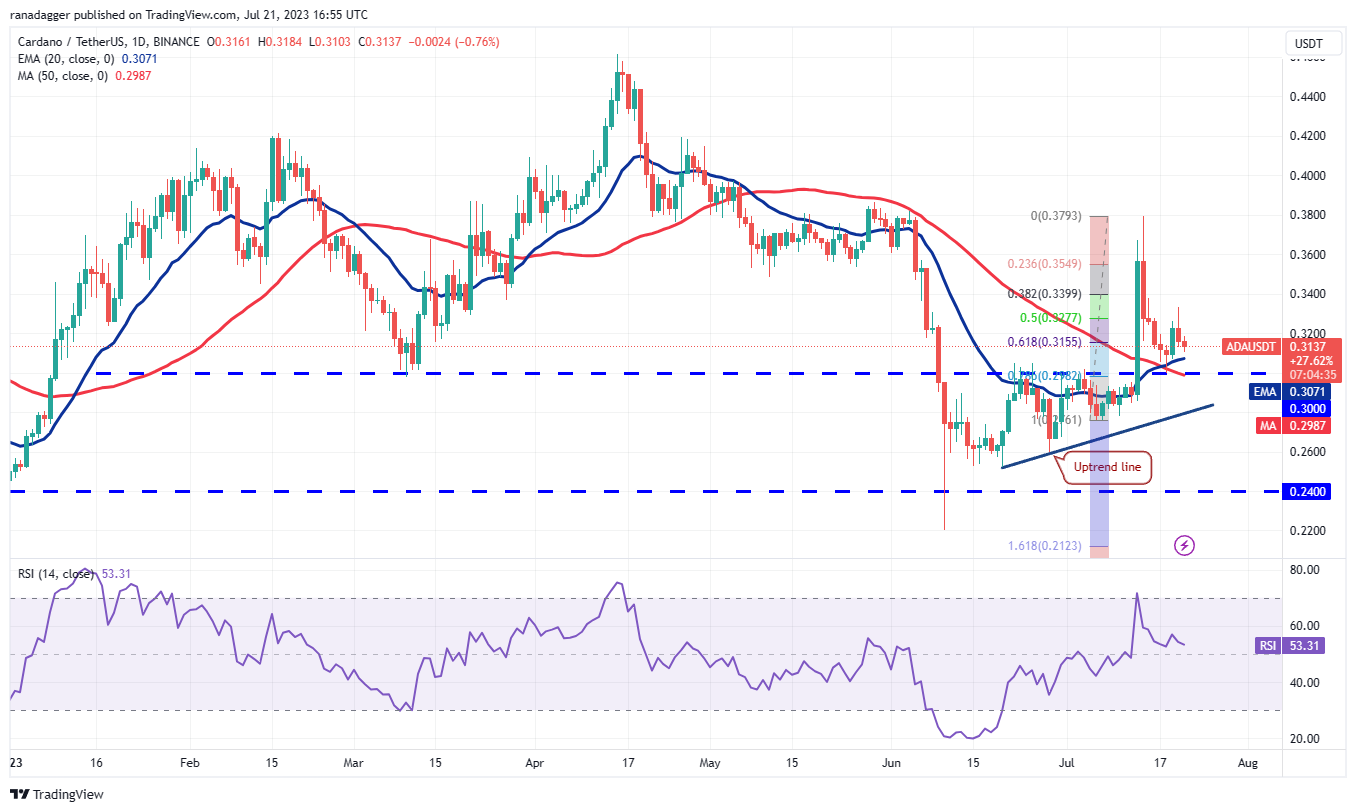
On the contrary, if the price continues lower and breaks below the moving averages, it will signal that bears are back in the game. The pair could then descend to the uptrend line. This level may attract solid buying by the bulls.
Solana price analysis
The bulls tried to propel Solana (SOL) above the overhead resistance at $27.12 on July 19 and 20, but the bears did not budge. This shows that bears are selling on rallies.

If bulls want to prevent the decline, they will have to quickly push and sustain the price above $27.12. If they do that, the SOL/USDT pair could rally to $29.12 and subsequently to $32.13.
Dogecoin price analysis
The bulls successfully defended the 20-day EMA ($0.07) in the past few days, indicating that Dogecoin (DOGE) is attracting buyers at lower levels.
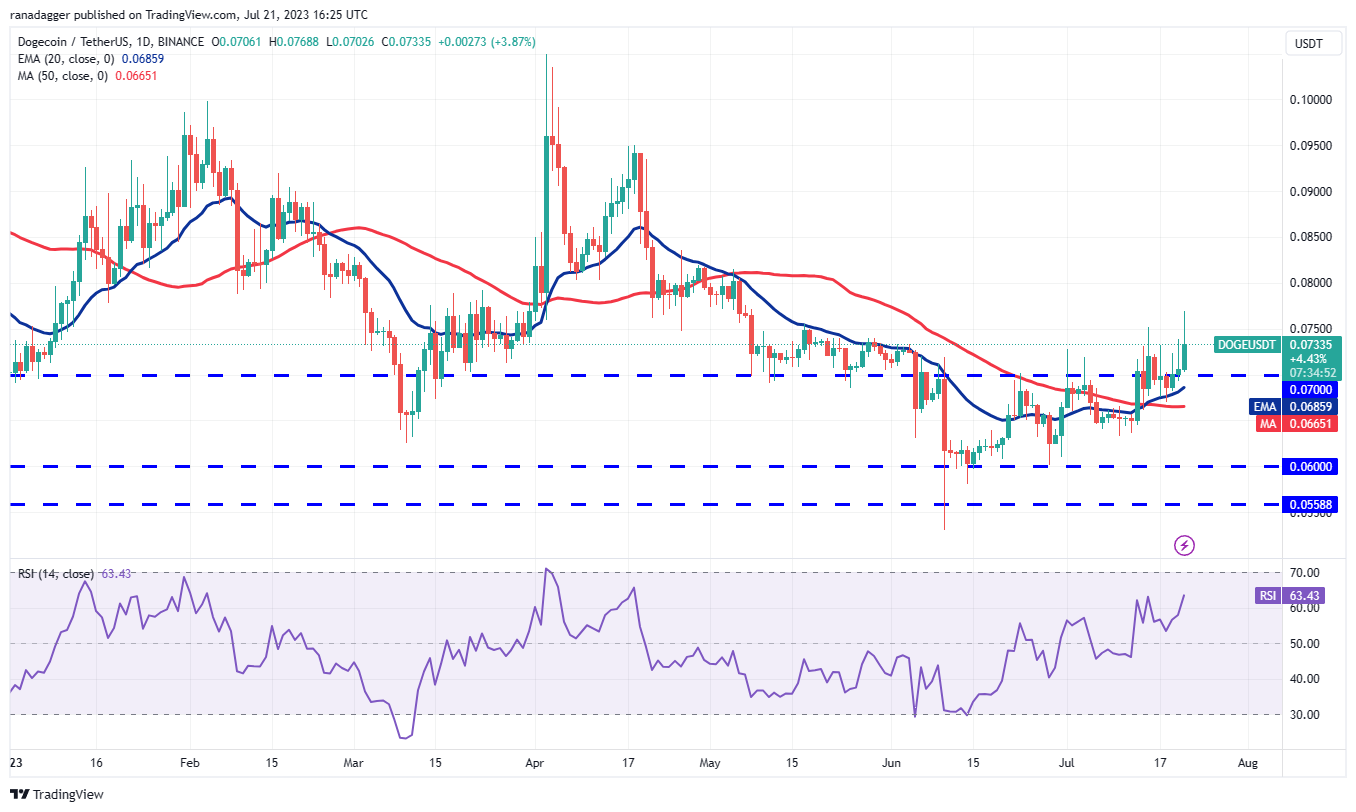
If bears want to invalidate this positive view, they will have to quickly yank the price below the moving averages. Such a move will suggest that the rally above $0.07 may have been a bull trap. The pair may then slump to $0.06.
Related: XRP price searches for a fresh bullish catalyst to trigger a move above $1
Polygon price analysis
Polygon (MATIC) turned up from the 20-day EMA ($0.74) on July 20, indicating that the bulls are trying to flip the level into support.
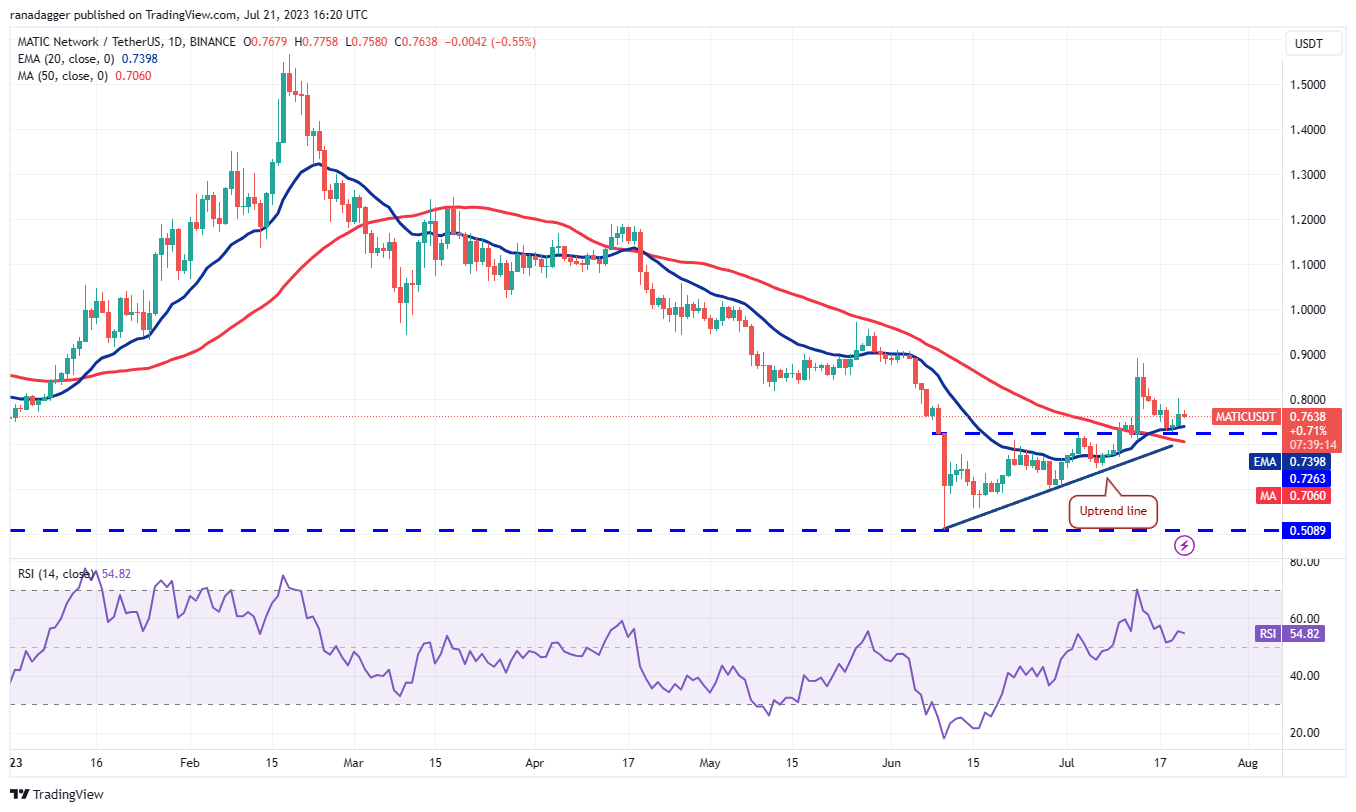
Contrary to this assumption, if the price turns down and plummets below the 50-day SMA ($0.71), it will signal that bears are back in the game. The pair could then slide to $0.60.
Litecoin price analysis
Litecoin (LTC) has been stuck between the moving averages for the past few days, indicating indecision between the bulls and the bears.
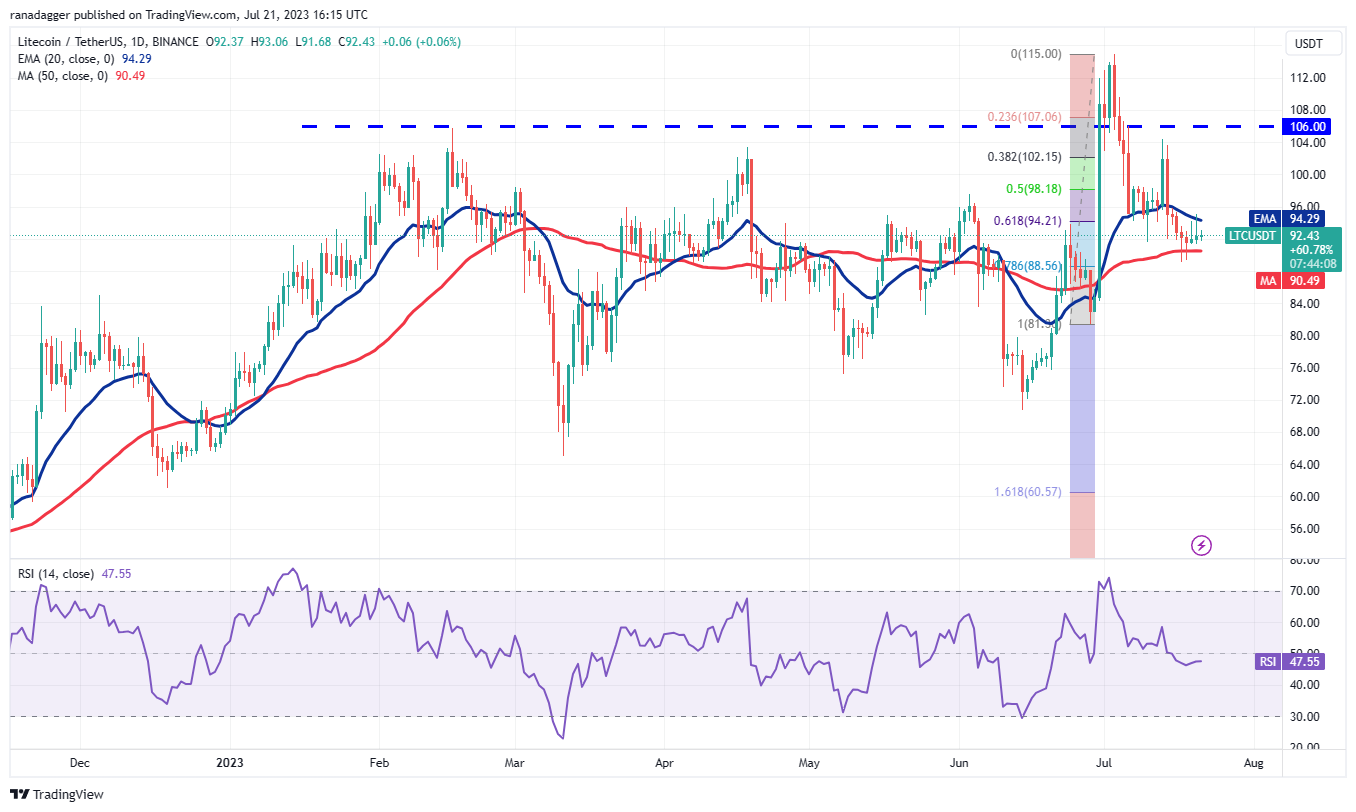
If the price breaks and closes below the 50-day SMA ($90), the selling could pick up and the LTC/USDT pair may slump to $80. Alternatively, a break and close above the 20-day EMA could open the doors for a relief rally to $106.
Polkadot price analysis
Polkadot (DOT) bounced off the strong support at $5.15 on July 19 and reached the overhead resistance at $5.64 on July 21, indicating that lower levels continue to attract buyers.
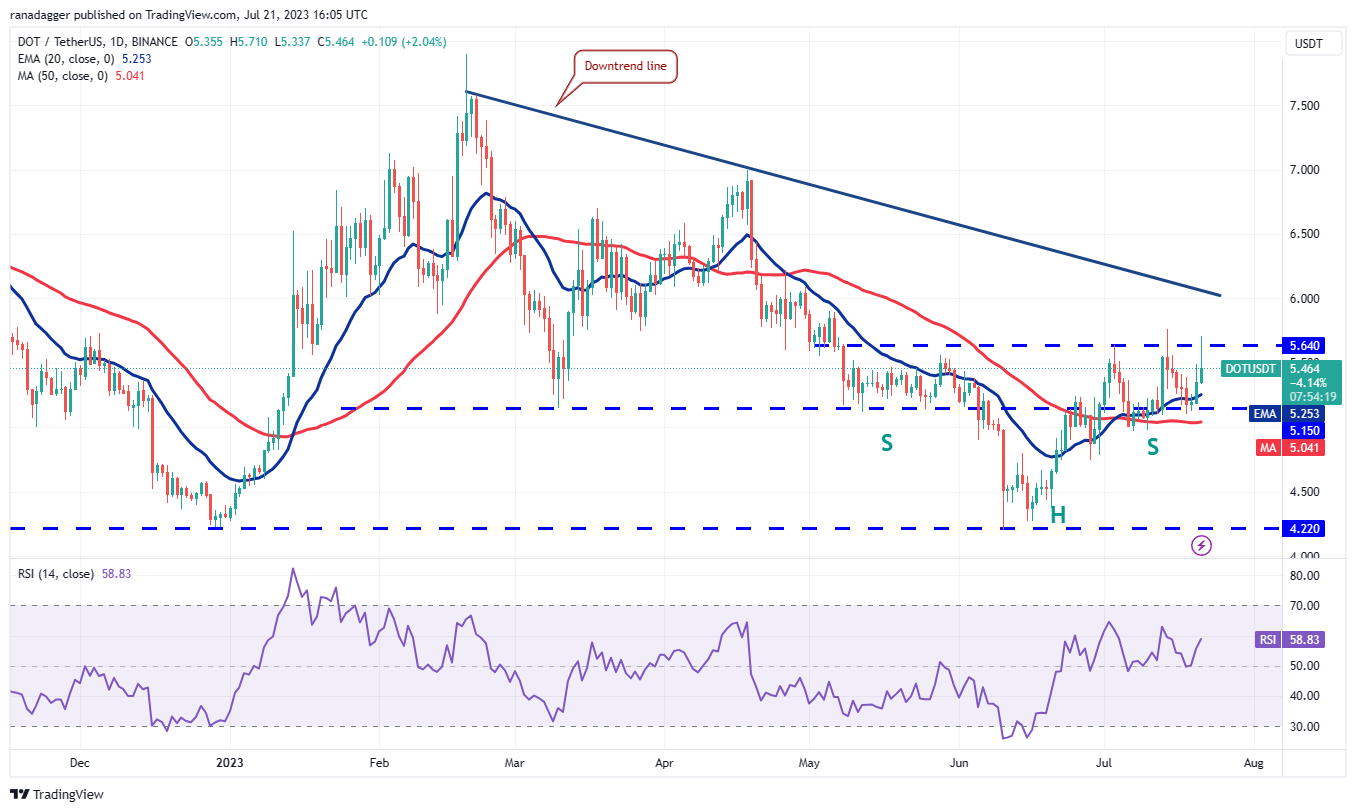
A minor advantage in favor of the bulls is that the RSI has stayed in positive territory and the 20-day EMA ($5.25) is moving up gradually. Buyers need to overcome the barrier at $5.64 to start the next leg of the uptrend toward $7.
This article does not contain investment advice or recommendations. Every investment and trading move involves risk, and readers should conduct their own research when making a decision.

Leave A Comment