A tight range usually resolves with a range breakout and that is what happened in Bitcoin (BTC) on Aug. 17. Bitcoin fell sharply, resulting in a $1 billion liquidation for derivatives traders, the biggest since the FTX collapse in 2022.
It is difficult to pinpoint any specific reason for the sell-off but analysts believe that the confusion arising from the alleged write-down of SpaceX’s $373 million Bitcoin holdings may have been one of the potential triggers.
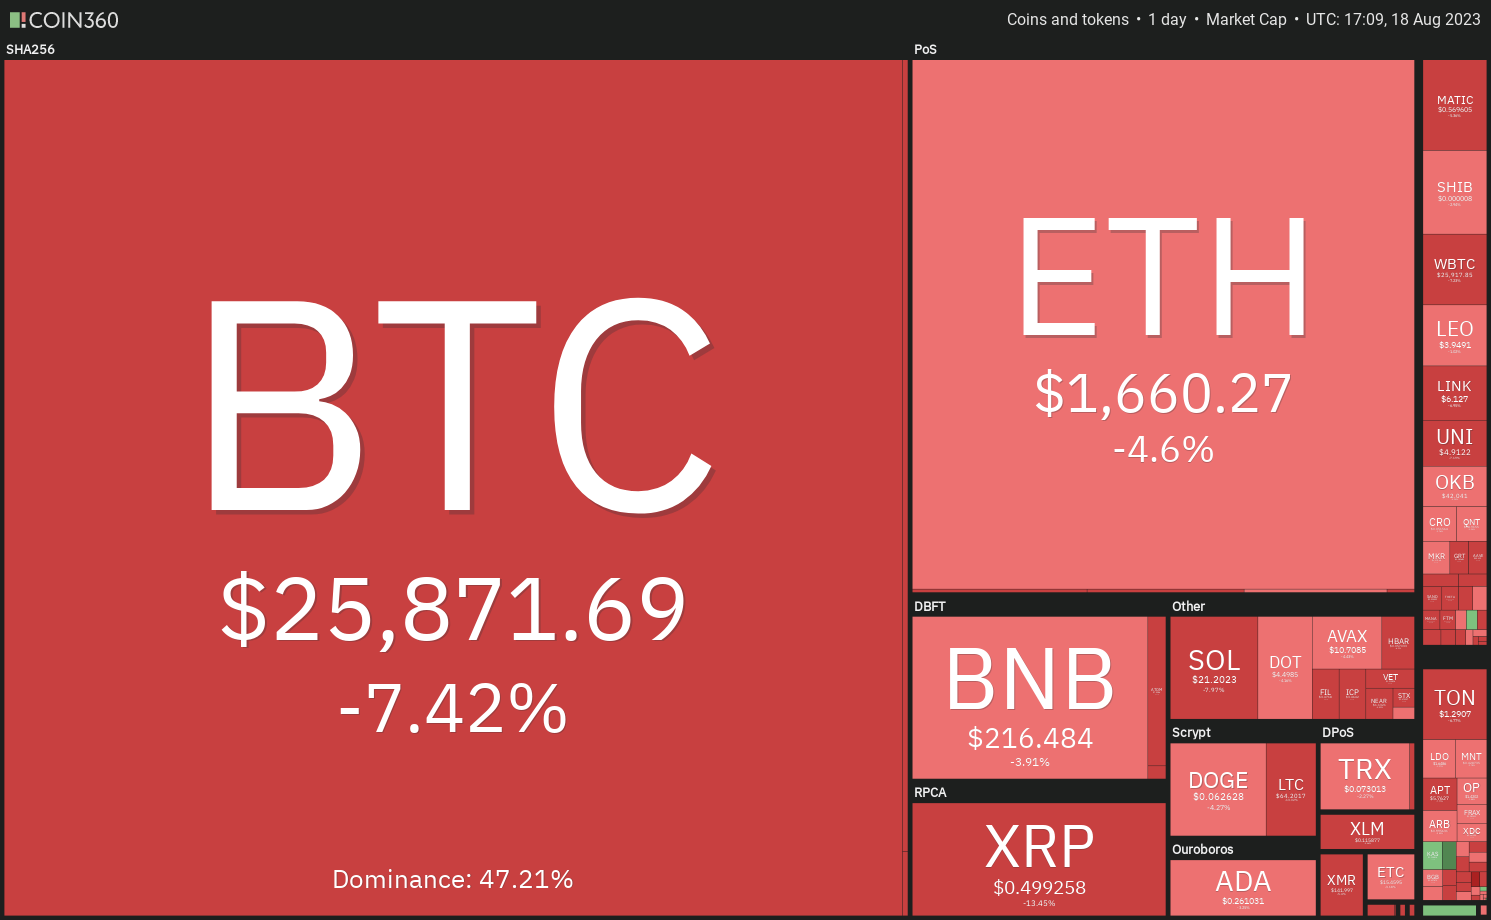
Will Bitcoin continue to drop, dragging the rest of the cryptocurrency markets with it? What are the important support levels to keep an eye on? Let’s study the charts of the top-10 cryptocurrencies to find out.
Bitcoin price analysis
Bitcoin’s narrow range resolved to the downside on Aug. 17, triggering a long liquidation, which pulled the price to $25,166.
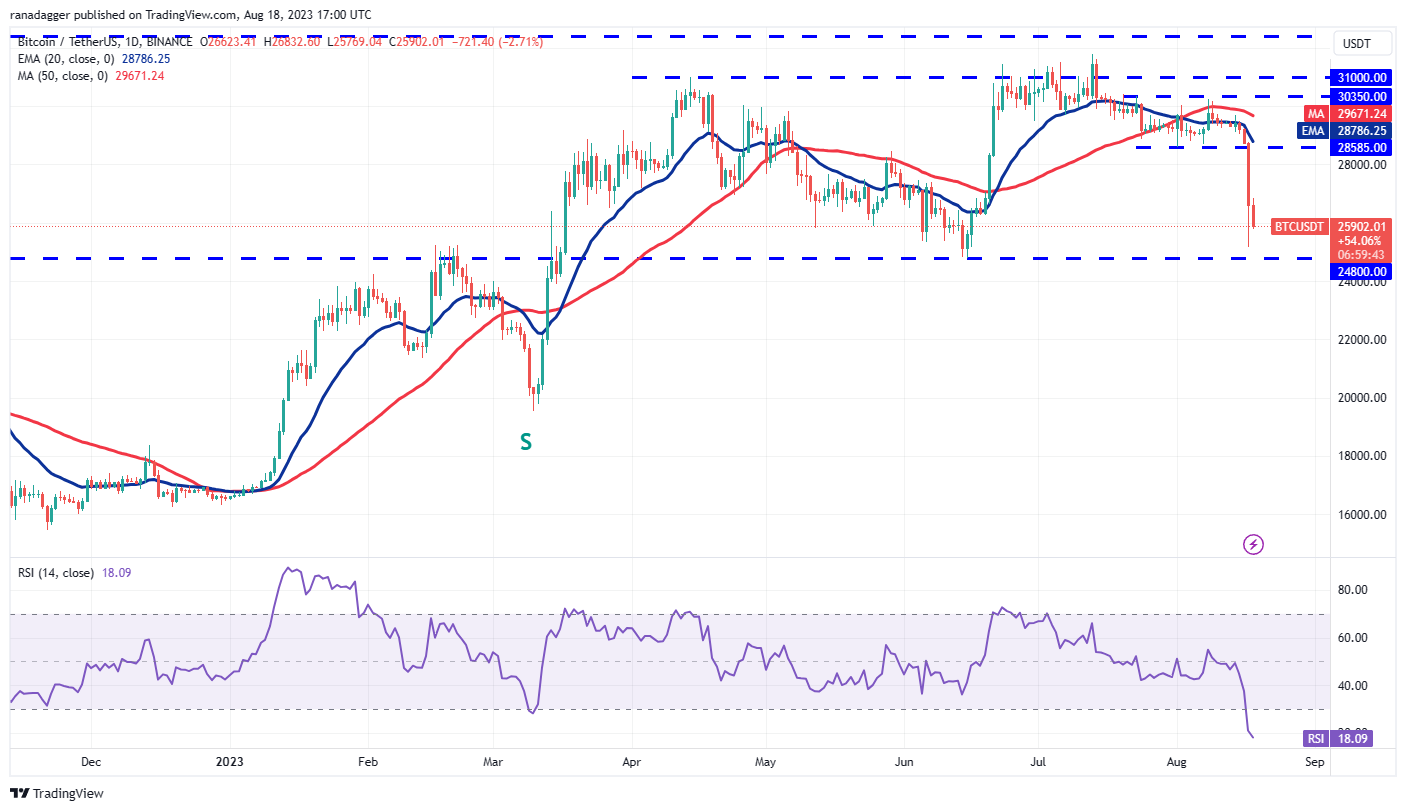
If the price rebounds off $24,800 with strength, it could reach the 20-day exponential moving average ($28,786). This is an important level to keep an eye on. If the price turns down from the 20-day EMA, it will suggest that bears are selling on rallies. That could increase the likelihood of a break below $24,800. If that happens, the pair may nosedive to $20,000.
The first sign of strength will be a break and close above the 20-day EMA. That will point to a possible consolidation in the near term.
Ether price analysis
Ether (ETH) turned down and broke below the immediate support at $1,816 on Aug. 16, indicating that the bears are in control.
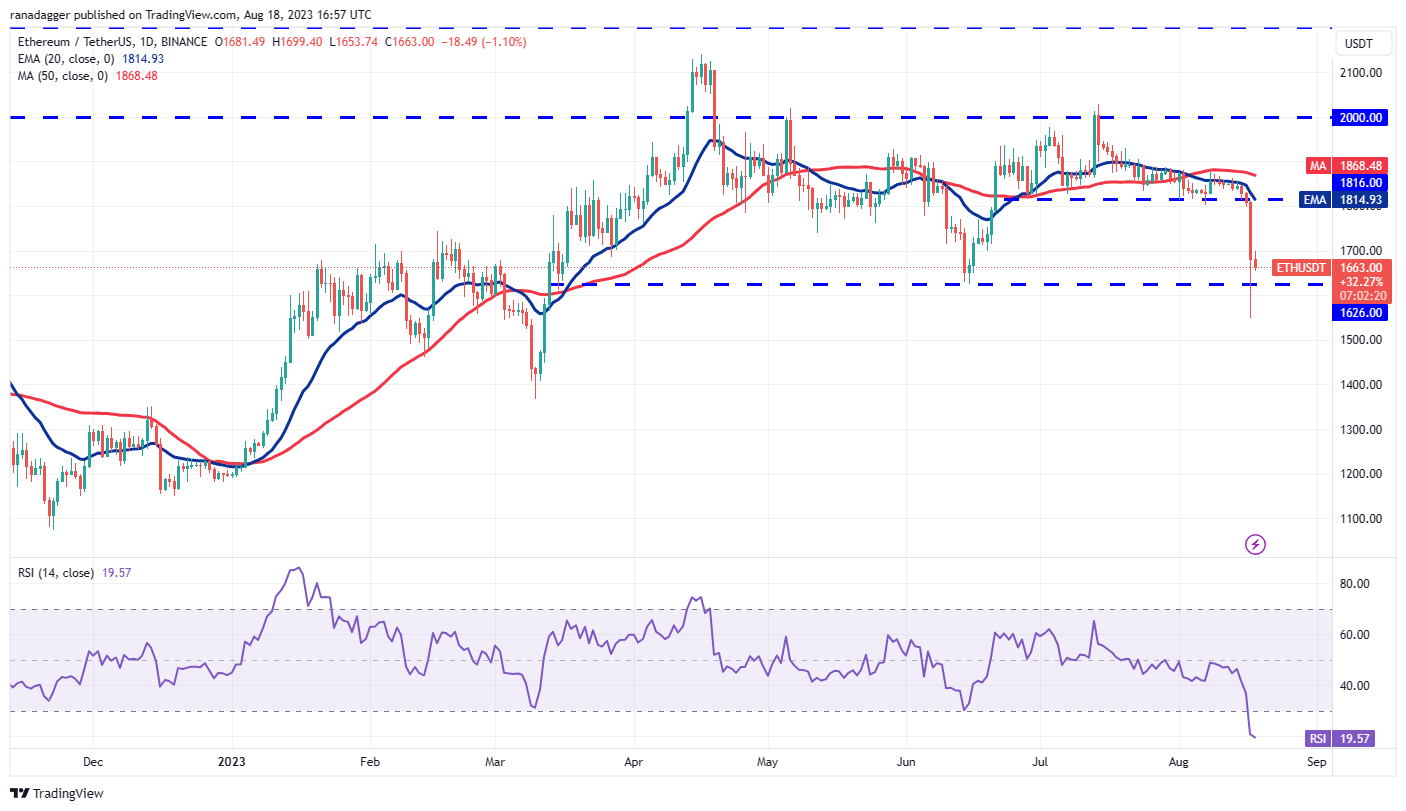
The sharp fall has sent the RSI into the oversold territory, indicating that the selling may have been overdone in the near term. The pair may witness a consolidation or a short-term recovery in the next few days. That could keep the pair stuck inside the large range between $2,000 and $1,626.
This view will be invalidated if the price turns down and plunges below the support at $1,550. That could open the doors for a possible decline to $1,368.39.
BNB price analysis
BNB (BNB) broke and closed below the symmetrical triangle pattern on Aug. 16, indicating that the bears overpowered the bulls.
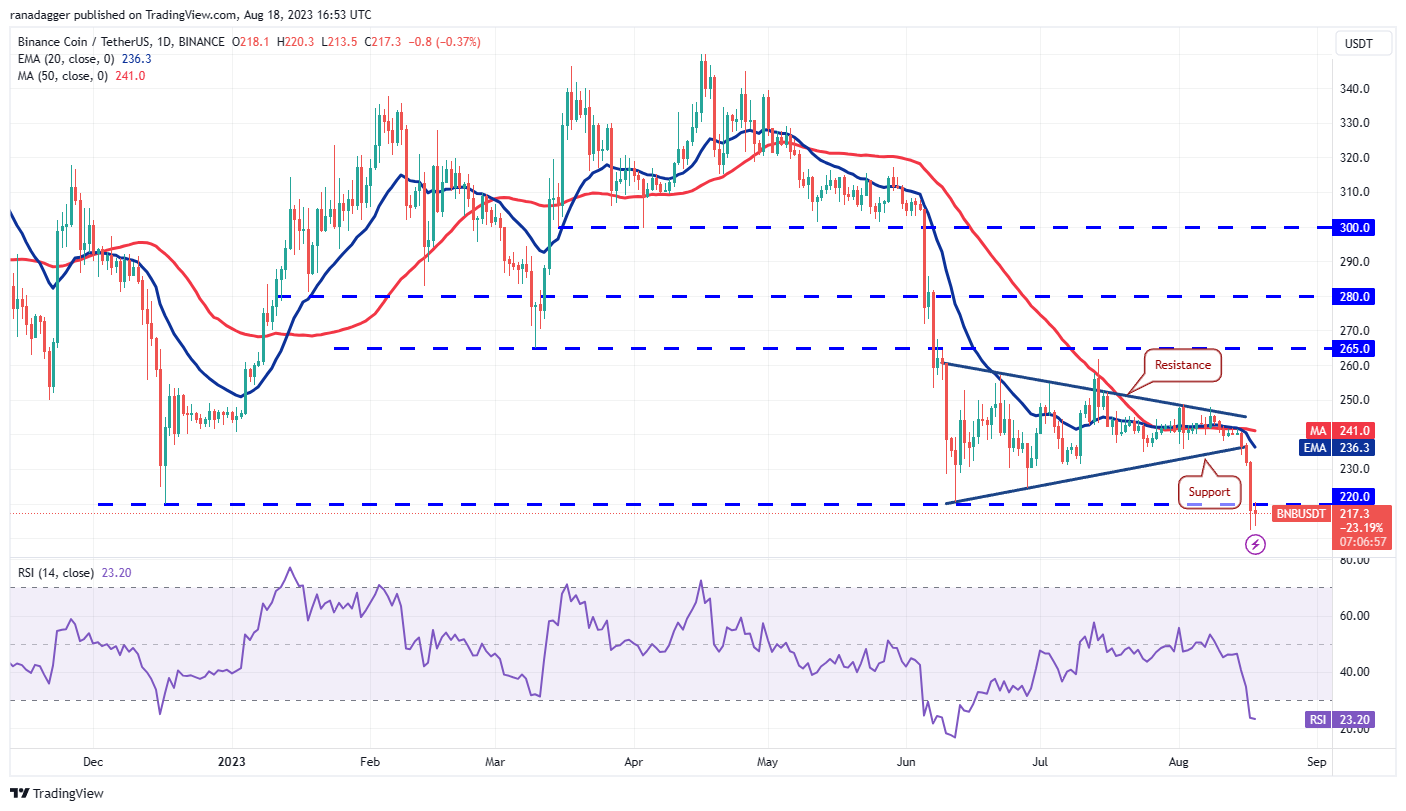
Instead, if buyers drive the price back above $220, a recovery to the 20-day EMA ($236) is possible. A break above this level will suggest that the breakdown below $220 may have been a bear trap. That could keep the pair stuck inside the $265 to $220 range for a while longer.
XRP price analysis
XRP (XRP) tumbled below the breakout level of $0.56 on Aug. 17, indicating continued selling pressure from the bears.
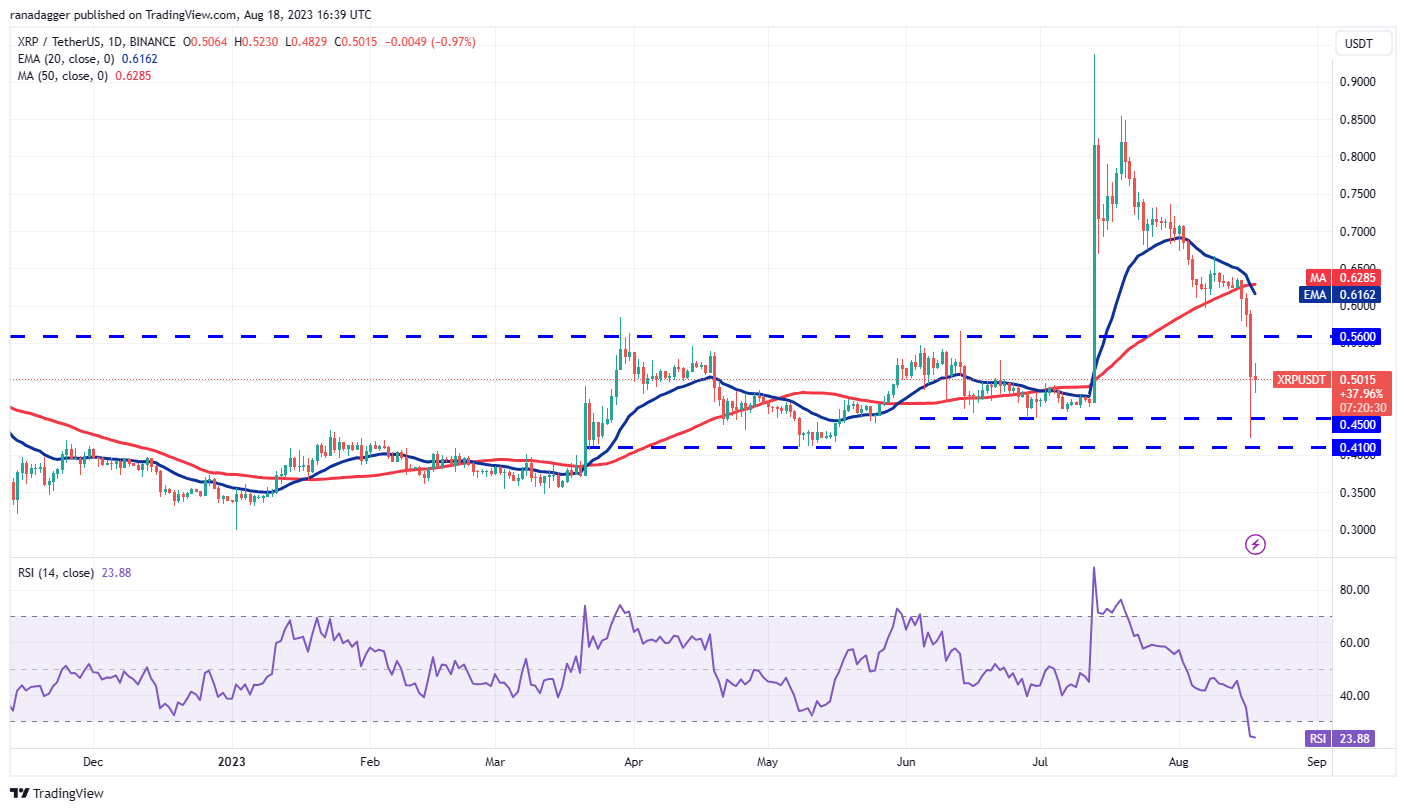
The recovery is likely to hit a roadblock at $0.56 and again at the 20-day EMA ($0.61). If the price turns down from this overhead zone, it will signal that bears are selling on rallies. That may put the $0.41 support at risk of breaking down.
Cardano price analysis
Cardano (ADA) dropped below the descending channel pattern on Aug. 17, indicating that the selling has accelerated.
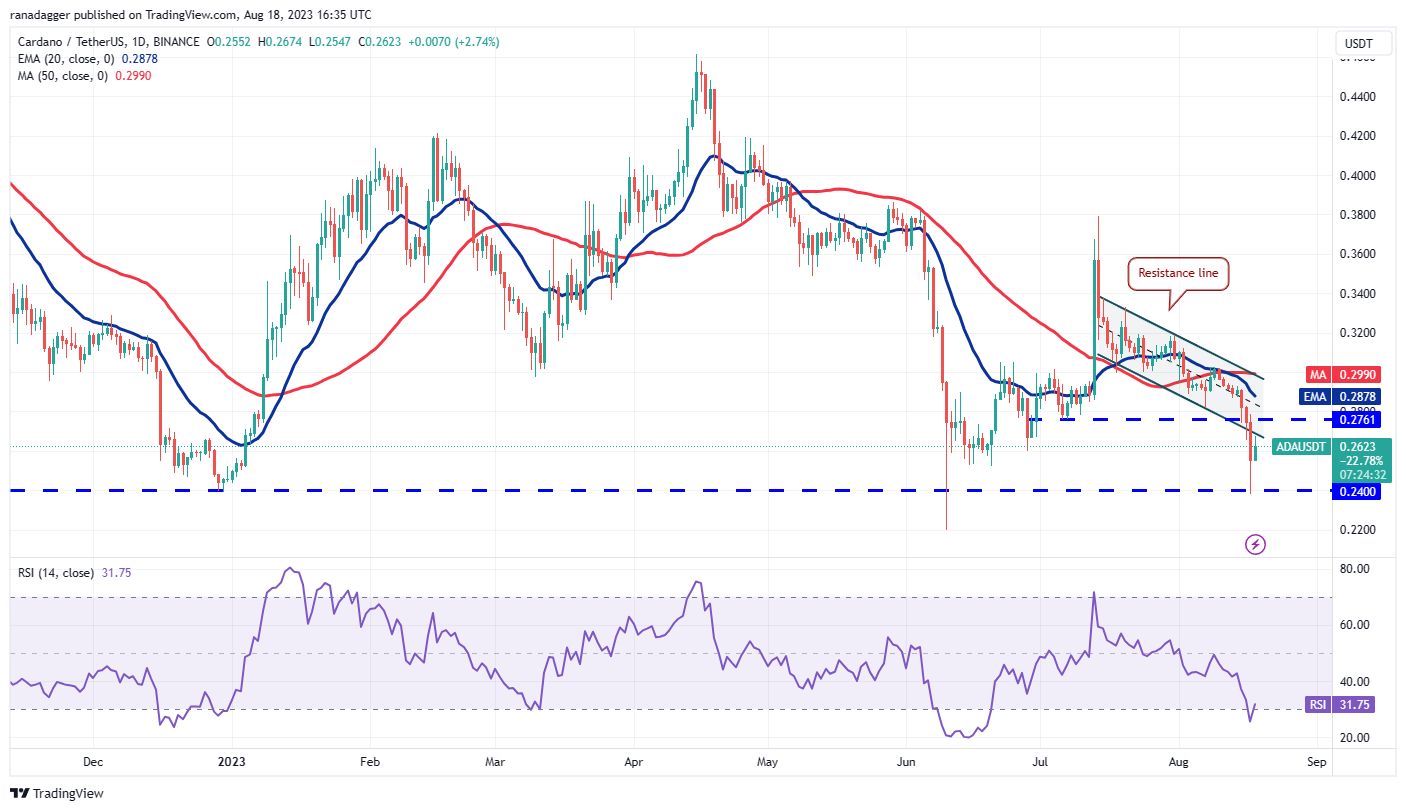
The rise may not be easy because the bulls are likely to face selling at the 20-day EMA ($0.28). If the price turns down from this level, the pair may again retest the strong support at $0.24. A break below this level will signal the resumption of the downtrend.
Solana price analysis
Solana (SOL) broke below the moving averages on Aug. 16 and the horizontal support at $22.30 on Aug. 17. This suggests that the price may oscillate inside the large range between $27.12 and $14 for some time.
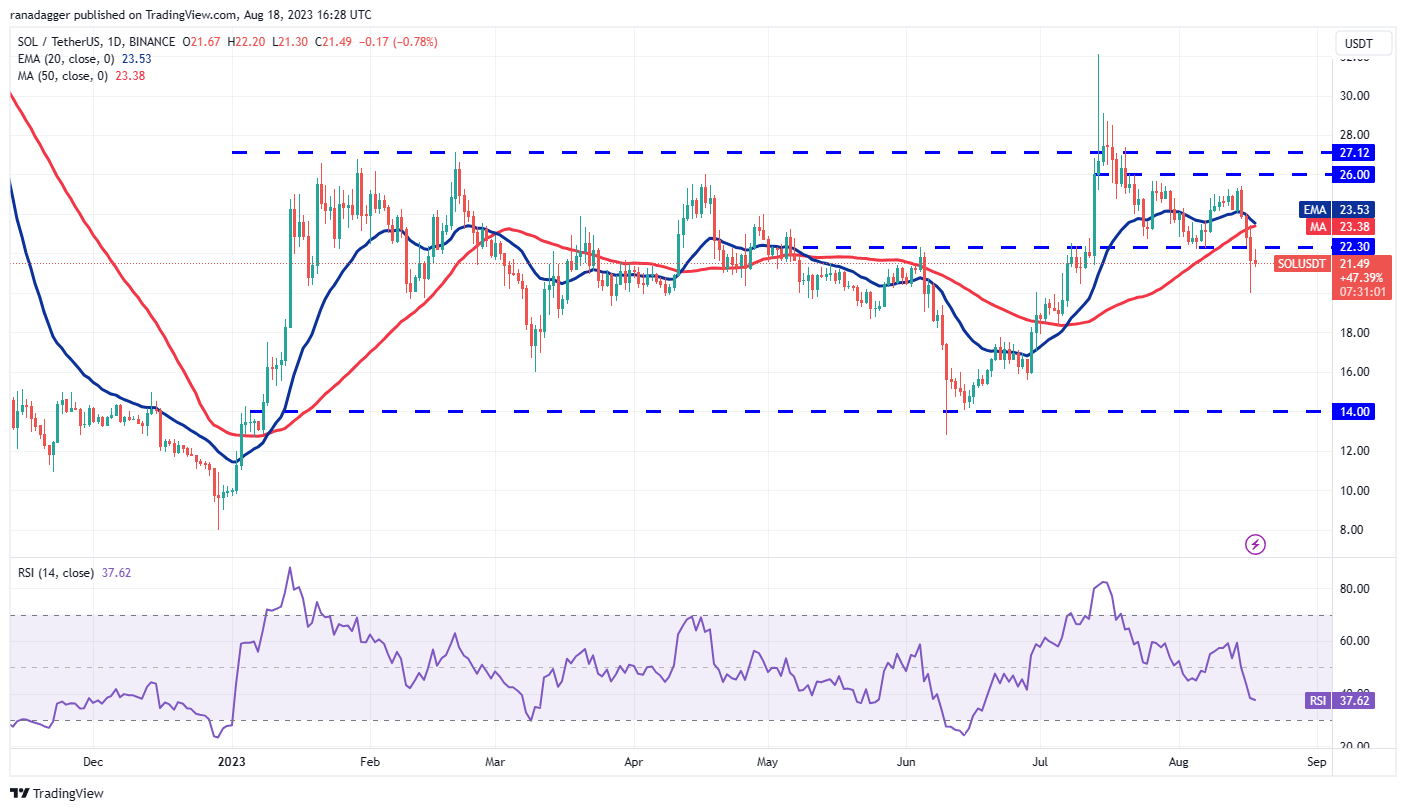
On the contrary, if buyers drive the price above the moving averages, it will suggest that the break below $22.30 may have been a bear trap. That could propel the SOL/USDT pair toward the $26 to $27.12 overhead zone.
Dogecoin price analysis
Dogecoin (DOGE) slipped below the support line of the ascending channel pattern on Aug. 15. That may have hit stops on the long positions and attracted selling by the bears.
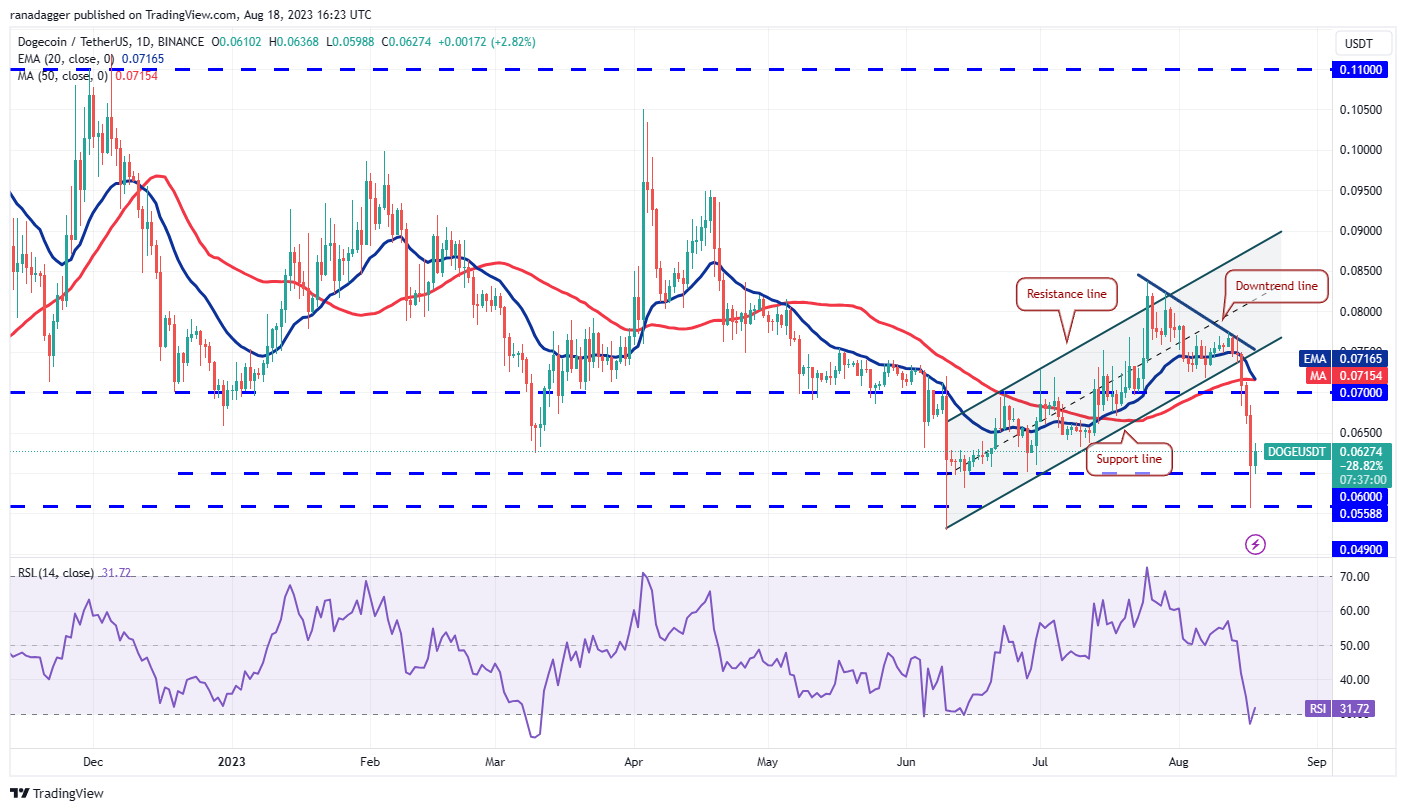
The price rose back above $0.06 and the bulls will attempt to push the price toward the overhead resistance of $0.07.
Sellers are likely to have other plans. They will try to sink and sustain the price below $0.06. If they do that, the pair may plummet toward $0.05.
Related: SpaceX Bitcoin write-down sparks confusion, Bitcoiners quiz Elon Musk
Polkadot price analysis
The tight range trading in Polkadot (DOT) expanded to the downside on Aug. 15. That started a decline, which reached near the critical support at $4.22 on Aug. 17.
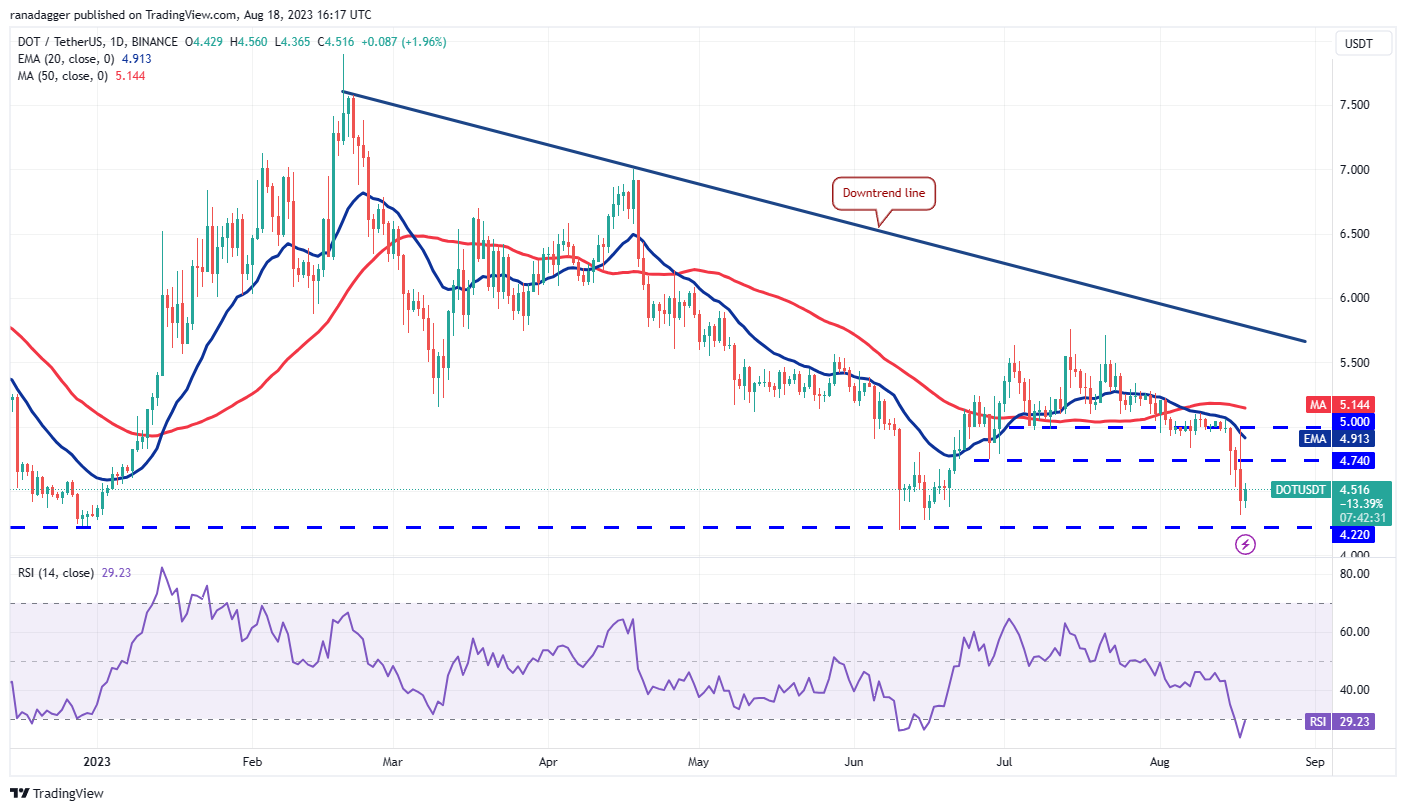
Alternatively, if the price turns down from the 20-day EMA but rebounds off $4.22, it will suggest that the pair may consolidate for a few days. The bulls will gain momentum after the price rises above the moving averages.
Polygon price analysis
Polygon’s (MATIC) break below the $0.65 support attracted aggressive selling, which tugged the price below the next strong support at $0.60 on Aug. 17.
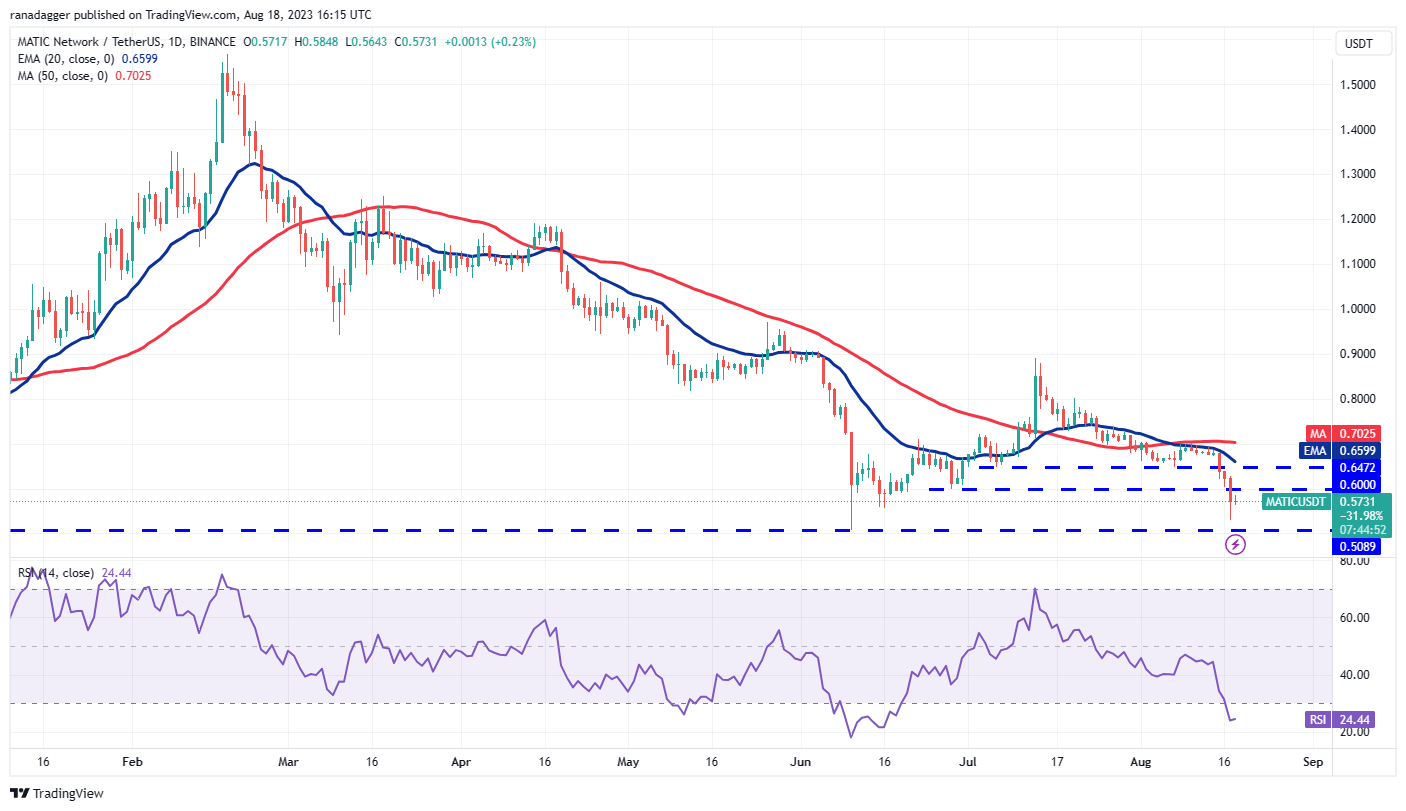
If this support gives way, the pair could slip to $0.45 and then to $0.42. On the upside, the bulls will have to kick the price above the moving averages, to indicate that the downtrend could be ending.
Litecoin price analysis
Litecoin (LTC) went into a tailspin after breaking below the support at $81 on Aug. 15. The price crumbled to $56 on Aug. 17.
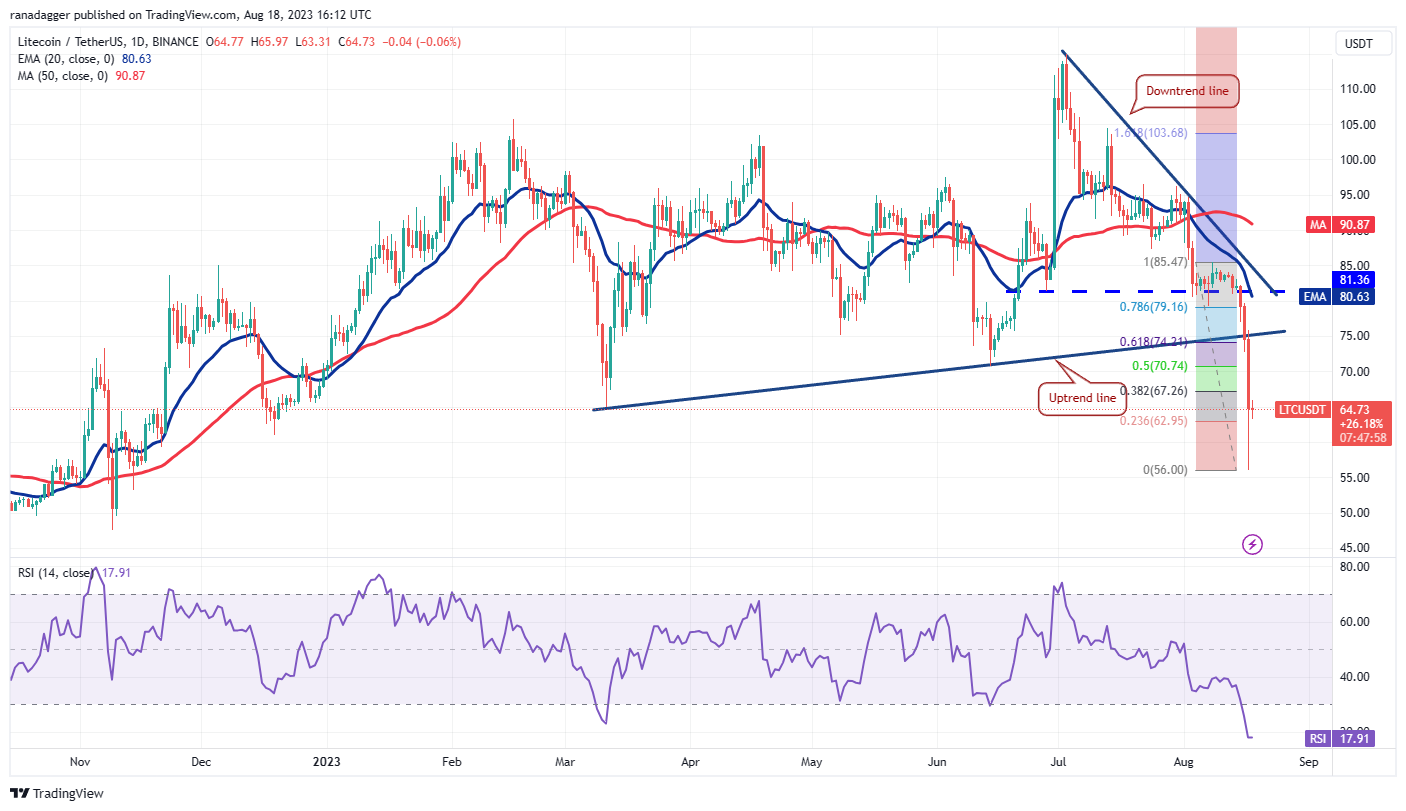
If the price turns down from the overhead resistance, the LTC/USDT pair could form a range for a few days. A break and close below the pivotal level of $56 could extend the decline to $50.
This article does not contain investment advice or recommendations. Every investment and trading move involves risk, and readers should conduct their own research when making a decision.

Leave A Comment