
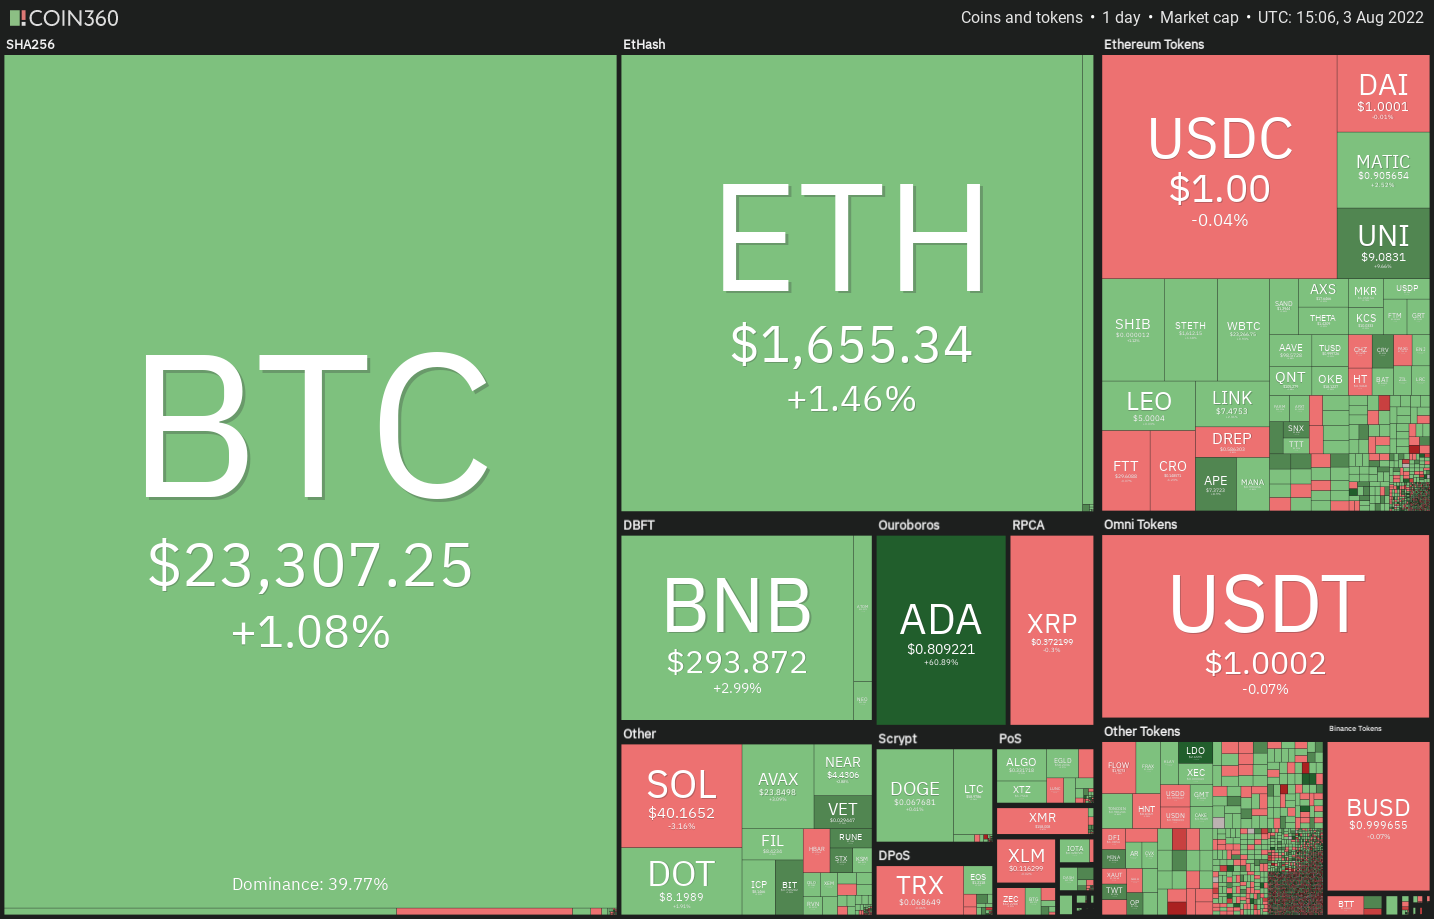
Bitcoin (BTC) and altcoins are tracking the United States equities markets higher on Aug. 3 as traders buy the dip.
Smaller investors seem to be making the most of the bear market in Bitcoin as the number of wholecoiners has soared by 40,000 since the sharp fall in June. In comparison, wallet addresses with more than 1,000 Bitcoin have declined by 113 since May.
Some analysts believe that Bitcoin has not yet formed a macro bottom, however. Trading firm QCP Capital expects Bitcoin to gradually rise for most of the third quarter amid high volatility.
They believe Bitcoin’s rally could hit a roof around $28,700. For the long-term, the firm did not rule out a final capitulation in Bitcoin to around $10,000, which may mark a bottom for the bear market.
Could Bitcoin and altcoins resume their up-move or will the recovery falter at higher levels? Let’s study the charts of the top-10 cryptocurrencies to find out.
BTC/USDT
Bitcoin dropped to the 20-day exponential moving average ($22,632) on Aug. 2, which is acting as strong support. The gradually up-sloping 20-day EMA and the relative strength index (RSI) in the positive territory suggest that bulls have a slight edge.
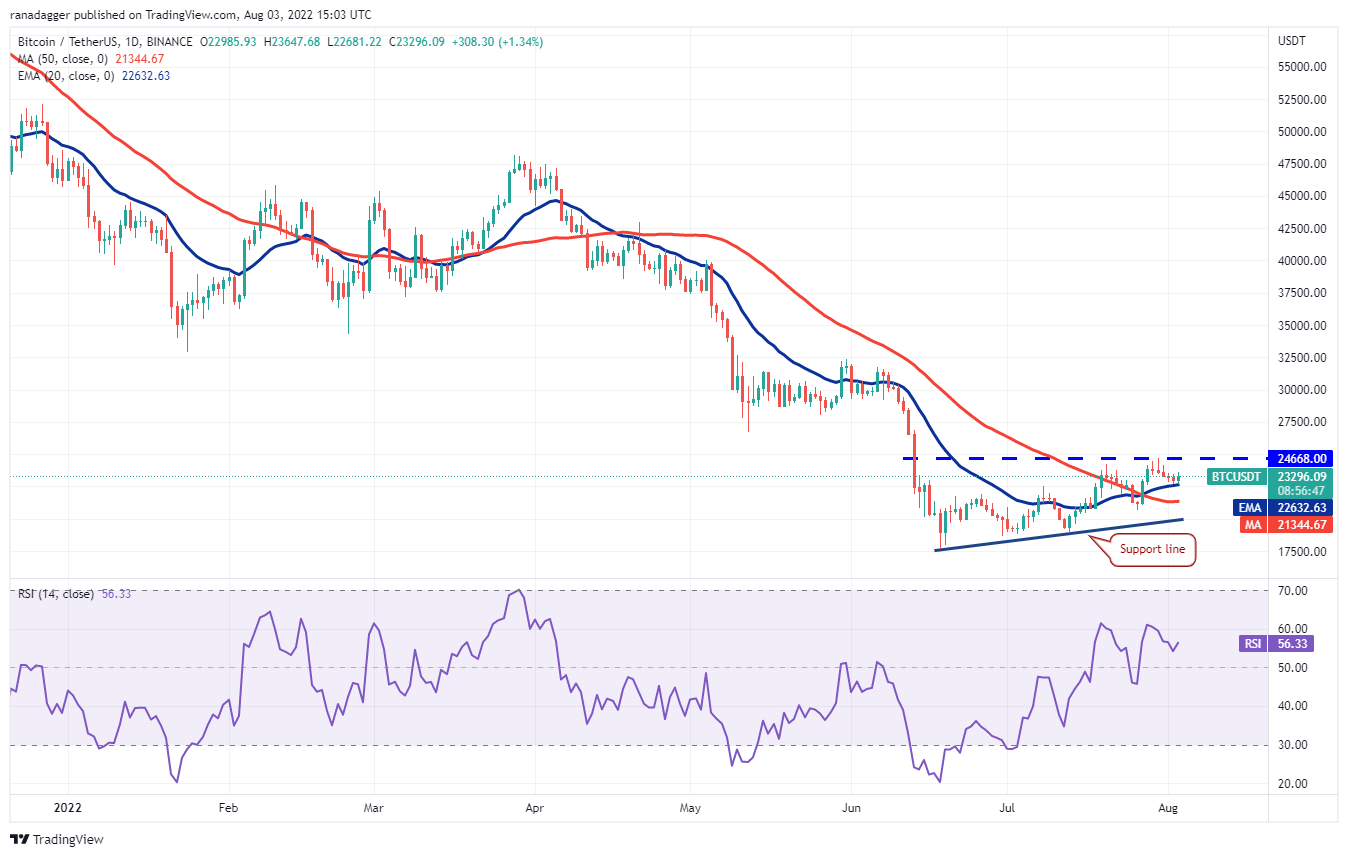
Contrary to this assumption, if the price turns down from the current level or the overhead resistance, it will suggest that higher levels continue to attract selling from the bears. A break and close below the 20-day EMA could sink the pair to the 50-day simple moving average ($21,344) and then to the support line.
ETH/USDT
Ether (ETH) turned down and dropped to the 20-day EMA ($1,545) on Aug. 2 but the long tail on the candlestick suggests that the bulls aggressively purchased the dip.
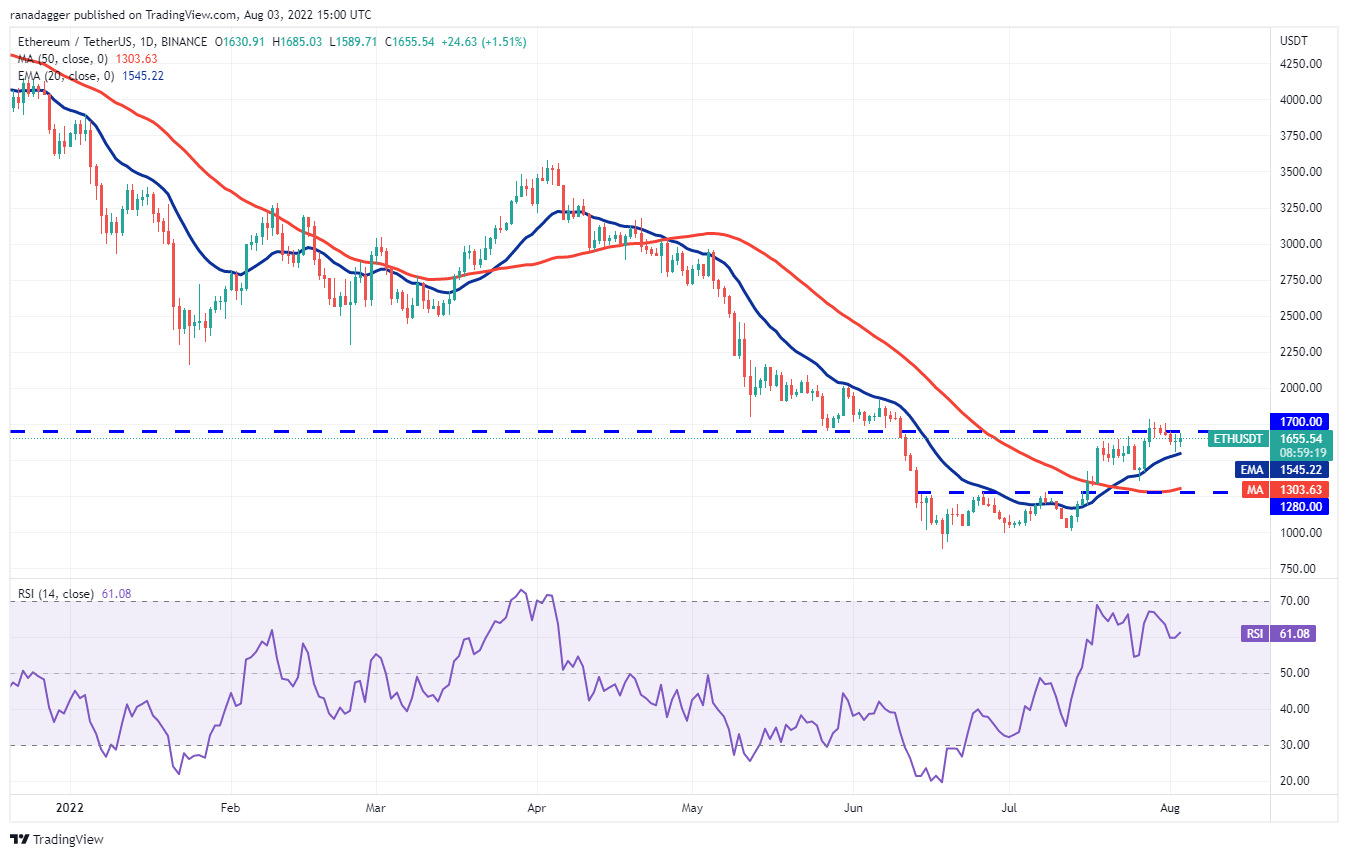
To invalidate this bullish view, the bears will have to sink and sustain the price below the 20-day EMA. That could open the doors for a decline to the strong support at $1,280. A bounce off this level could keep the pair stuck between $1,280 and $1,700 for a few days.
BNB/USDT
Binance Coin (BNB) bounced off the $275 support on Aug. 2, indicating that the sentiment has turned positive and traders are buying on dips.
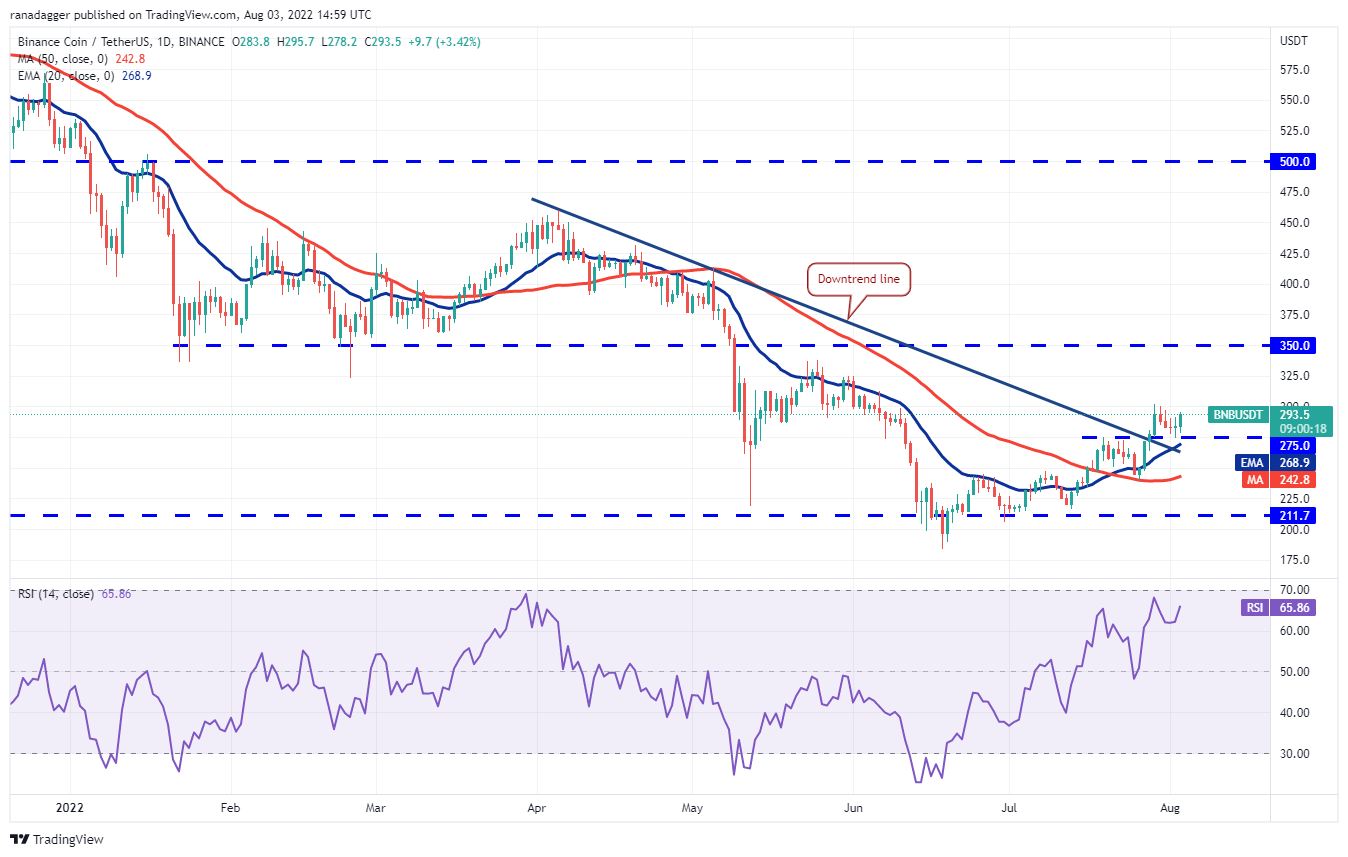
The rising 20-day EMA ($268) and the RSI in the positive territory indicate that the path of least resistance is to the upside. This bullish view could invalidate in the near term if the price turns down and breaks below the 20-day EMA.
XRP/USDT
The long tail on XRP’s Aug. 3 candlestick indicates that bulls are attempting to defend the 20-day EMA ($0.36). The gradually up-sloping 20-day EMA and the RSI in the positive territory indicate a slight advantage to buyers.
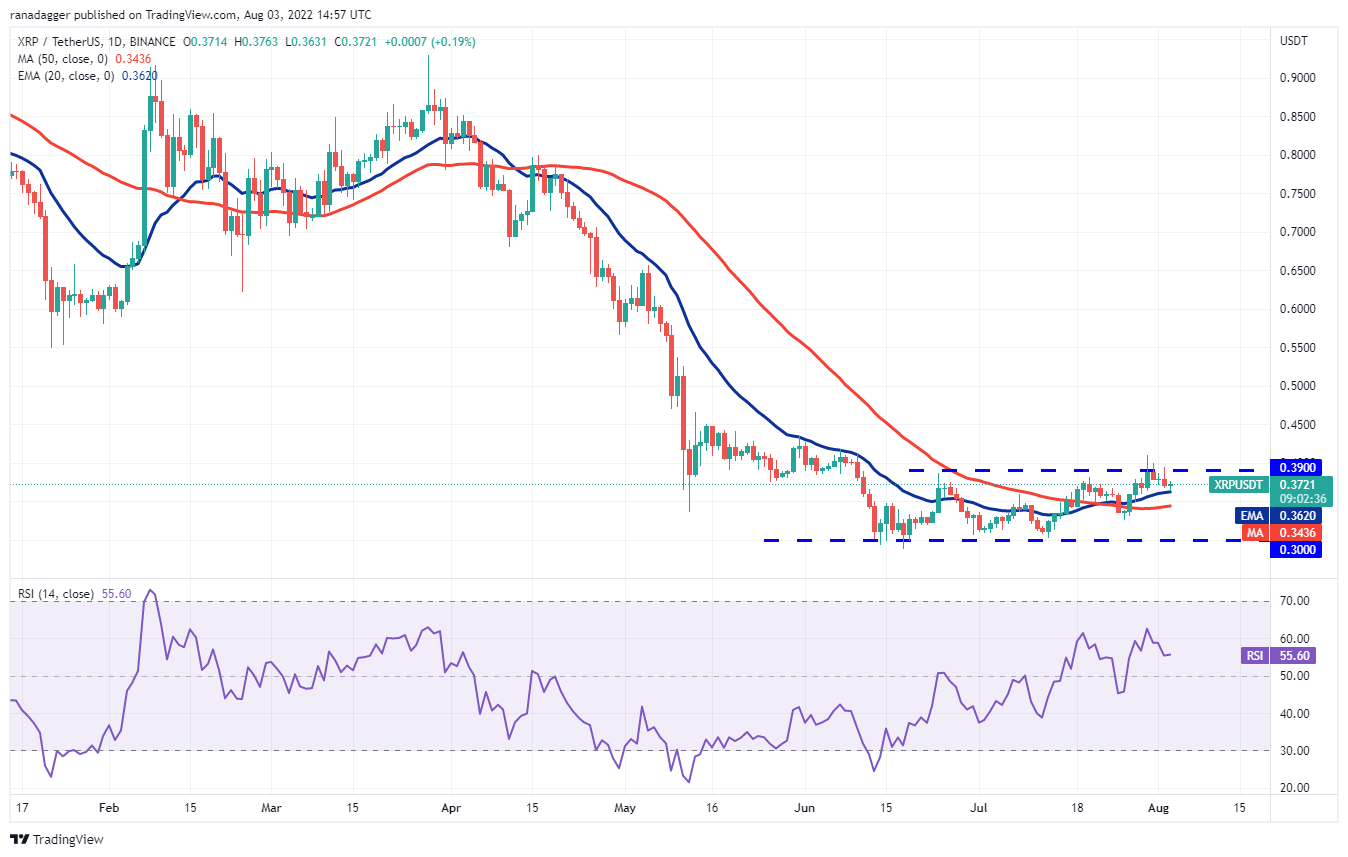
Contrary to this assumption, if the price turns down from the current level or the overhead resistance, the possibility of a break below the 20-day EMA increases. If that happens, the pair may continue its range-bound action for a few more days.
ADA/USDT
Cardano (ADA) has been stuck in a large range between $0.40 and $0.55 for the past few days. The bulls are currently attempting to defend the moving averages.
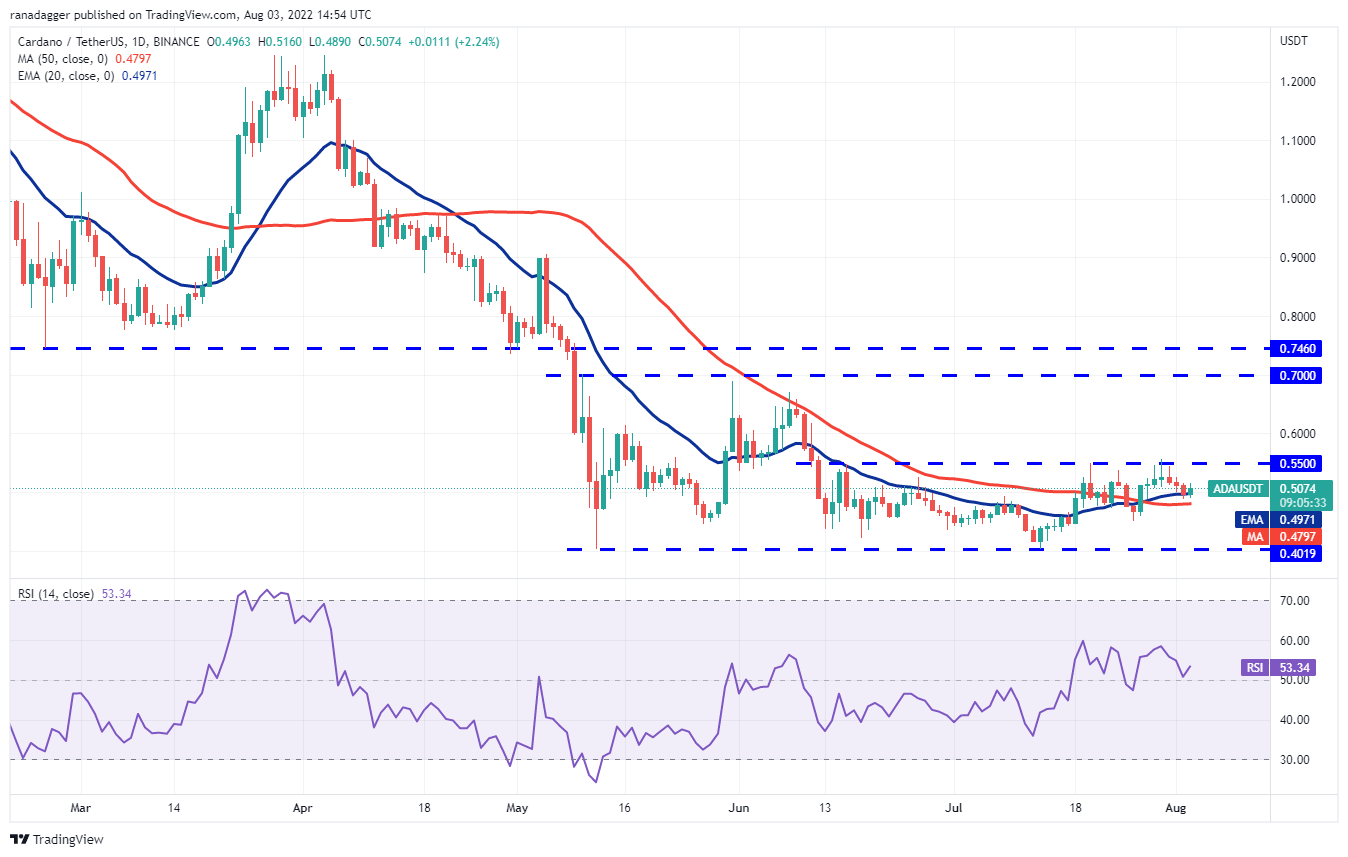
Alternatively, if the price breaks below the moving averages, the pair could slide to the immediate support at $0.45. A bounce off this level could form a new tighter range between $0.45 and $0.55 while a break below $0.45 could clear the path for a drop to $0.40.
SOL/USDT
Solana (SOL) dipped below the 20-day EMA ($40) on Aug. 2 and dropped to the 50-day SMA ($37) on Aug. 3. The long tail on the candlestick suggests that traders are defending the support line.
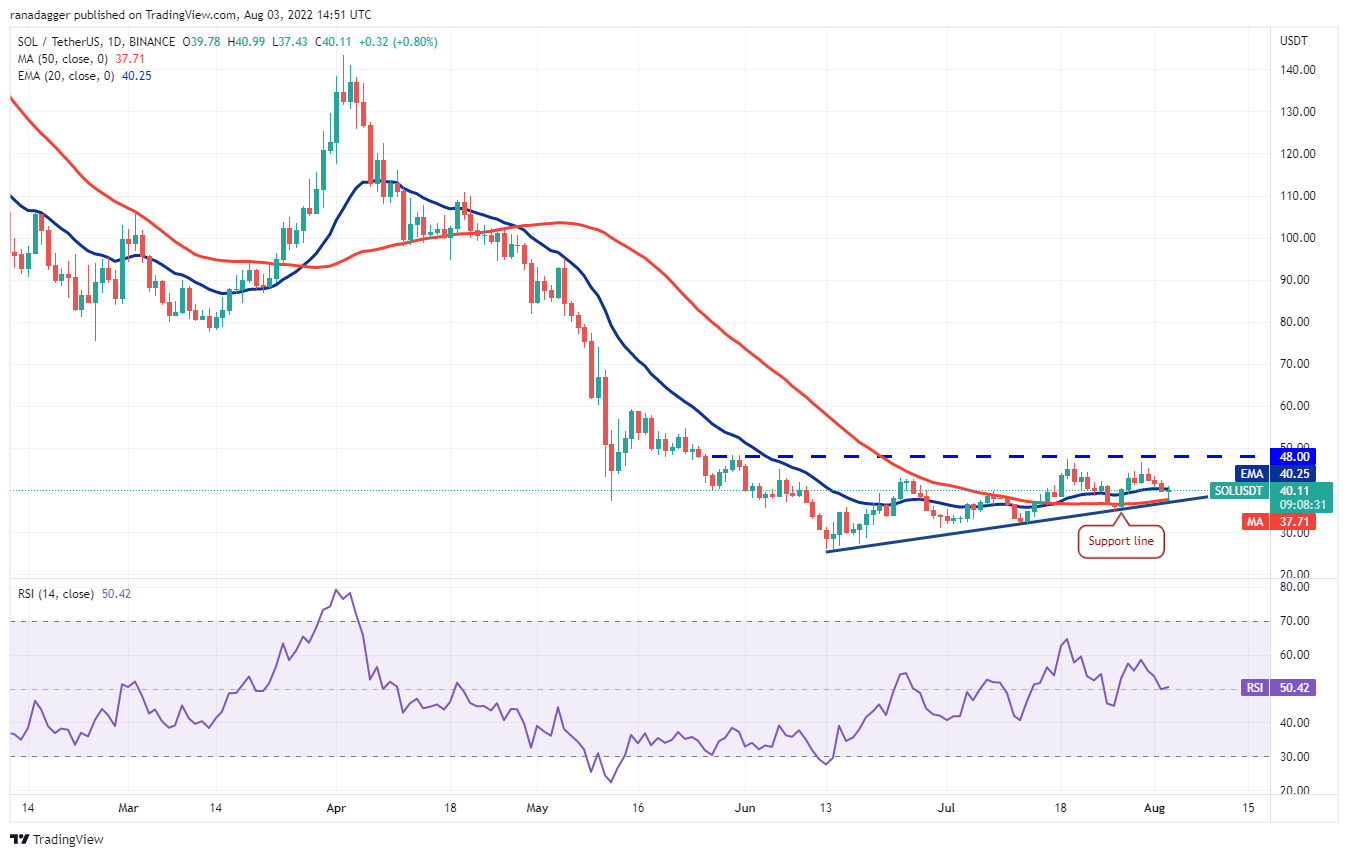
Conversely, if the rebound lacks strength, the bears will attempt to sink the pair below the support line. If they manage to do that, the bullish setup will be negated and the pair may slide to $31.
DOGE/USDT
The bulls are attempting to arrest Dogecoin’s (DOGE) pullback at the 50-day SMA ($0.07). If the rebound sustains above the 20-day EMA ($0.07), a retest of $0.08 is possible.
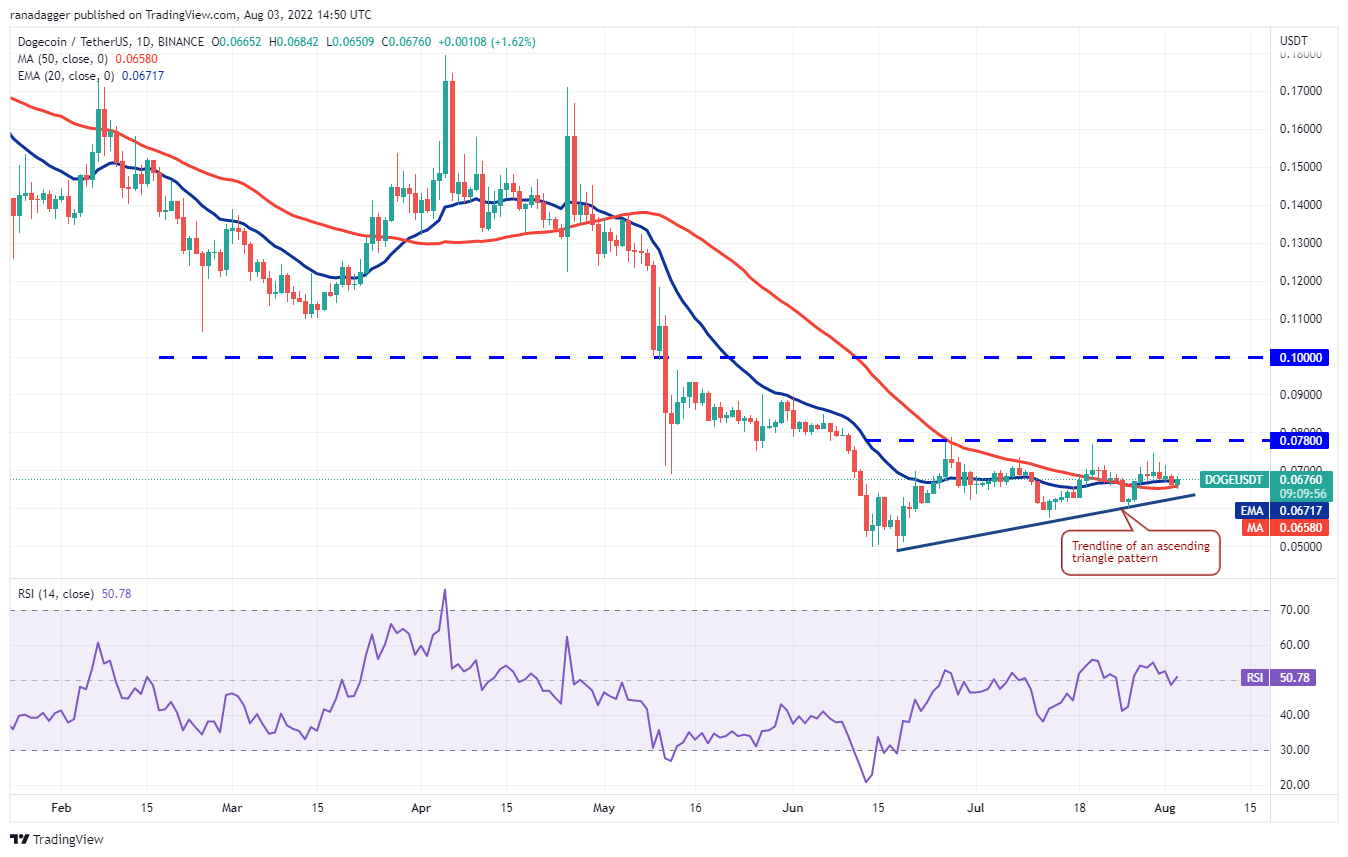
On the contrary, if the rebound lacks strength, it will suggest that demand dries up at higher levels. That could pull the price down to the trendline support. A break and close below this level could invalidate the bullish setup.
Related: Lido DAO: Ethereum’s biggest Merge staker just jumped 30% — will LDO rally into September?
DOT/USDT
Polkadot (DOT) turned down from the overhead resistance and dipped to the 20-day EMA ($7.70) where the bulls are trying to stall the pullback.
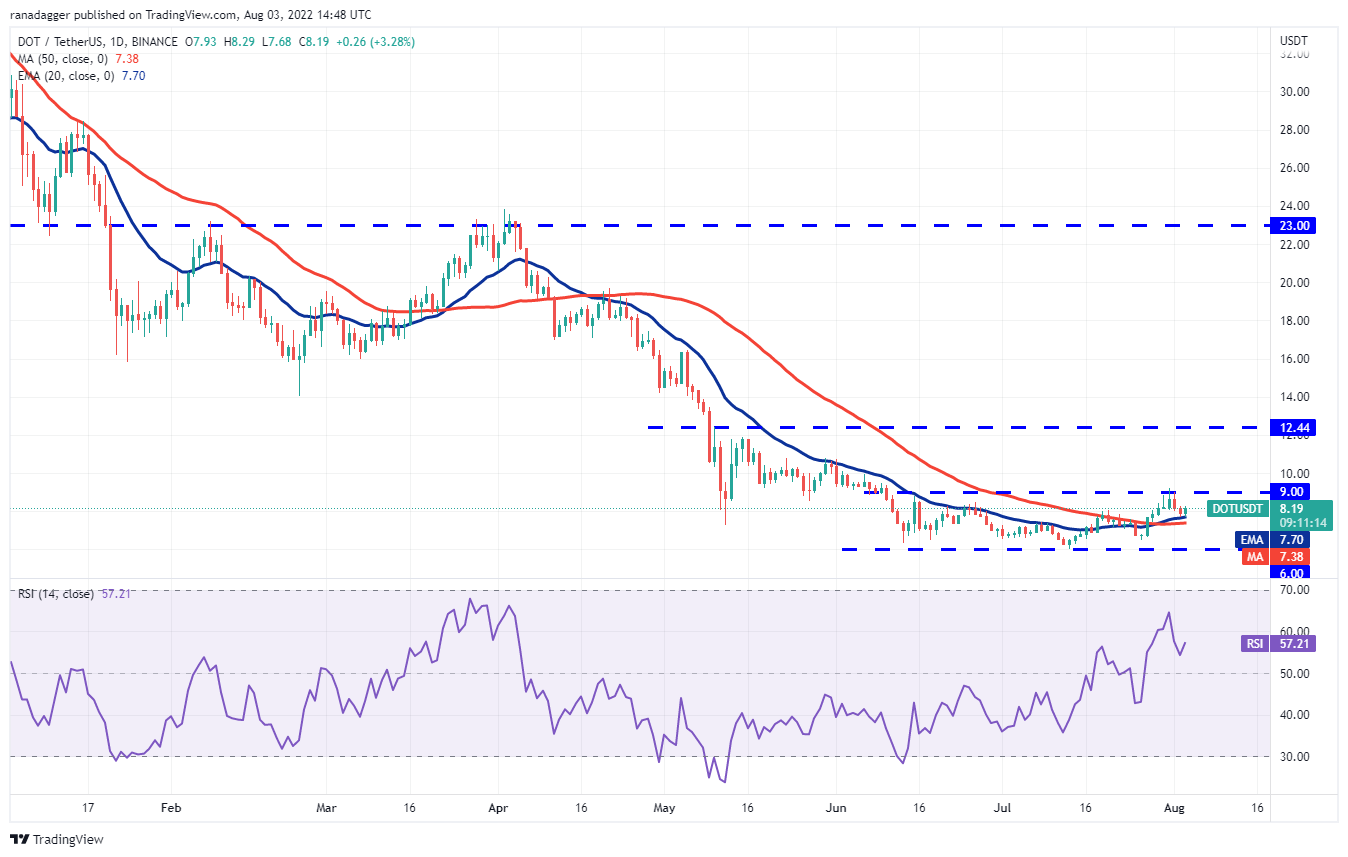
Alternatively, if the price turns down from the current level or the overhead resistance and breaks below the moving averages, it will suggest that the pair may extend its stay inside the range between $6 and $9 for a few more days.
MATIC/USDT
Polygon (MATIC) bounced off the 20-day EMA ($0.84) on Aug. 2, indicating that bulls are buying on dips. The price could next retest the $0.98 to $1.01 overhead resistance zone.
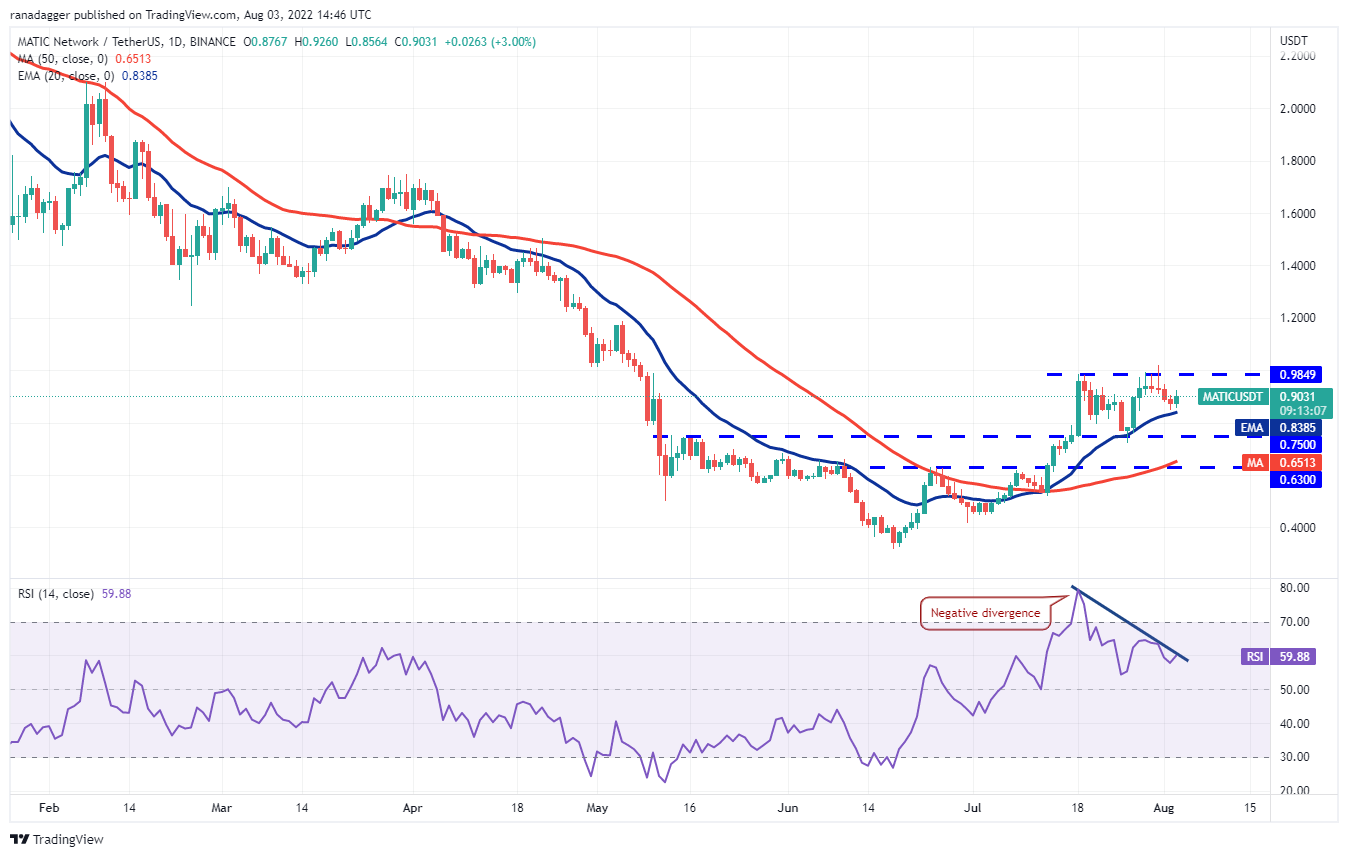
On the contrary, if the price turns down and breaks below the 20-day EMA, the pair could drop to the strong support at $0.75. A sharp rebound off this level could keep the pair range-bound between $0.75 and $1 for a few days.
AVAX/USDT
The bears tried to sink Avalanche (AVAX) below the 20-day EMA ($22.71) on Aug. 2 but the bulls held their ground. This indicates that traders are viewing the dips as a buying opportunity.
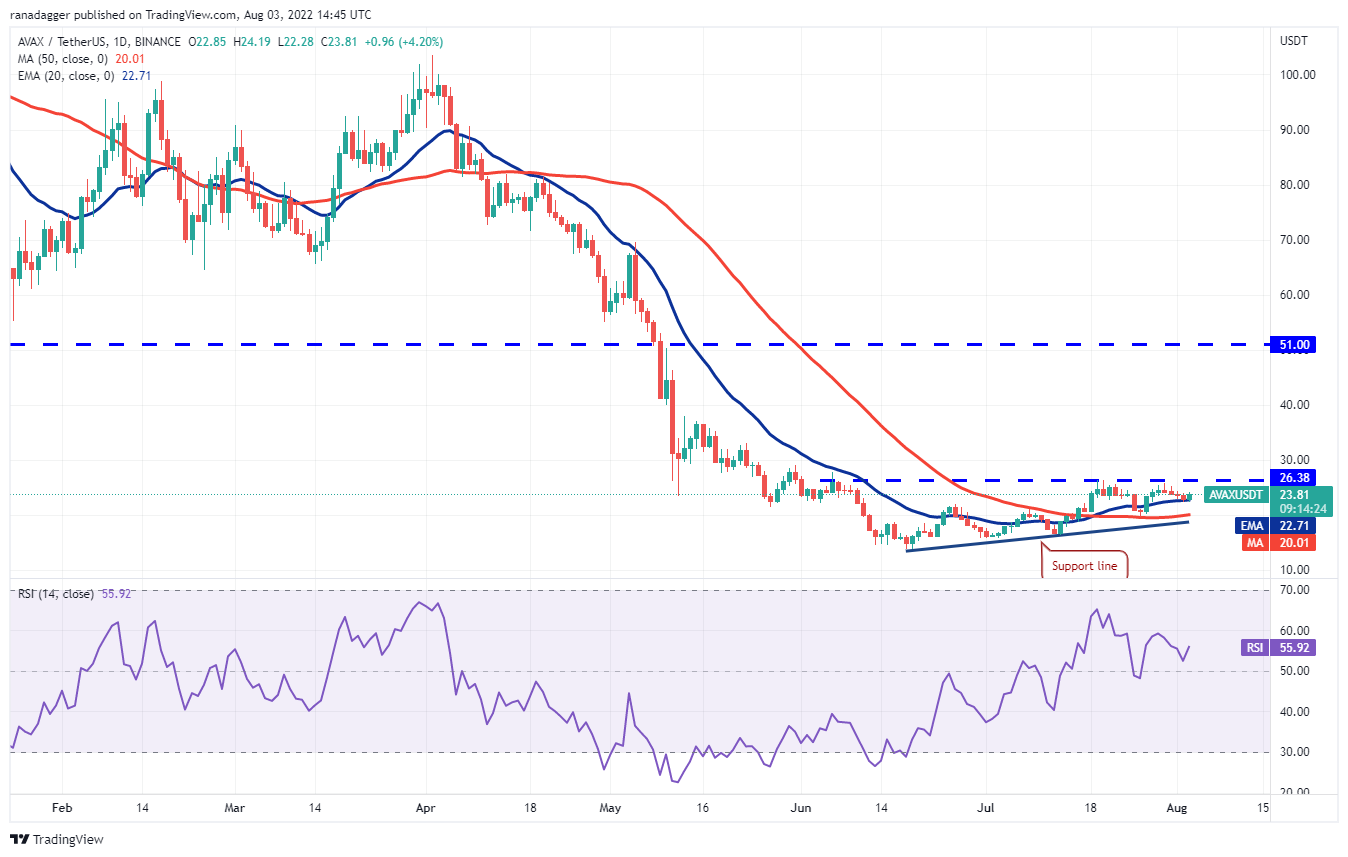
Contrary to this assumption, if the price turns down from the current level or the overhead resistance and breaks below the 20-day EMA, the pair could slide to the support line. This is an important level for the bulls to defend because a break and close below it could tilt the advantage in favor of the bears.
Market data is provided by HitBTC exchange.
The views and opinions expressed here are solely those of the author and do not necessarily reflect the views of Cointelegraph.com. Every investment and trading move involves risk, you should conduct your own research when making a decision.

Leave A Comment