
Bitcoin’s (BTC) volatility has increased over the past few days. The price soared on Aug. 29 after Grayscale scored a victory over the United States Securities and Exchange Commission (SEC). However, the euphoria was short-lived as the price gave back all the recent gains on the news that the SEC delayed the decision on all seven spot Bitcoin exchange-traded fund applications.
News related to Bitcoin ETFs has been the major trigger for the markets in the past few days. Bloomberg ETF analysts remain upbeat over the possibility of the ETFs being approved by the regulator in 2023. In an Aug. 30 post of X (formerly Twitter), Bloomberg senior ETF analyst Eric Balchunas bumped up the approval possibility of a spot Bitcoin ETF from 65% to 75%.

The weakness in Bitcoin is affecting several major altcoins, which have dropped close to their strong support levels. Will the decline extend further or is it time for a bounce to happen? Let’s study the charts of the top-10 cryptocurrencies to find out.
Bitcoin price analysis
The bulls failed to defend the 20-day exponential moving average ($26,947) on Aug. 31. That started a sell-off which pulled Bitcoin below the breakout level of $26,833.

If bears want to seize control, they will have to sink and sustain the price below $24,800. If that happens, the pair may extend the fall to $19,500. There is a minor support at $24,000 but that may not hold for long.
Ether price analysis
Ether’s (ETH) rebound off the strong support at $1,626 fizzled out at $1,745 on Aug. 29. This indicates that bears remain active at higher levels.

Alternatively, if the price sharply rebounds off the current level, it will indicate that the bulls are fiercely defending the support. That could drive the price to the 20-day EMA ($1,702) and subsequently to $1,745 which may act as a resistance.
BNB price analysis
BNB’s (BNB) recovery halted at the 50-day SMA ($234) on Aug. 29 and the bears yanked the price below the important support at $220 on Aug. 31.

If bulls want to start a relief rally, they will have to push the price back above the 20-day EMA ($222). The pair could then climb to the 50-day SMA and later to the resistance line.
XRP price analysis
The long tail on XRP’s (XRP) Aug. 31 candlestick shows that the bulls are trying to protect the support at $0.50. However, the price action on Sep. 1 shows that the bears are keeping up the pressure.
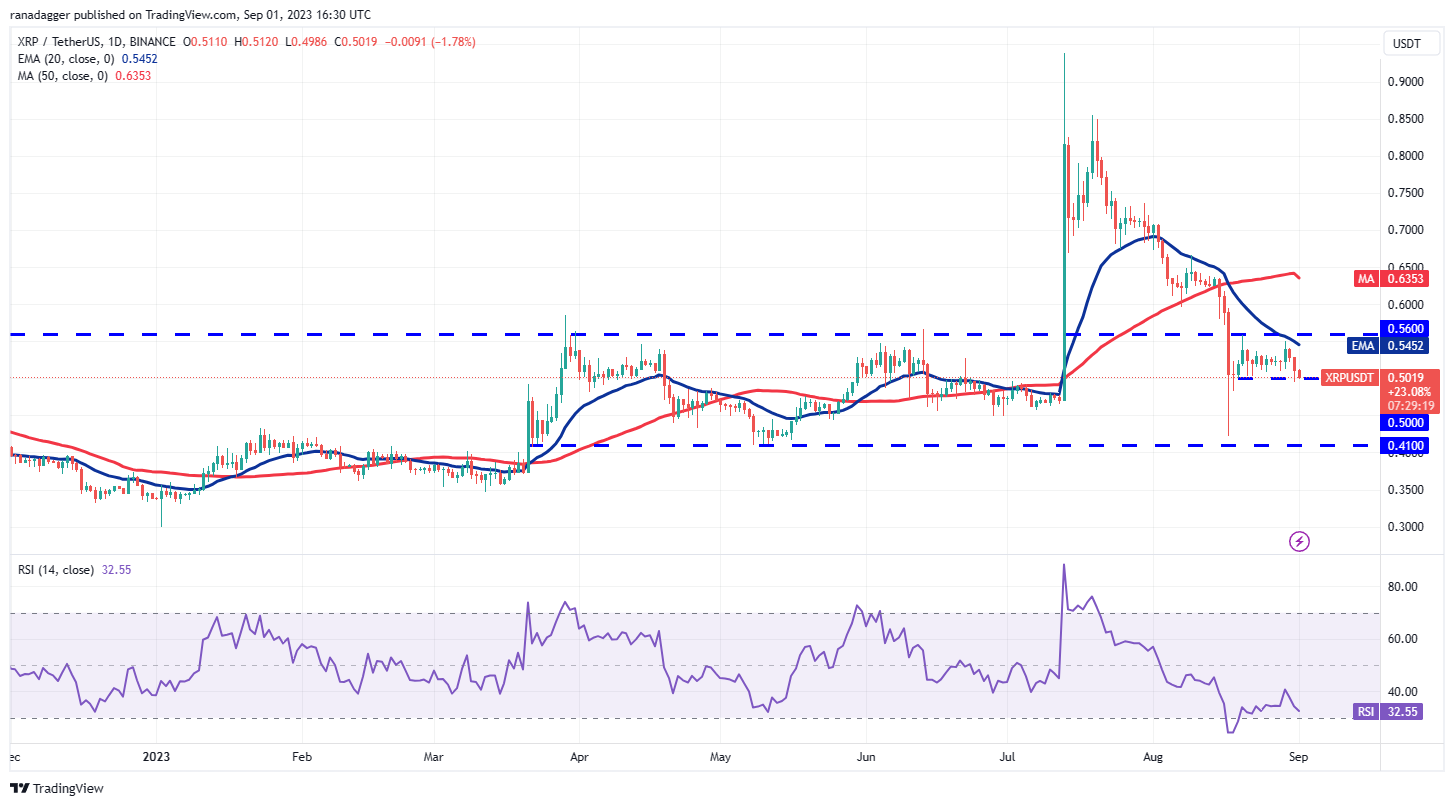
If the price rebounds off $0.50, it will suggest that the pair may attempt a rally to $0.56. The bulls will have to overcome this roadblock to start a new up-move to $0.63 and thereafter to $0.73.
Cardano price analysis
Cardano (ADA) has been range-bound between $0.28 and $0.24 for the past several days. The bulls kicked the price above the range on Aug. 29 but could not sustain the higher levels.

If the price rebounds off $0.24, the pair may continue to consolidate inside the range for a while longer. On the contrary, if the price dips below $0.24, it will signal the start of a down move to $0.22 and eventually to $0.20.
Dogecoin price analysis
The bulls are struggling to start a recovery in Dogecoin (DOGE), indicating that demand dries up at higher levels.
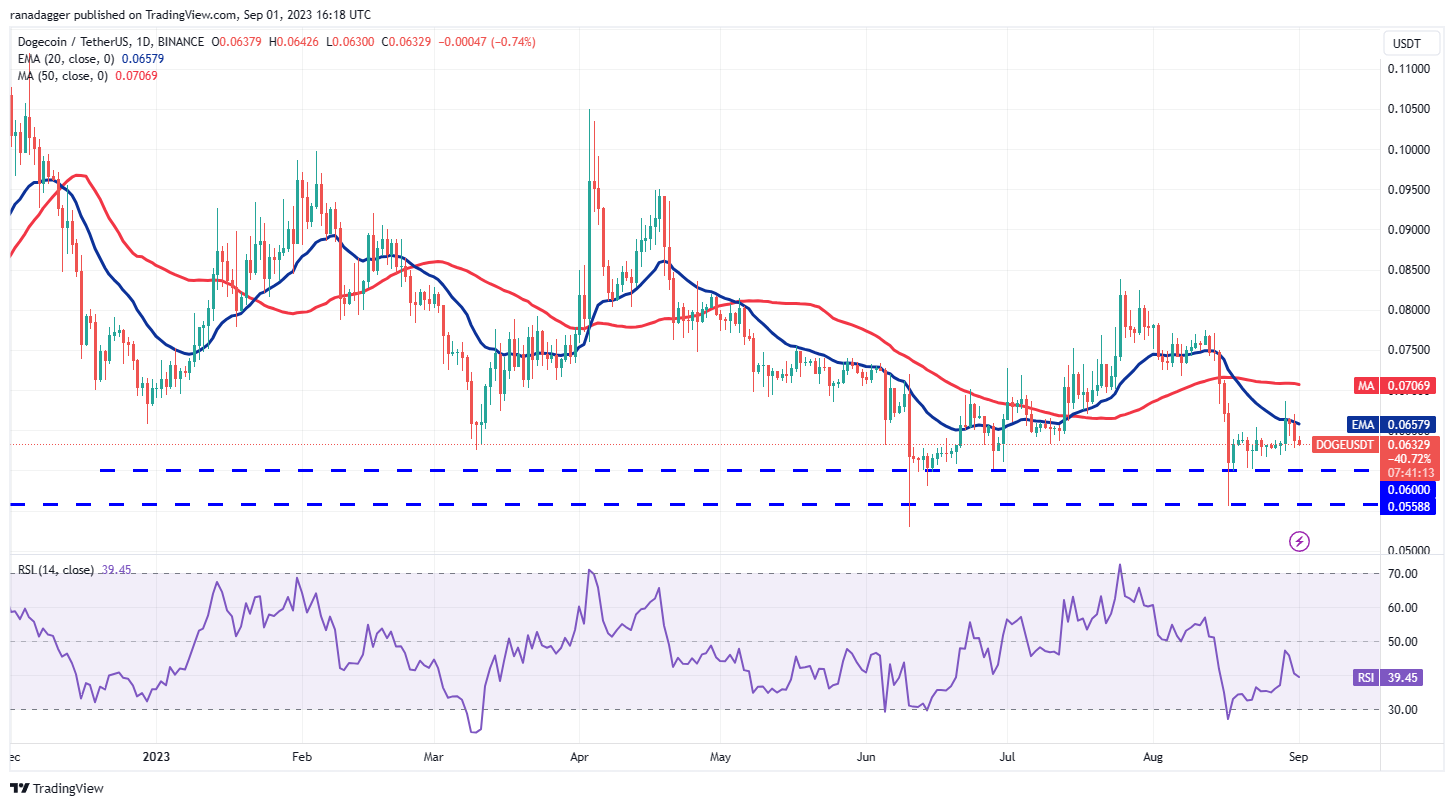
On the contrary, if the price rebounds off $0.06, it will signal that the bulls are buying the dips to this level. The bulls will then again try to overcome the obstacle at the 20-day EMA. If they succeed, the pair may surge to $0.08.
Solana price analysis
Solana (SOL) returned from the 20-day EMA ($21.37) on Aug. 30, which shows that bears remain in command. The price has reached the vital support at $19.35.
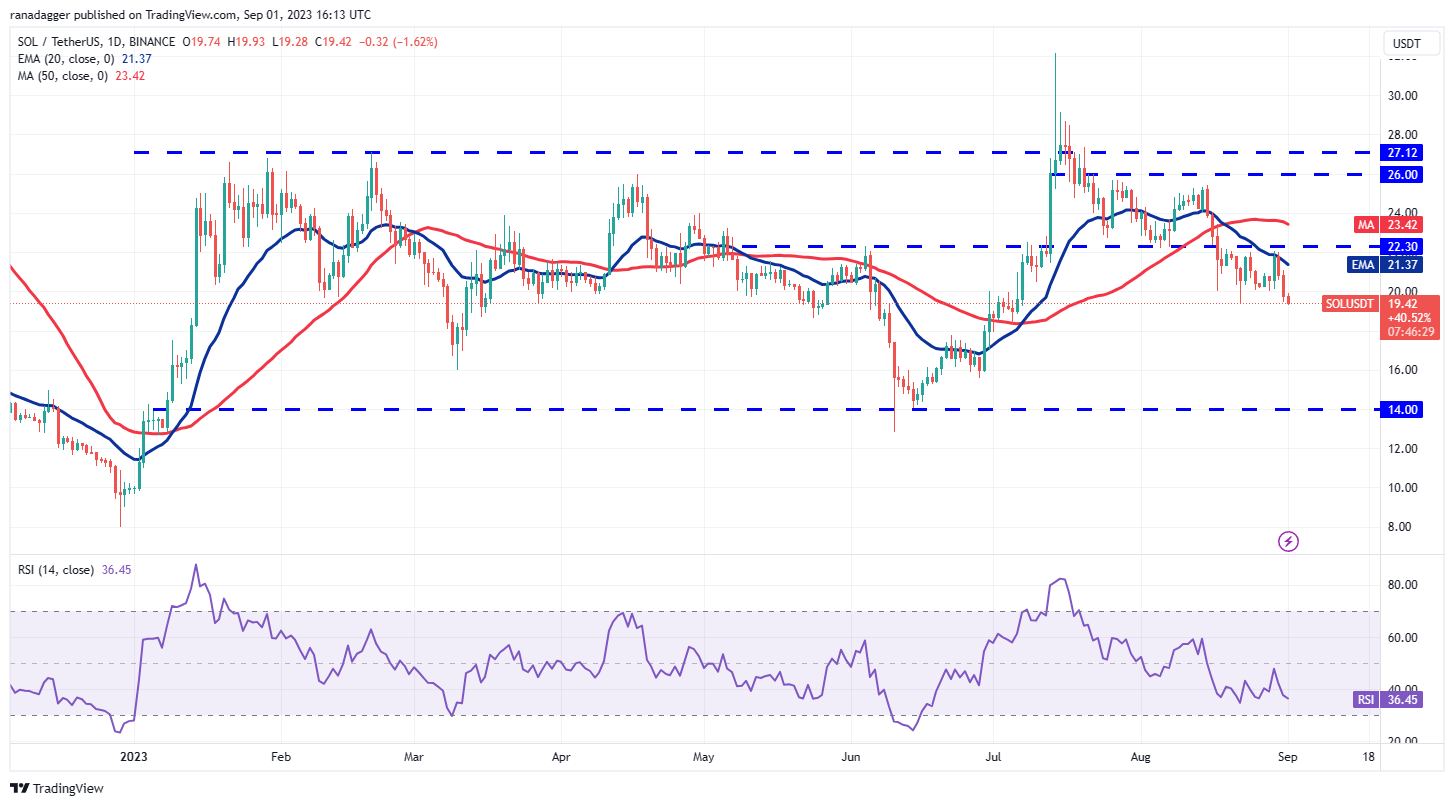
Time is running out for the bulls. If they want to start a recovery, they will have to quickly shove the price above the overhead resistance at $22.30. If they do that, the pair may soar toward $26. The 50-day SMA ($23.42) may act as a hurdle but it is likely to be crossed.
Related: Bitcoin lines up RSI showdown as BTC price slips toward new 2-week low
Toncoin price analysis
Toncoin (TON) is in a strong uptrend. The bears tried to stall the rally near $1.77 but the bulls did not give up much ground. That shows that the bulls are in no hurry to book profits.
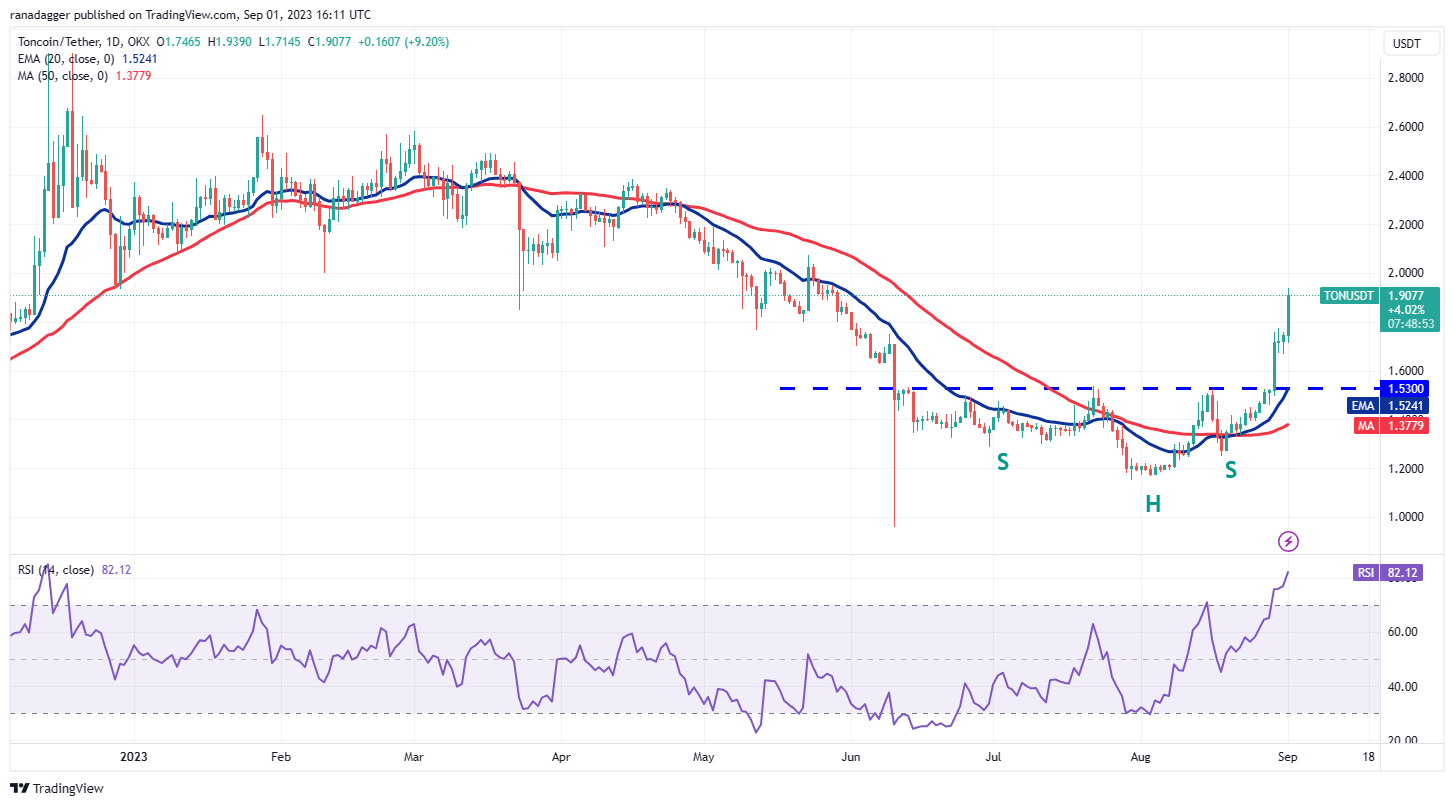
This bullish view will be invalidated if the price turns down and breaks below $1.66. Such a move will suggest aggressive selling at higher levels. That could then sink the pair to the breakout level of $1.53.
Polkadot price analysis
Polkadot (DOT) turned down from the 20-day EMA ($4.56) on Aug. 30, indicating that the sentiment remains negative and traders are selling on rallies.

Buyers have their tasks cut out. If they want to make a comeback, they will have to quickly drive and sustain the price above the 20-day EMA. If they manage to do that, the pair could surge to the overhead resistance at $5.
Polygon price analysis
Polygon’s (MATIC) failure to maintain above the 20-day EMA ($0.58) on Aug. 29 may have attracted profit-booking from short-term traders. The bulls tried to push the price back above the 20-day EMA on Aug. 30 and 31 but the bears held their ground.
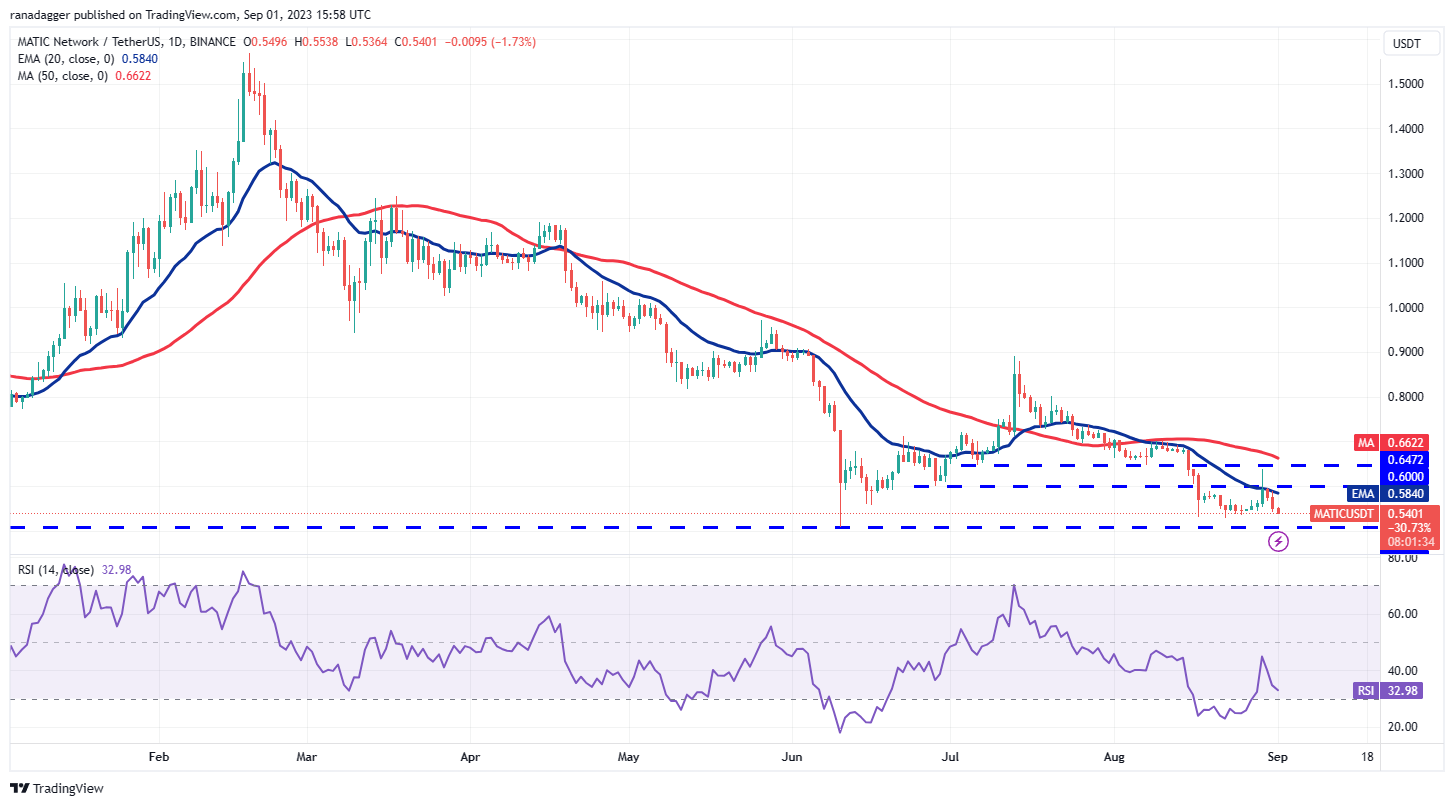
If the price turns up from the current level, it is likely to face selling at the 20-day EMA and again at the 50-day SMA ($0.66). On the other hand, a break below $0.51 could resume the downtrend. The next support is at $0.45.
This article does not contain investment advice or recommendations. Every investment and trading move involves risk, and readers should conduct their own research when making a decision.

Leave A Comment