
The Federal Reserve did not hike interest rates in its meeting on Sep. 20 but hinted that rates could remain higher for longer. At the post-meeting press conference, Fed Chair Jerome Powell cautioned that “the process of getting inflation sustainably down to 2% has a long way to go.”
This possible scenario may have triggered the sell-off in the United States equities markets and also in the cryptocurrency space. Risk assets typically tend to underperform in a high-interest-rate environment.
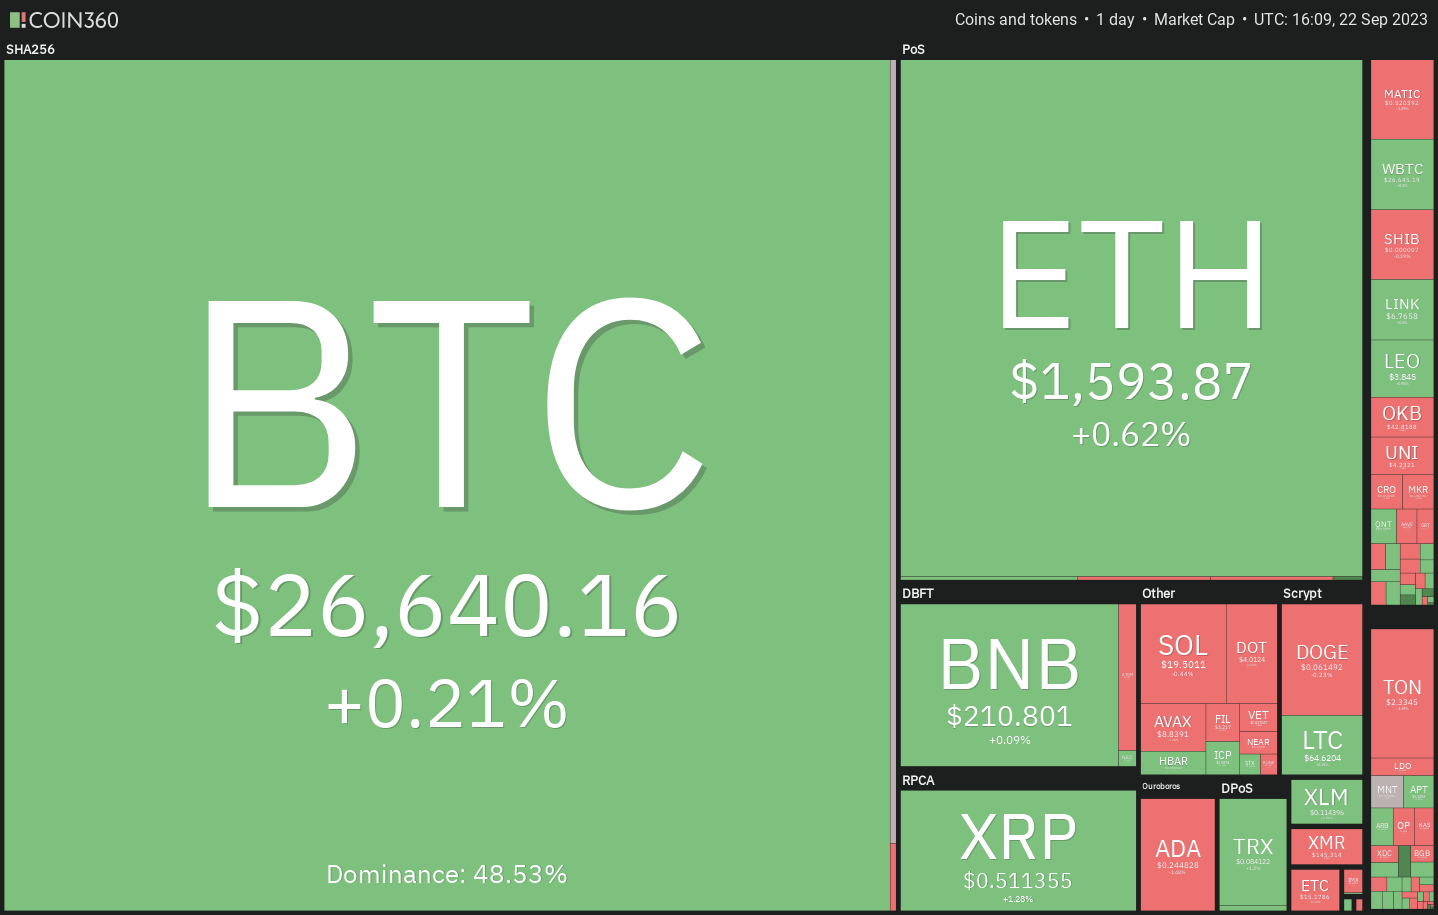
While the S&P 500 is down more than 2% and the Nasdaq about 3% this week, Bitcoin (BTC) has a remained flat.
Will bears seize the initiative and drag Bitcoin and the major altcoins lower or could buyers regroup and push prices higher? Let’s study the charts of the top 10 cryptocurrencies to find out.
Bitcoin price analysis
Bitcoin has been trading between the moving averages for the past few days. This tight-range trading indicates indecision between the bulls and the bears about the next directional move.

In contrast, if the price plummets below the 20-day EMA, it will suggest that the bears are back in command. That will increase the possibility of a retest of the pivotal support at $24,800.
Ether price analysis
Ether (ETH) turned down from the 20-day EMA ($1,628) on Sep. 20, indicating that the bears continue to sell on rallies.
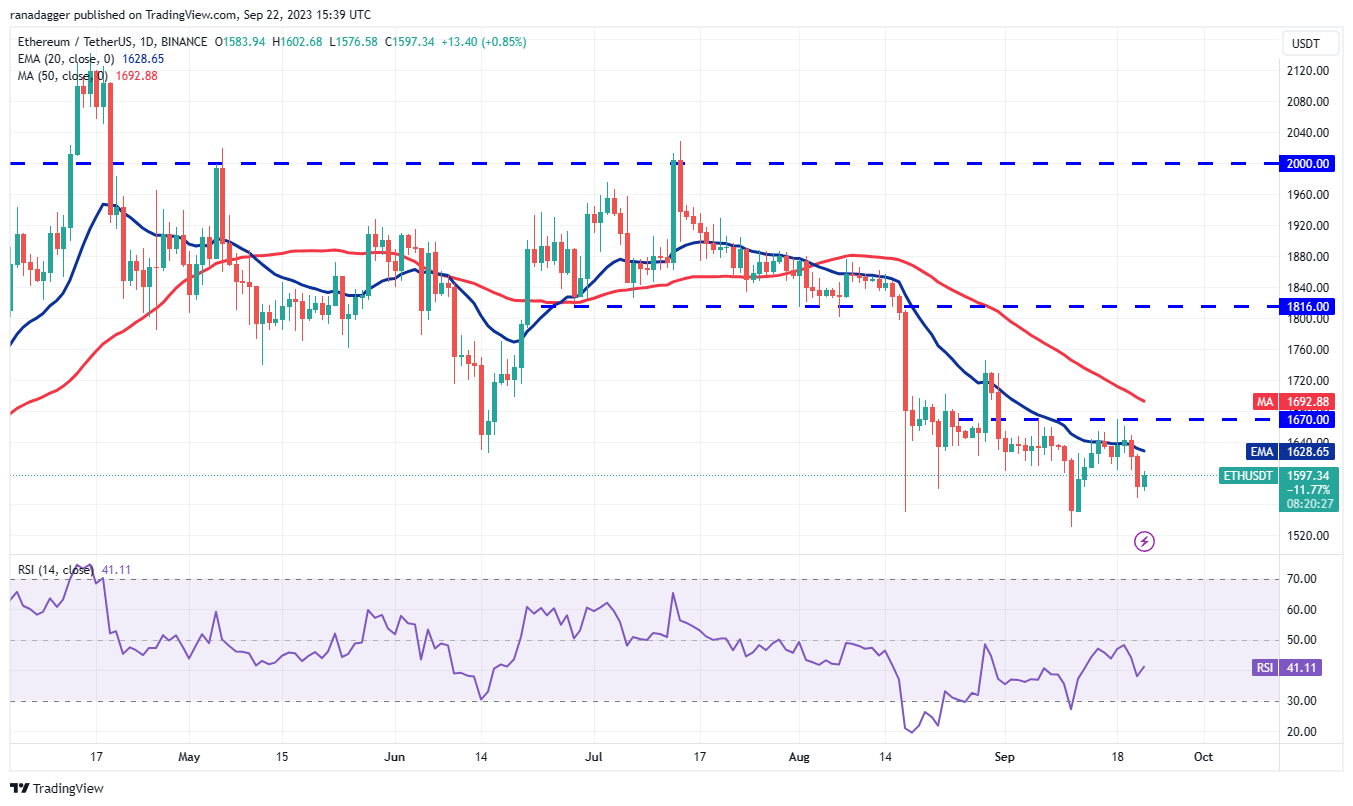
Contrarily, if the price turns up from the current level or rebounds off $1,530, it will suggest that lower levels are attracting buyers. The first sign of strength will be a break and close above $1,670. That will clear the path for a potential rally to $1,745.
BNB price analysis
BNB (BNB) turned down from $220 on Sep. 18 and broke below the 20-day EMA ($214) on Sep. 20. This suggests that the price may consolidate between $203 and $220 for a while longer.
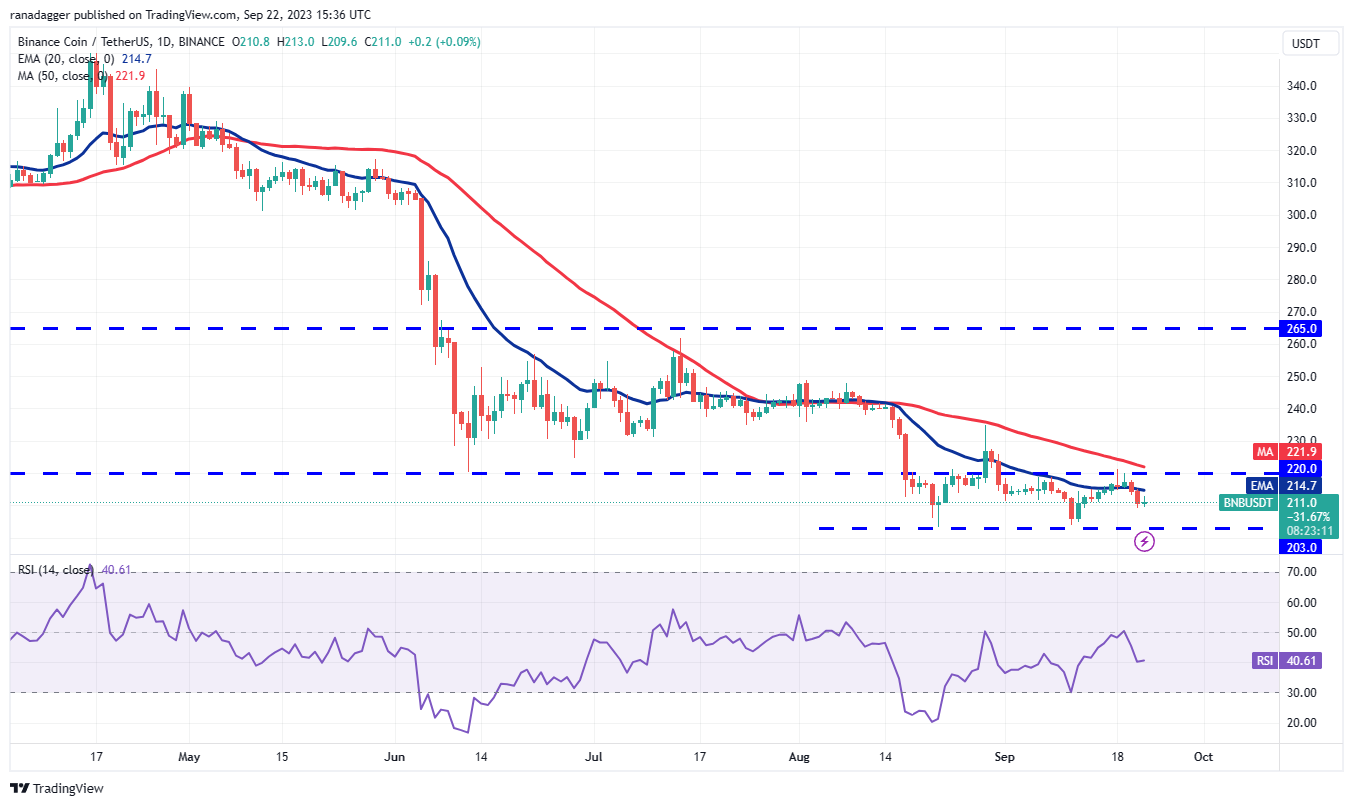
On the upside, the bulls will have to clear the hurdle at the 50-day SMA ($222) to signal a comeback. The pair could first rally to $235 and subsequently attempt an up-move to $250. This level is expected to attract sellers.
XRP price analysis
XRP (XRP) rose above the 20-day EMA ($0.51) on Sep. 19 but the bulls are struggling to sustain the recovery.

On the contrary, if the 20-day EMA gives way, the pair could fall to the uptrend line. This is an important level for the bulls to defend because a break below it will invalidate the bullish pattern.
Cardano price analysis
Cardano’s (ADA) price action of the past few days has formed a descending triangle pattern, which will complete on a break and close below $0.24.

If the price continues lower and breaks below $0.24, it will complete the bearish setup and set the stage for a fall to $0.22 and eventually to the pattern target of $0.19.
Dogecoin price analysis
Dogecoin (DOGE) turned down from the 20-day EMA ($0.06) on Sep. 21, indicating that the bears are aggressively defending the level.
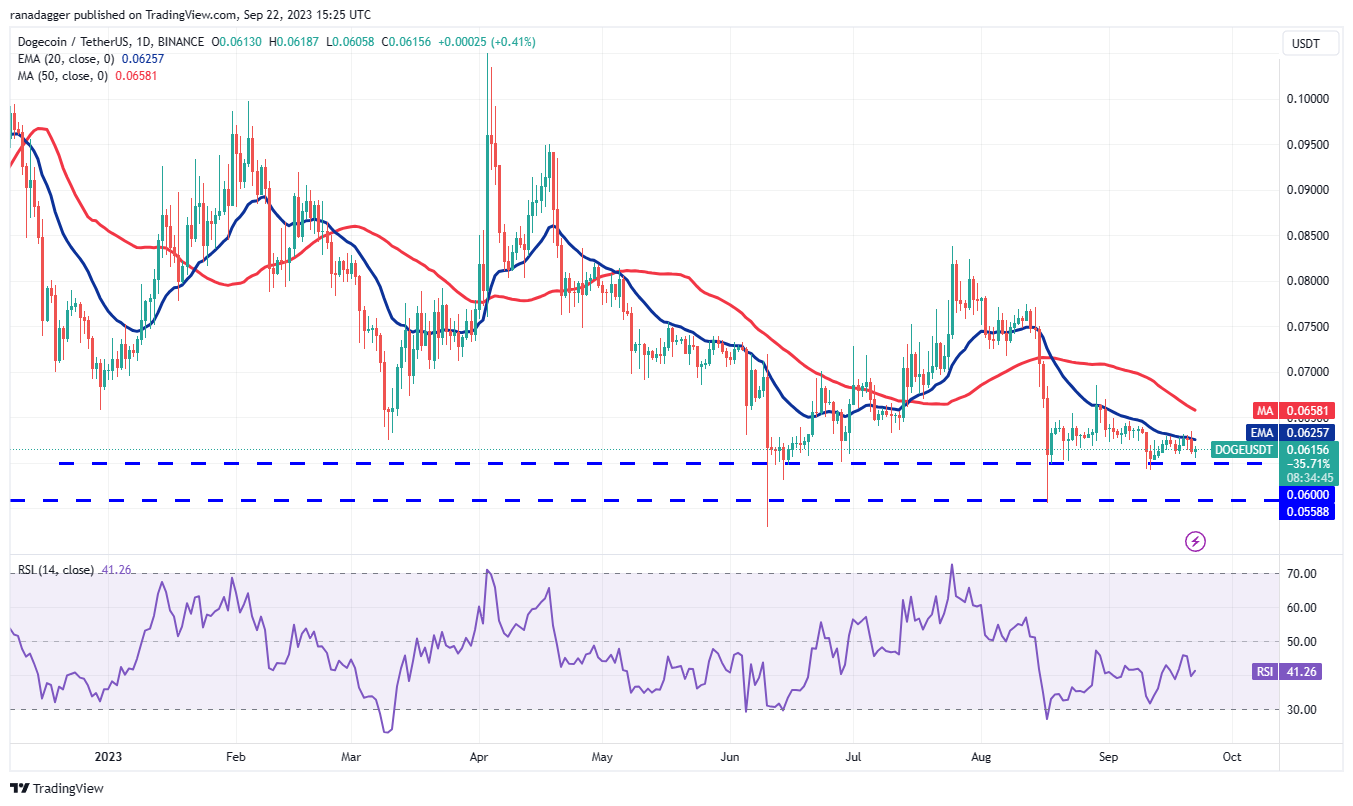
If bulls kick the price above the 20-day EMA, it will indicate the start of a sustained recovery to the 50-day SMA ($0.07) and then to $0.08. On the downside, if the $0.06 level cracks, the pair risks a potential decline to $0.055.
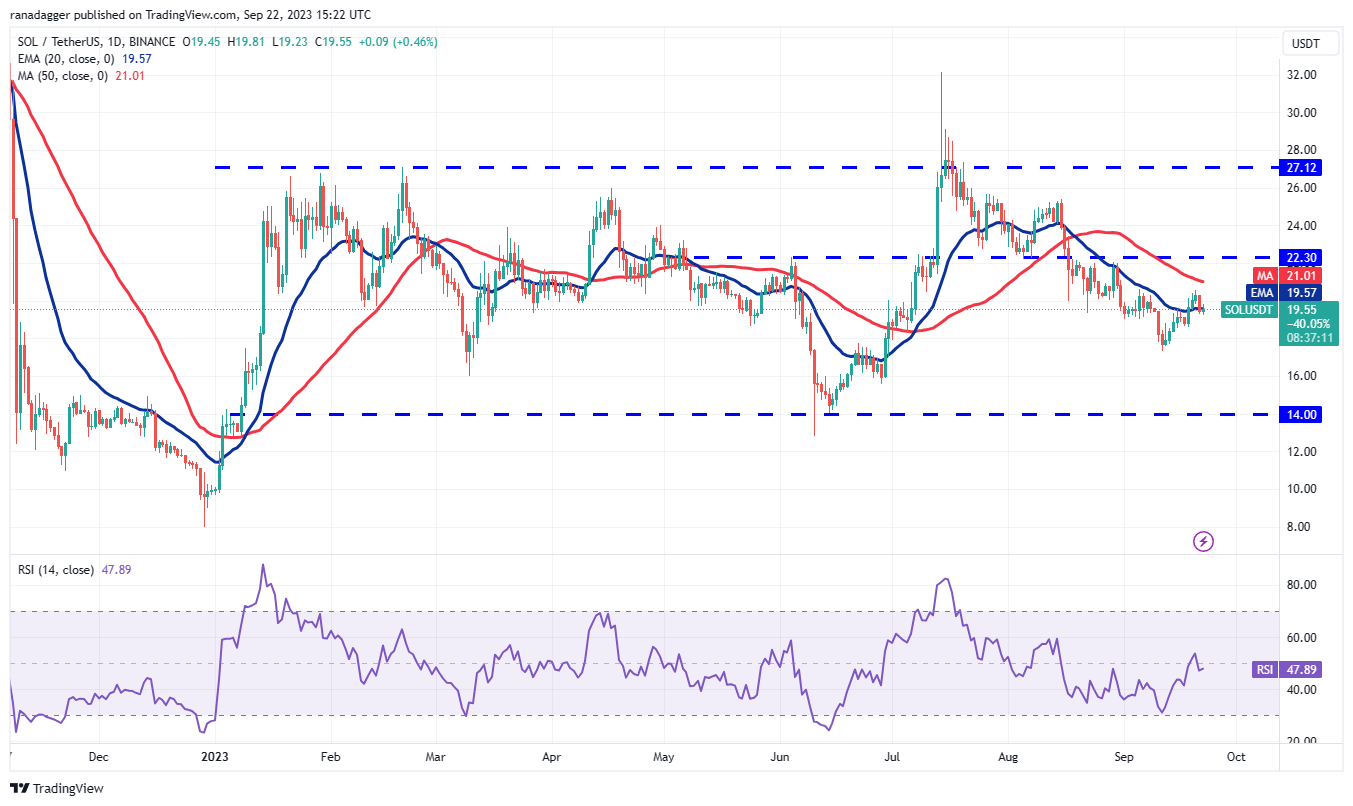
Solana price analysis
Solana (SOL) rose above the 20-day EMA ($19.57) on Sep. 18 but the bulls could not push the price to the 50-day SMA ($21.01). This suggests that the bears are active at higher levels.
Related: Bitcoin blasts past its 2021 all-time high in Argentina, but hyperinflation outpaces gains
On the other hand, if the price sustains above the 20-day EMA, it will suggest that the bulls have flipped the level into support. That could increase the possibility of a retest of the overhead resistance zone between the 50-day SMA and $22.30.
Toncoin price analysis
Toncoin’s (TON) failure to rise above $2.59 on Sep. 19 and 20 may have tempted short-term traders to book profits.
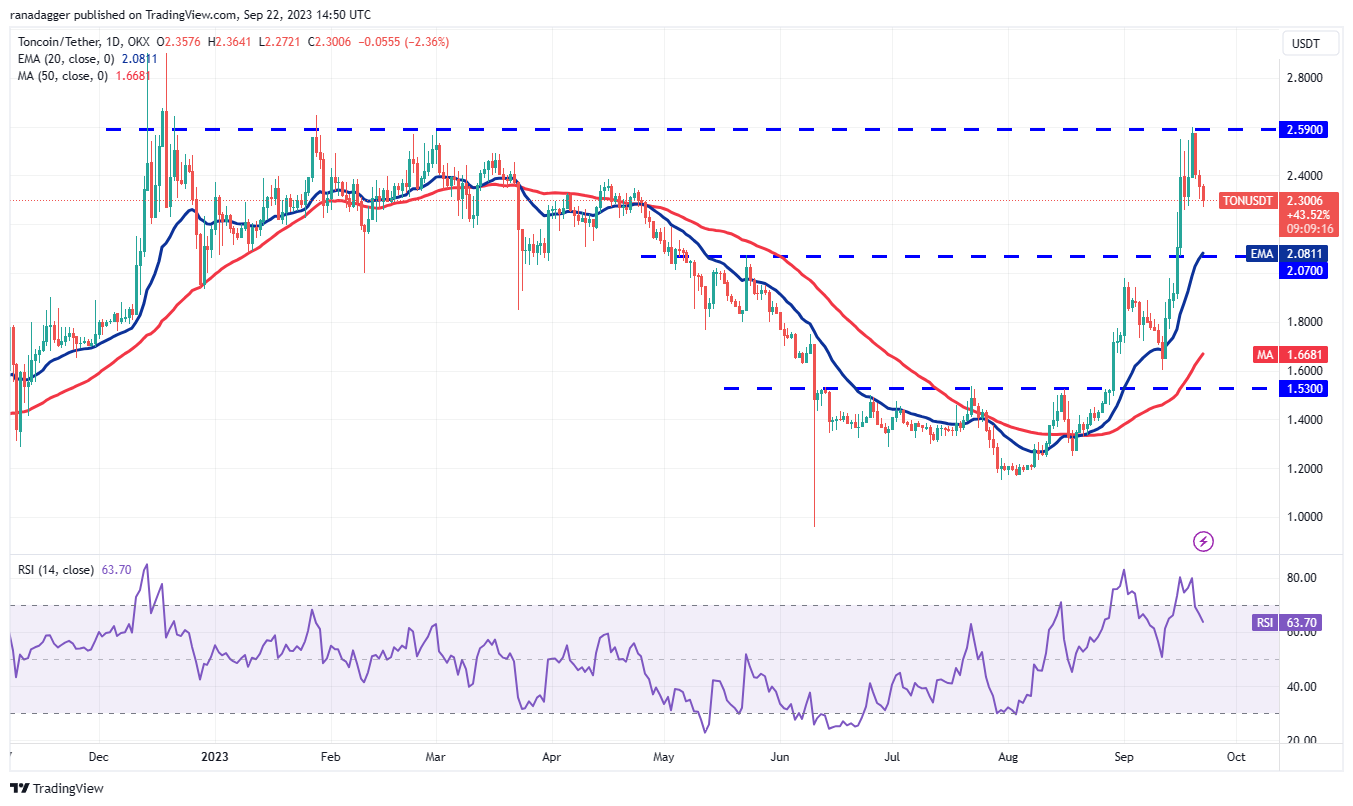
Another possibility is that the price snaps back from $2.25. If that happens, it will suggest that traders are not waiting for a deeper correction to buy. That will increase the likelihood of a break above $2.59. The pair may then jump to $2.90.
Polkadot price analysis
The bears are fiercely guarding the breakdown level of $4.22 in Polkadot (DOT), indicating that every minor relief rally is being sold into.

A minor advantage in favor of the bulls is that the RSI is showing early signs of forming a positive divergence. This suggests that the selling pressure could be reducing. A break and close above $4.22 will open the doors for a possible rally to the downtrend line.
Polygon price analysis
Polygon (MATIC) closed above the 20-day EMA ($0.54) on Sep. 19 but the bulls failed to build upon the momentum. This suggests that demand dries up at higher levels.

Alternatively, if the price rebounds of the $0.50 support with strength, it will suggest that lower levels are attracting buyers. The bulls will have to propel and sustain the price above $0.55 to signal the start of a stronger recovery.
This article does not contain investment advice or recommendations. Every investment and trading move involves risk, and readers should conduct their own research when making a decision.

Leave A Comment