
The FTX collapse continues to stoke fears of a contagion in the cryptocurrency space as investors wait to hear about businesses that may face the heat. One of the marquee names to come under the circle of suspicion is the Grayscale Bitcoin Trust (GBTC), which has seen its discount to Bitcoin’s (BTC) price reach record levels of about 50%.
Traders hate uncertainty and shy away from investing during these periods. That could be one of the reasons for a lack of buying interest in Bitcoin even after the sharp fall in its price. The Stock-to-Flow (S2F) model, which had seen its popularity soar during the bull phase, is coming under increasing criticism after the deviation between Bitcoin’s price and its projected price hit levels never seen before.
Does this suggest that the pessimism has reached an extreme or is it just that the S2F model is flawed?

Let’s look at the charts of five cryptocurrencies that may attempt a rally in the near term.
BTC/USDT
Bitcoin continues to trade inside the tight range between $16,229 and $17,190. Generally, periods of tight consolidation are followed by an increase in volatility.
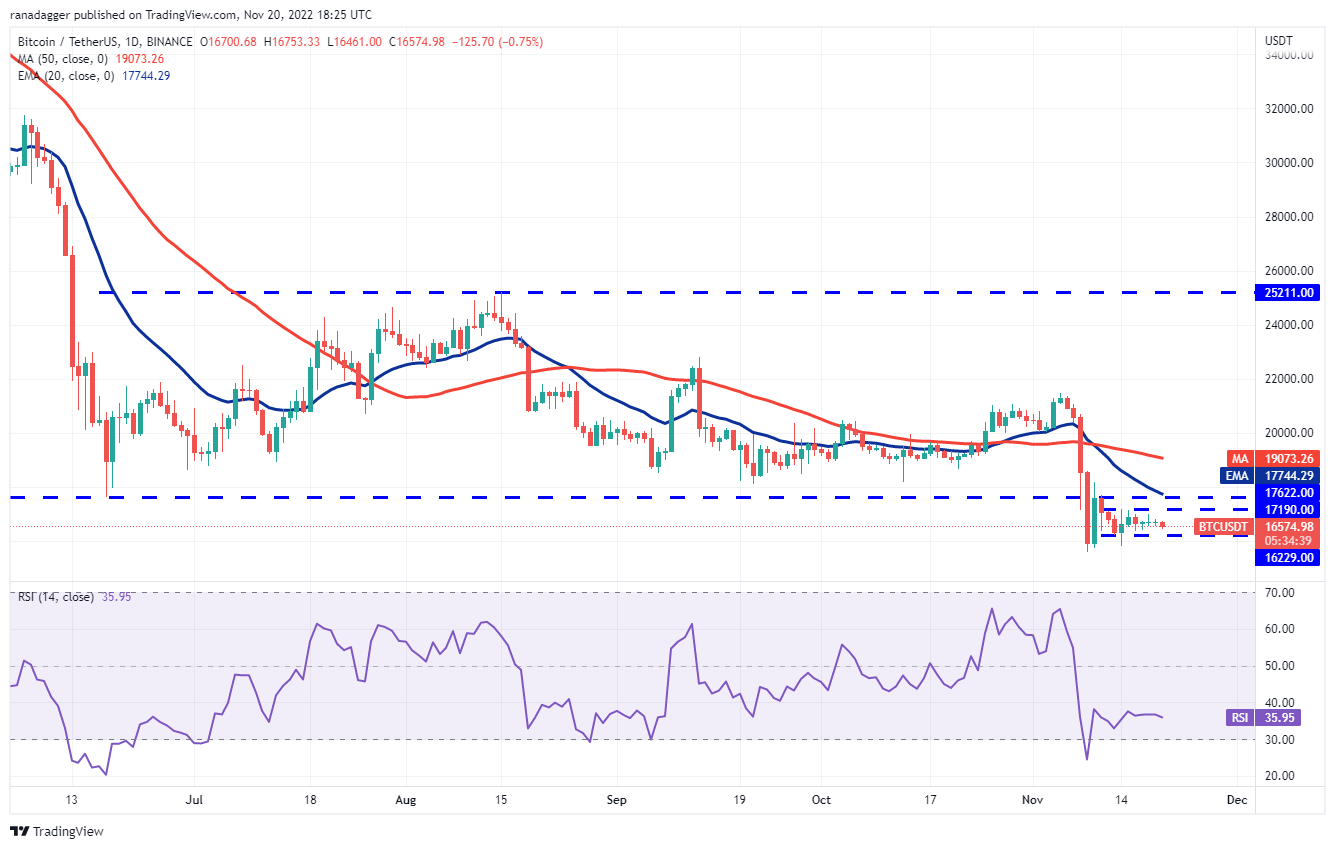
If bulls want to avoid a further decline, they will have to push and sustain the price above the breakdown level of $17,622. Such a move will suggest strong demand at lower levels. The pair could then climb to the psychological level of $20,000.

However, this uncertainty is unlikely to continue for long. If the price plummets below $16,229, the selling pressure could pick up momentum and the pair may drop to $15,588. If this support gives way, the pair may start the next leg of the downtrend.
On the contrary, if the price rises and breaks above $17,190, it will suggest that the current tight range was used by the bulls to accumulate. The pair could then rally to $18,200 and later to $18,730.
TON/USDT
Toncoin (TON) has recovered sharply from its June low and managed to hold on to a large part of the gains. This suggests that traders are in no hurry to dump their positions at higher levels.

If the price rebounds off the 20-day exponential moving average ($1.65), the bulls will try to drive the price above the triangle. If they can pull it off, the pair could rally to $2.15 and thereafter climb toward the target objective of $2.87.
Alternatively, if the price slips below the 20-day EMA, the pair could drop to the 50-day simple moving average ($1.50) and then to the support line.
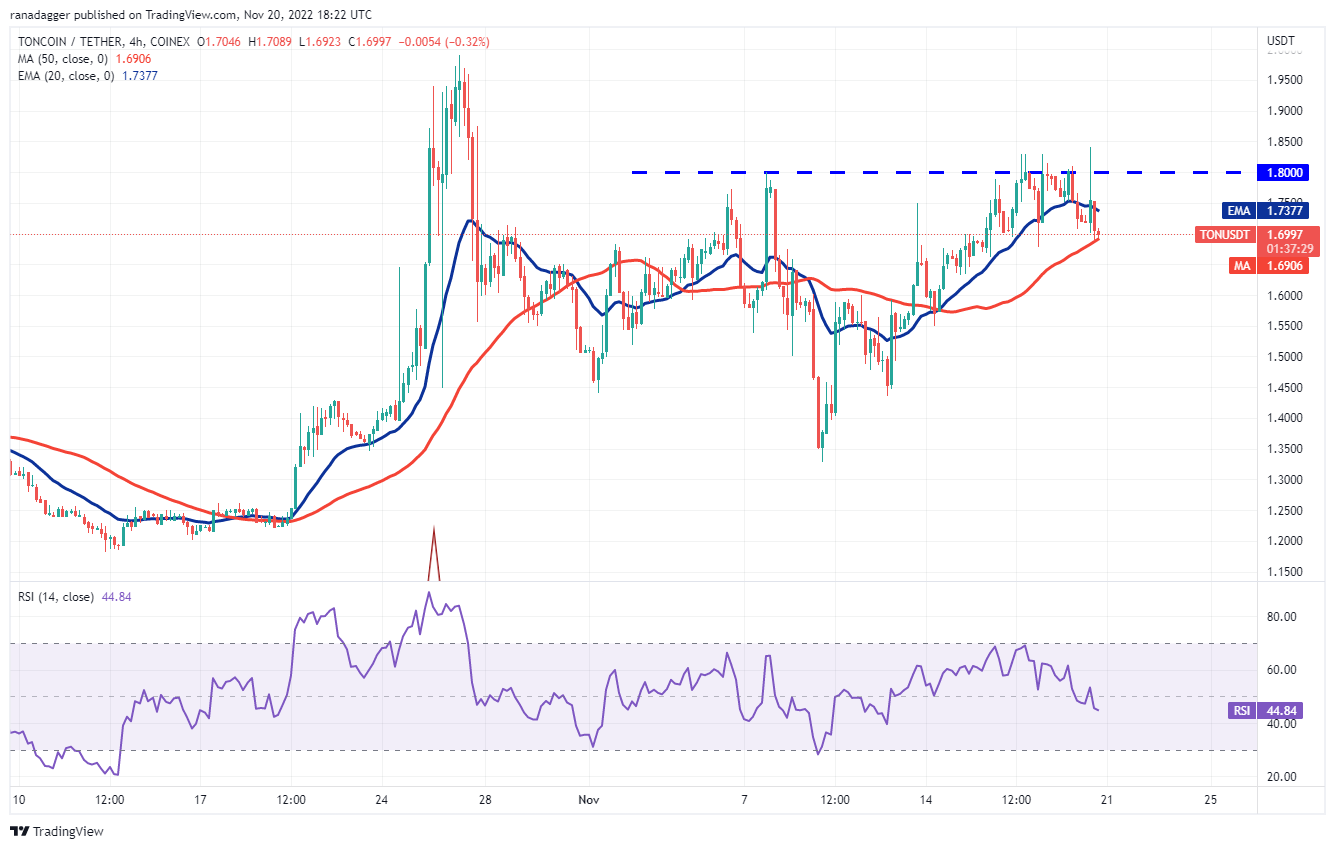
Conversely, if the price rebounds off the current level, the bulls will again try to scale the wall at $1.80. The repeated retest of a resistance level tends to weaken it. A close above this resistance could open the doors for a possible rally to $2.
CHZ/USDT
Chiliz (CHZ) is attempting to form an inverse head and shoulders pattern, which will complete on a break and close above the neckline. If that happens, it may signal the start of a new uptrend.
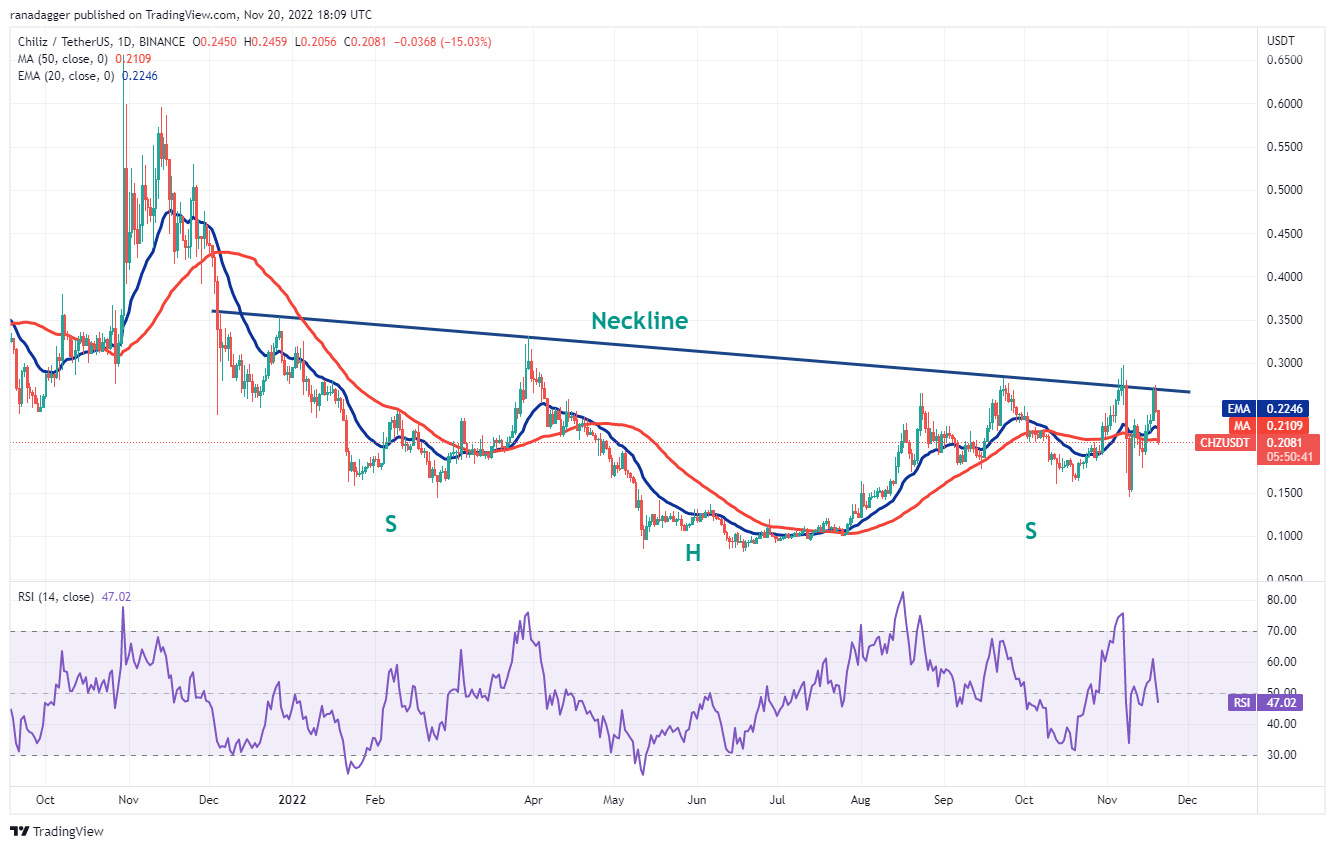
Alternatively, if the price bounces off the current level, buyers will again attempt to propel the pair above the neckline and gain control.
The flattening moving averages and the RSI just below the midpoint do not give a clear advantage either to the bulls or the bears. Hence, it is better to wait for the price to breakout before establishing fresh positions.

On the other hand, if the price turns up from the current level and rises above the 20-EMA, it will suggest that traders are viewing the dips as a buying opportunity. The pair could then rise to $0.26 and later to $0.28. Buyers will have to drive the price above this level to challenge the resistance at $0.30.
Related: FTX funds on the move as thief converts thousands of ETH into Bitcoin
QNT/USDT
Although Quant (QNT) has corrected sharply in the past few days, it is attempting to take support and bounce off the support line. This indicates demand at lower levels.
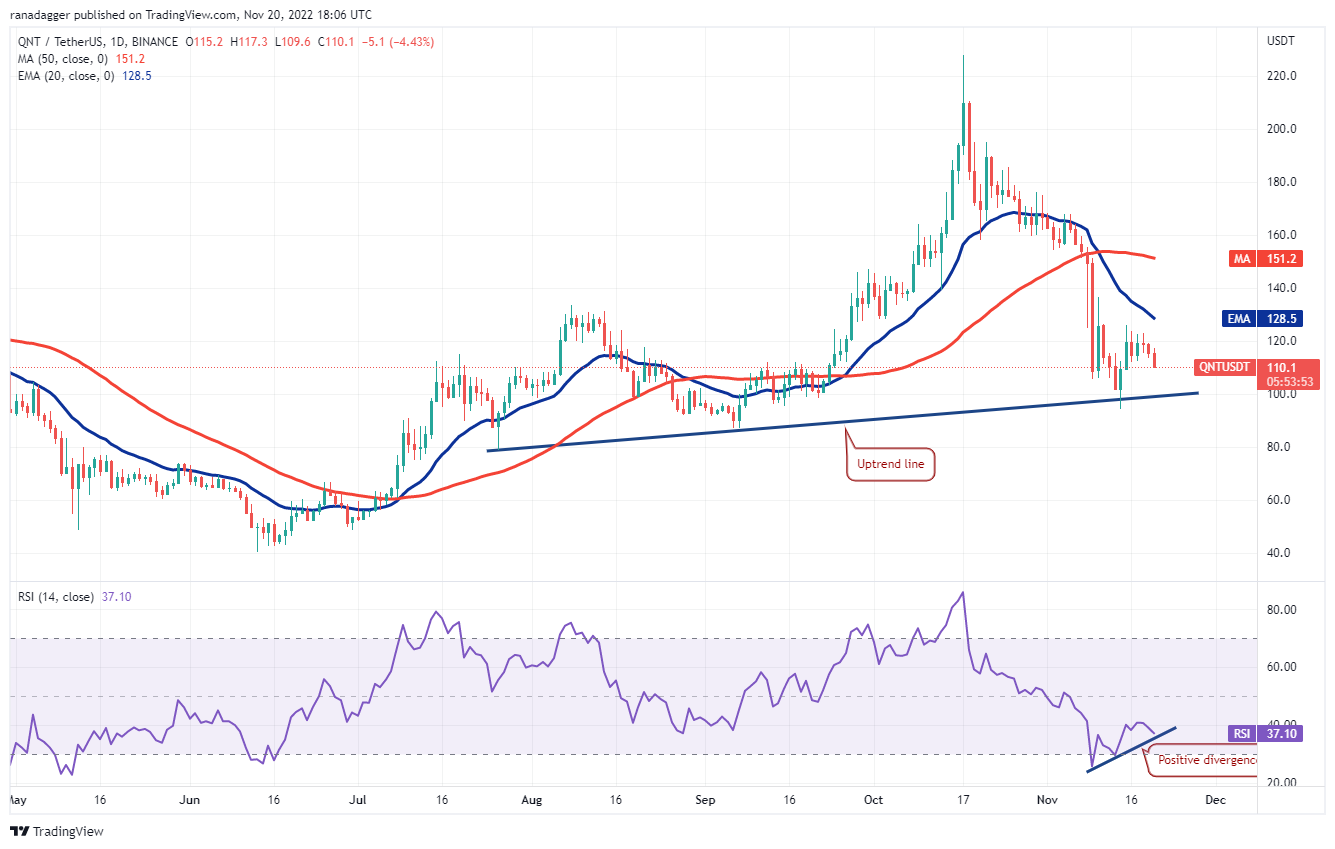
Buyers will have to propel and sustain the price above the 20-day EMA to indicate that the corrective phase may be over. The QNT/USDT pair could then rise to the 50-day SMA ($151) and thereafter to $180.
This positive view could invalidate in the near term if the price continues lower and breaks below the uptrend line. The pair could then drop to $87 and later to $79.
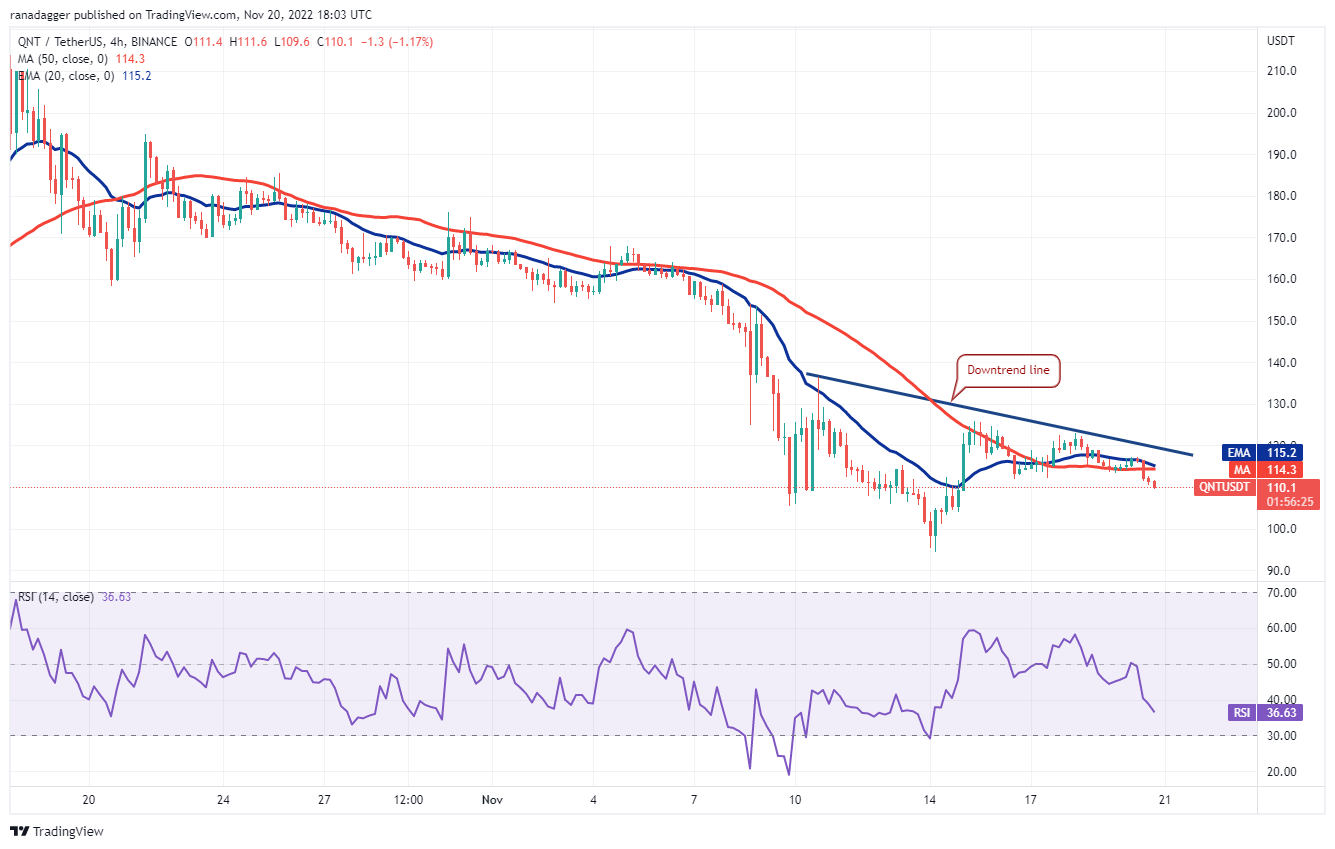
To invalidate this negative view, the bulls will have to kick and sustain the price above the downtrend line. The pair could then rise to $125 where the bears may mount a strong defense. If buyers overcome this barrier, the up-move may reach $136.
TWT/USDT
While most major cryptocurrencies extended their downtrend in the past few days, Trust Wallet Token (TWT) has moved in the opposite direction and risen sharply. This indicates outperformance in the near term.
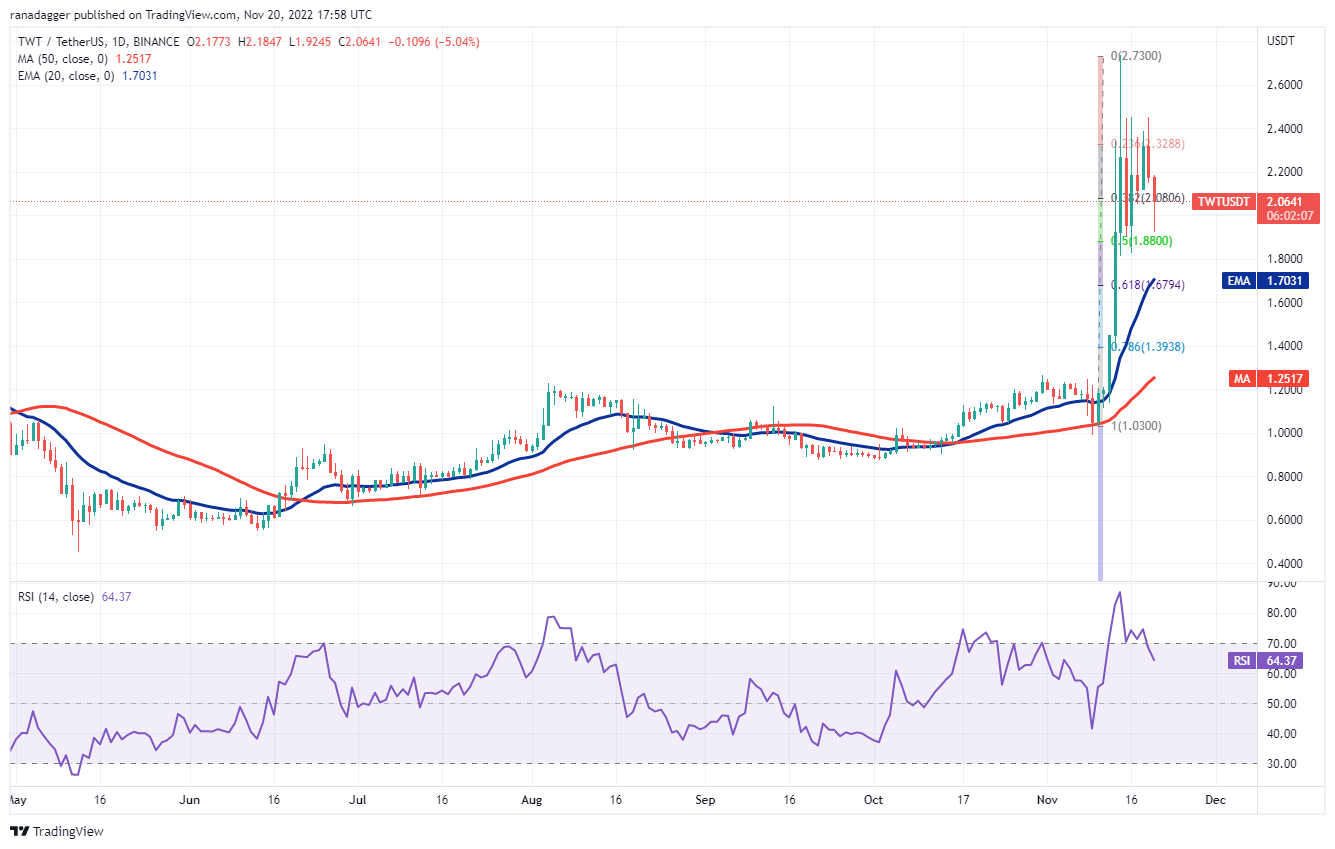
The pair is finding support near the 50% Fibonacci retracement level of $1.88 but the bulls are struggling to push the price above $2.45. This suggests the pair may consolidate between $1.81 and $2.45 for a few days.
Both moving averages are sloping up and the RSI remains in the positive territory, indicating that bulls have the advantage. If buyers drive the price above the $2.45 to $2.73 resistance zone, the pair could resume its uptrend. This positive view could invalidate on a break and close below the 20-day EMA ($1.70).
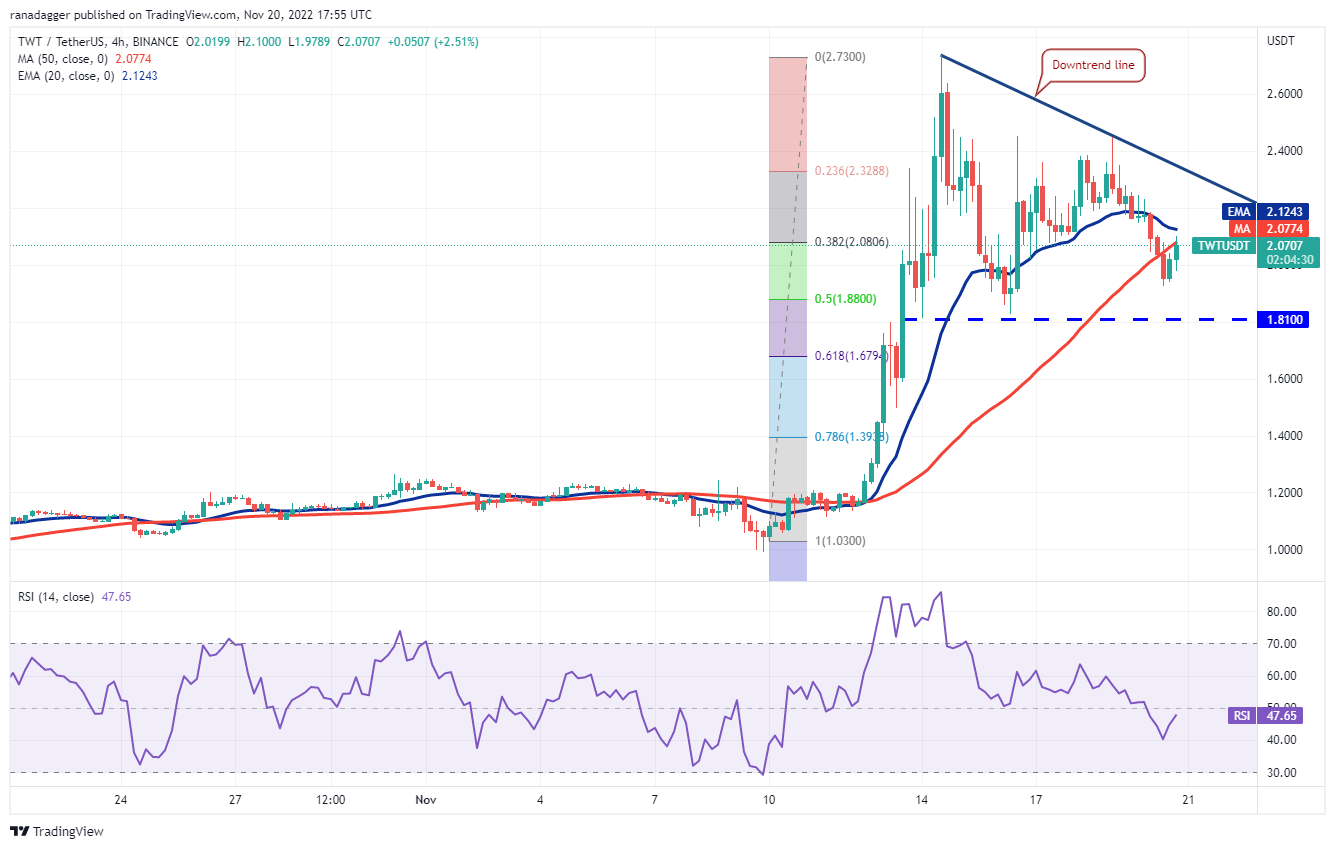
A break above this level could clear the path for a possible rally to $2.45. This remains the key hurdle for the bulls to overcome. If they succeed in breaking it, the pair may retest $2.73.
On the downside, a slide below $1.92 could result in a decline to $1.81. This is an important level to keep an eye on because a break below it could tilt the advantage in favor of the bears.
The views and opinions expressed here are solely those of the author and do not necessarily reflect the views of Cointelegraph.com. Every investment and trading move involves risk, you should conduct your own research when making a decision.

Leave A Comment