
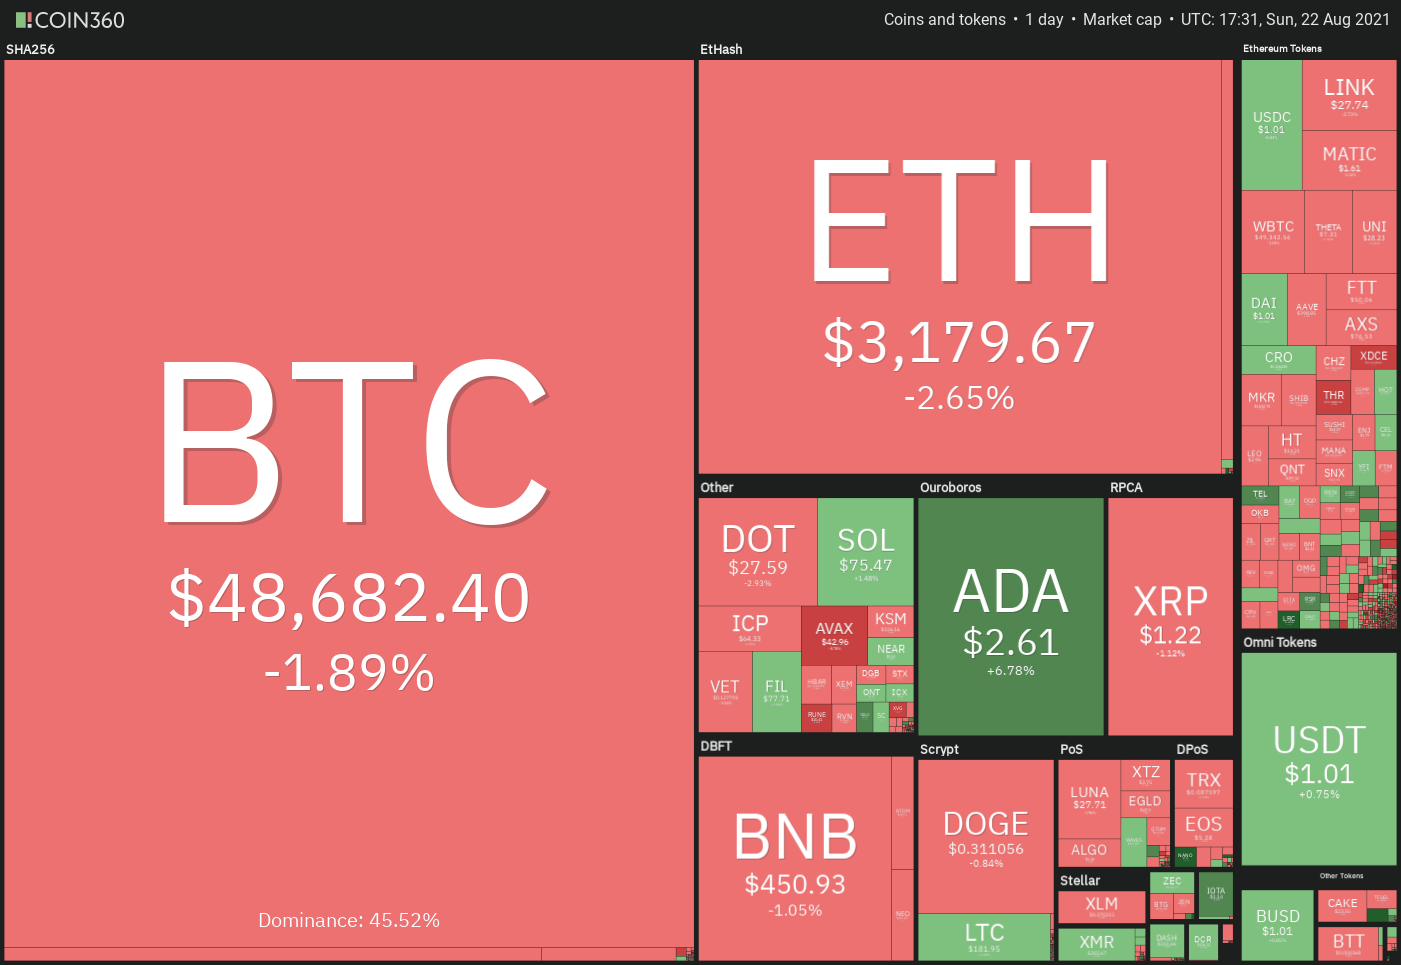
Bitcoin (BTC) is knocking at the doors of the key $50,000 level and most traders are still optimistic even after the digital asset rallied 70% from the July 20 low at $29,278 to an intraday high at $49,757.04 on Aug. 21.
Monitoring resource Material Indicators pointed to a lot of puts at the $50,000 strike price and the “positive funding almost across the board (overheated),” which suggests a rejection at the current levels and a “pullback going into September.”
Another positive sign for the crypto sector is the ever-growing list of unicorns. Analysts expect more companies to join the list as the adoption of crypto and blockchain increases.
Bitcoin’s hesitation near the $50,000 mark may shift focus to altcoins? Let’s study the charts of the top-5 cryptocurrencies that are likely to attract traders’ attention in the short term.
BTC/USDT
Bitcoin rebounded off the 20-day exponential moving average ($45,049) on Aug. 19 and the bulls pushed the price above the stiff overhead resistance at $48,144 on Aug. 20. The bears are currently attempting to stall the up-move at the psychological resistance at $50,000.
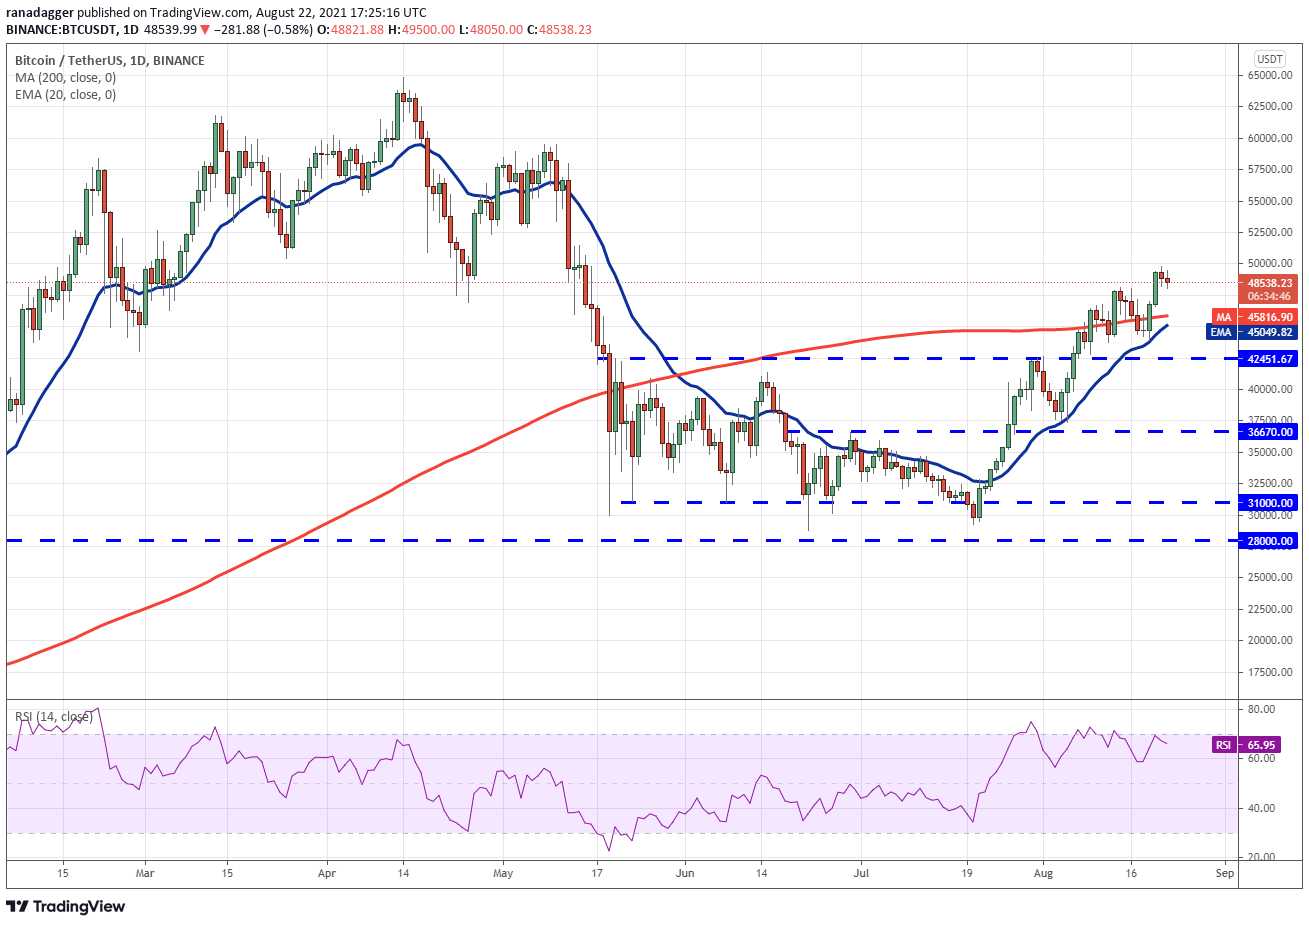
The rising 20-day EMA and the relative strength index (RSI) in the positive zone suggest that the path of least resistance is to the upside.
Alternatively, if bears pull the price below $48,144, the pair could drop to the 200-day simple moving average ($45,816). This is an important level for the bulls to defend because a break below it could embolden the bears.
The sellers will then try to sink the price below the breakout level at $42,451.67. If they succeed, it will suggest the start of a deeper correction.
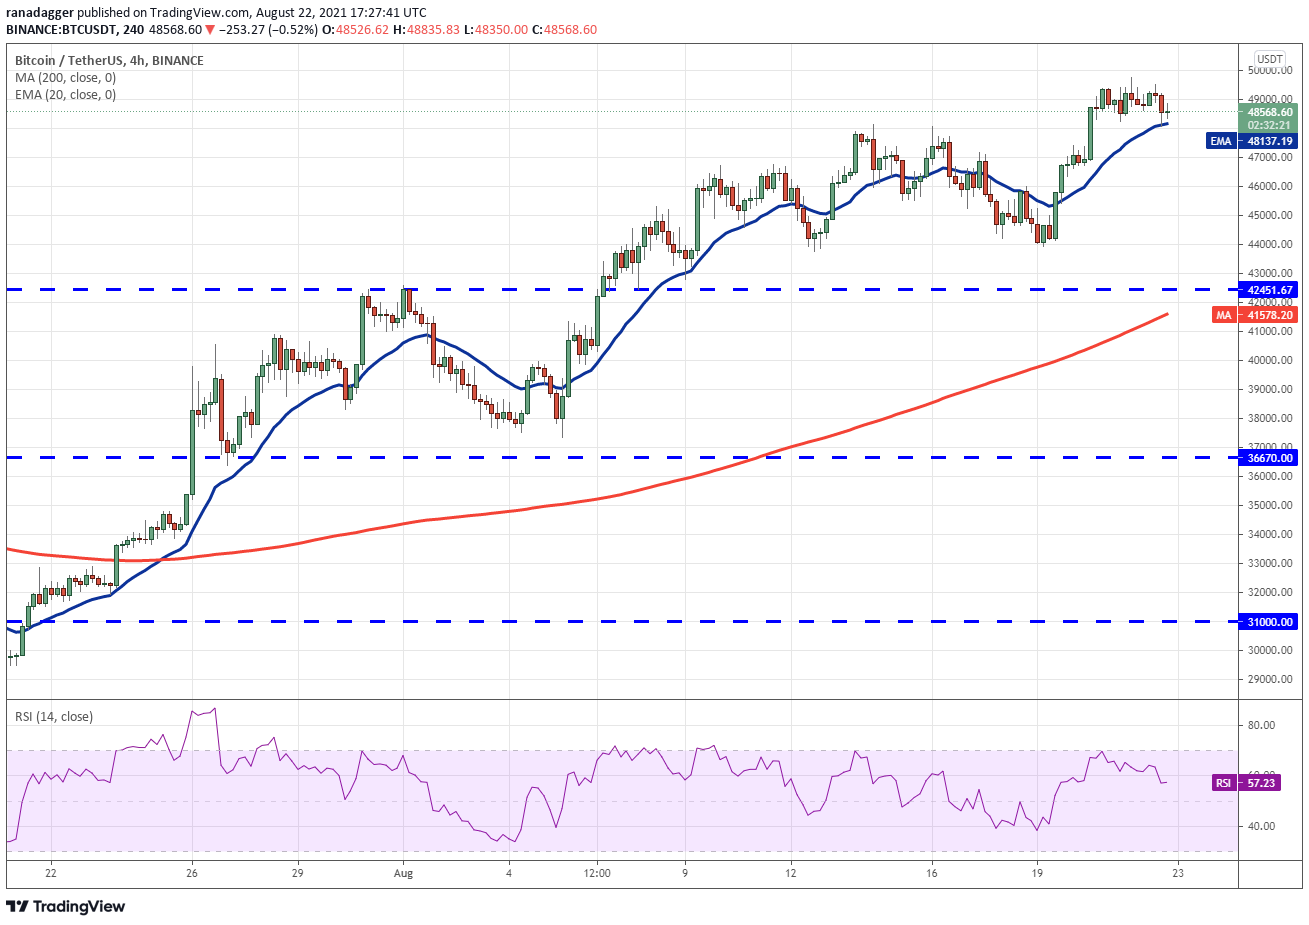
If that happens, it will suggest that the bulls are losing their grip and the pair could then remain range-bound between $44,000 and $50,000 for a few days. The bears will have to pull the price below $42,451.67 to gain the upper hand.
ADA/USDT
Cardano (ADA) is in a strong uptrend. The bulls pushed the price above the all-time high at $2.47 on Aug. 20 but the long wick on the day’s candlestick showed selling at higher levels. The altcoin formed an inside-day candlestick pattern on Aug. 21, indicating indecision among bulls and bears.
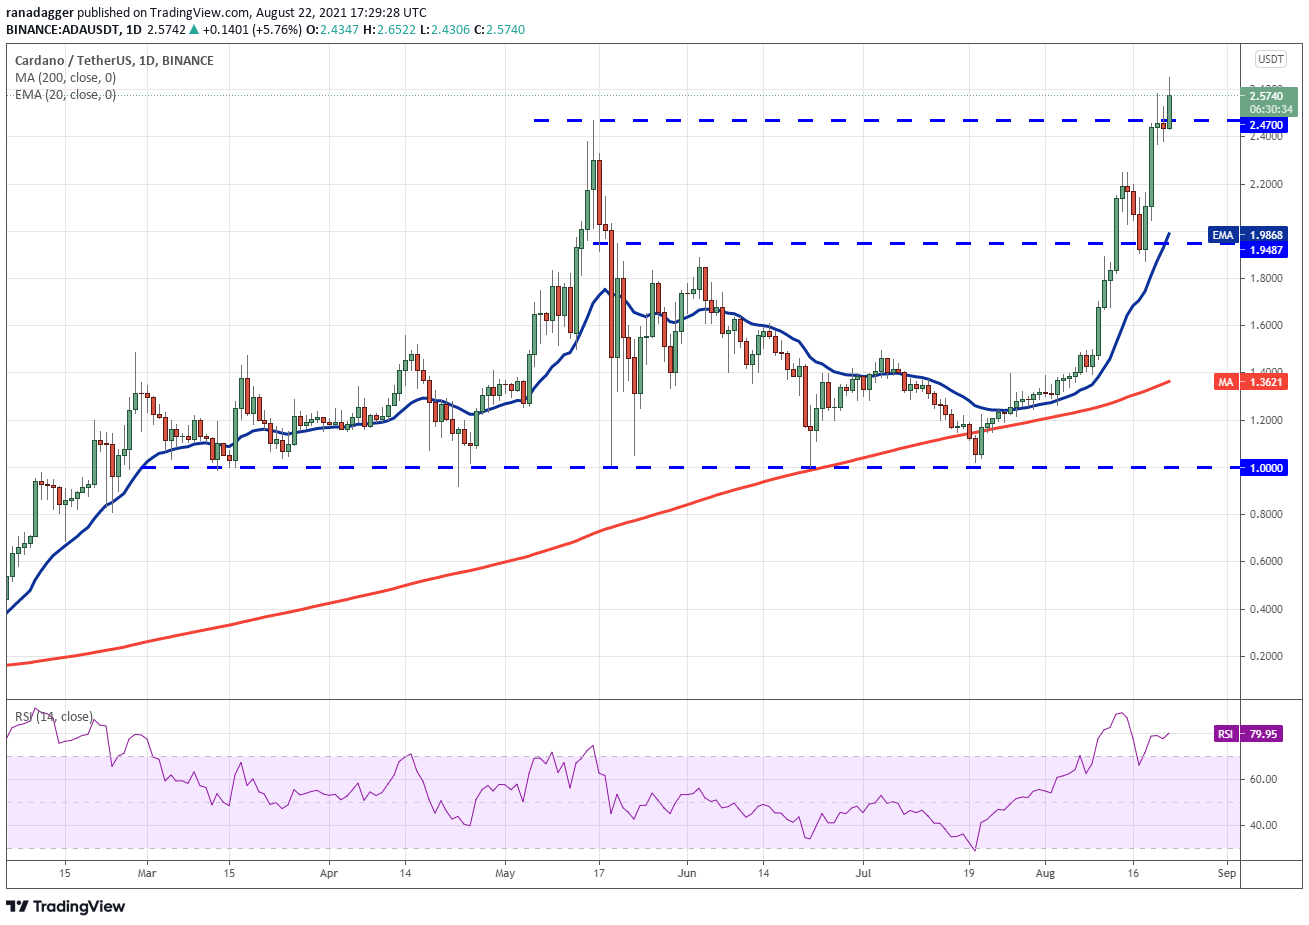
However, the long wick on today’s candlestick suggests that bears are unlikely to give up without a fight. They will try to pull the price back below $2.36 and trap the aggressive bulls. If that happens, the pair may correct to $2.20.
If the price rebounds off $2.20, the bulls will again try to resume the uptrend. A breakout and close above the $2.47 to $2.65 will enhance the prospects of the continuation of the uptrend. Alternatively, a break below $2.20 could pull the price down to $1.94.
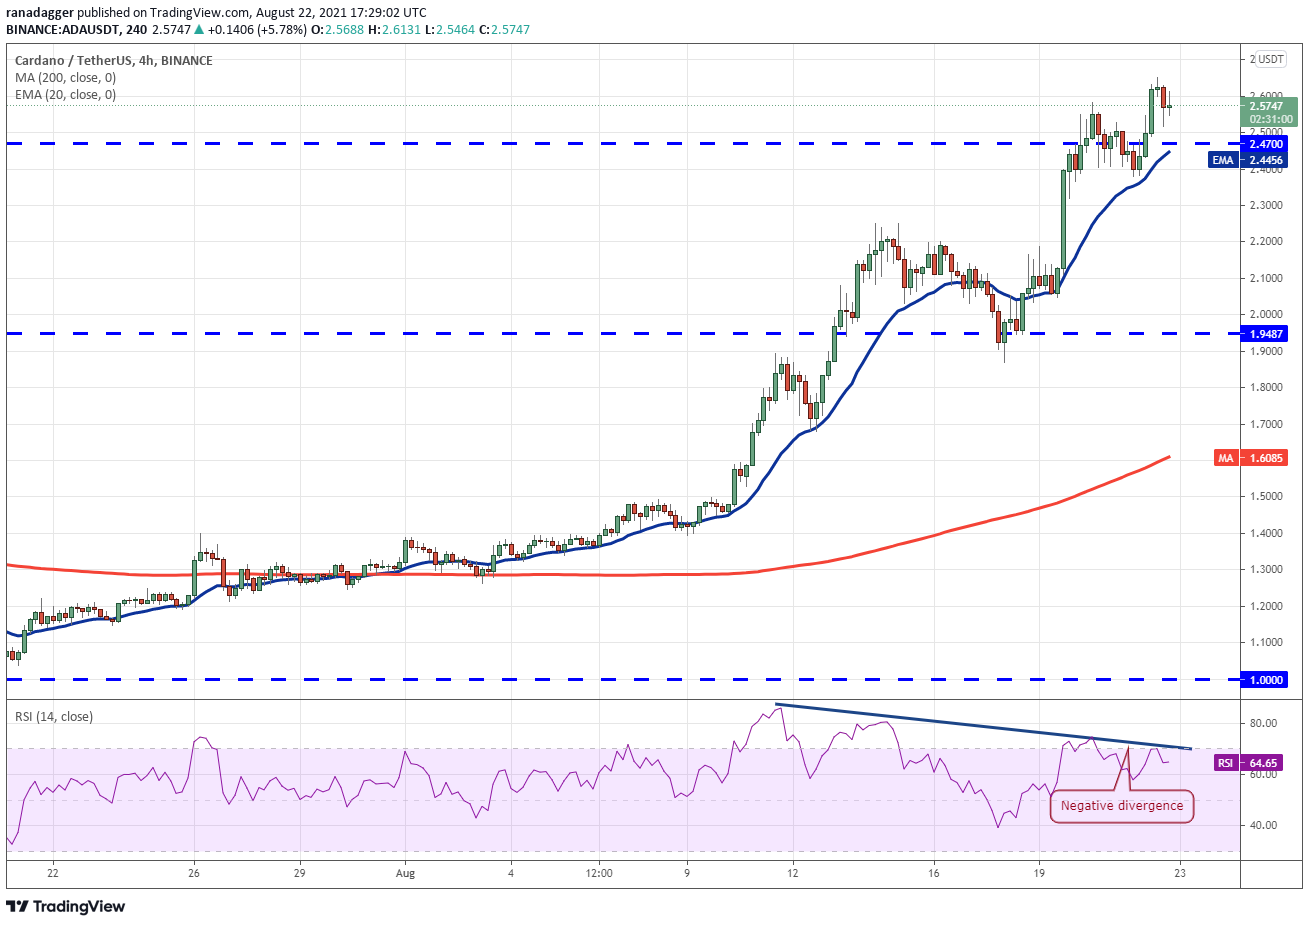
Contrary to this assumption, if bulls do not give up much ground from the current level, it will suggest strength. That could attract further buying and the pair may then rally to the psychological resistance at $3.
AVAX/USDT
Avalanche (AVAX) rallied from $18.41 on Aug. 17 to $50.27 on Aug. 21, a 173% rally within a short time. This sharp up-move has pushed the RSI above 92, indicating the rally is over-extended in the short term.
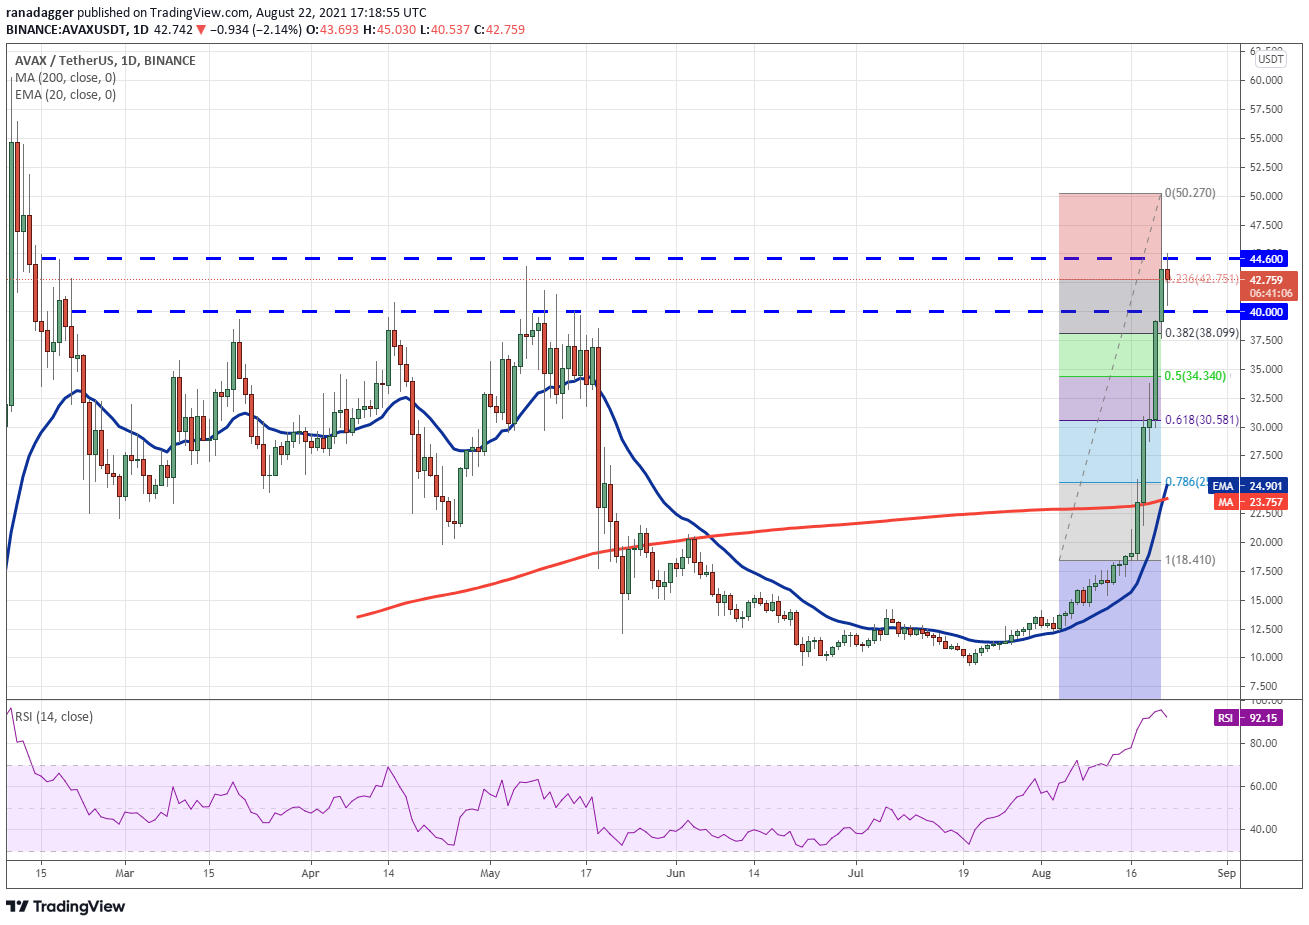
A breakout and close above $44 could improve the prospects of a retest of the all-time high at $60.30.
On the contrary, if bears pull the price below the 38.2% Fibonacci retracement level at $38.09, the AVAX/USDT pair could correct to the 50% retracement level at $34.34. A break below this support will indicate that the bullish momentum may have weakened.
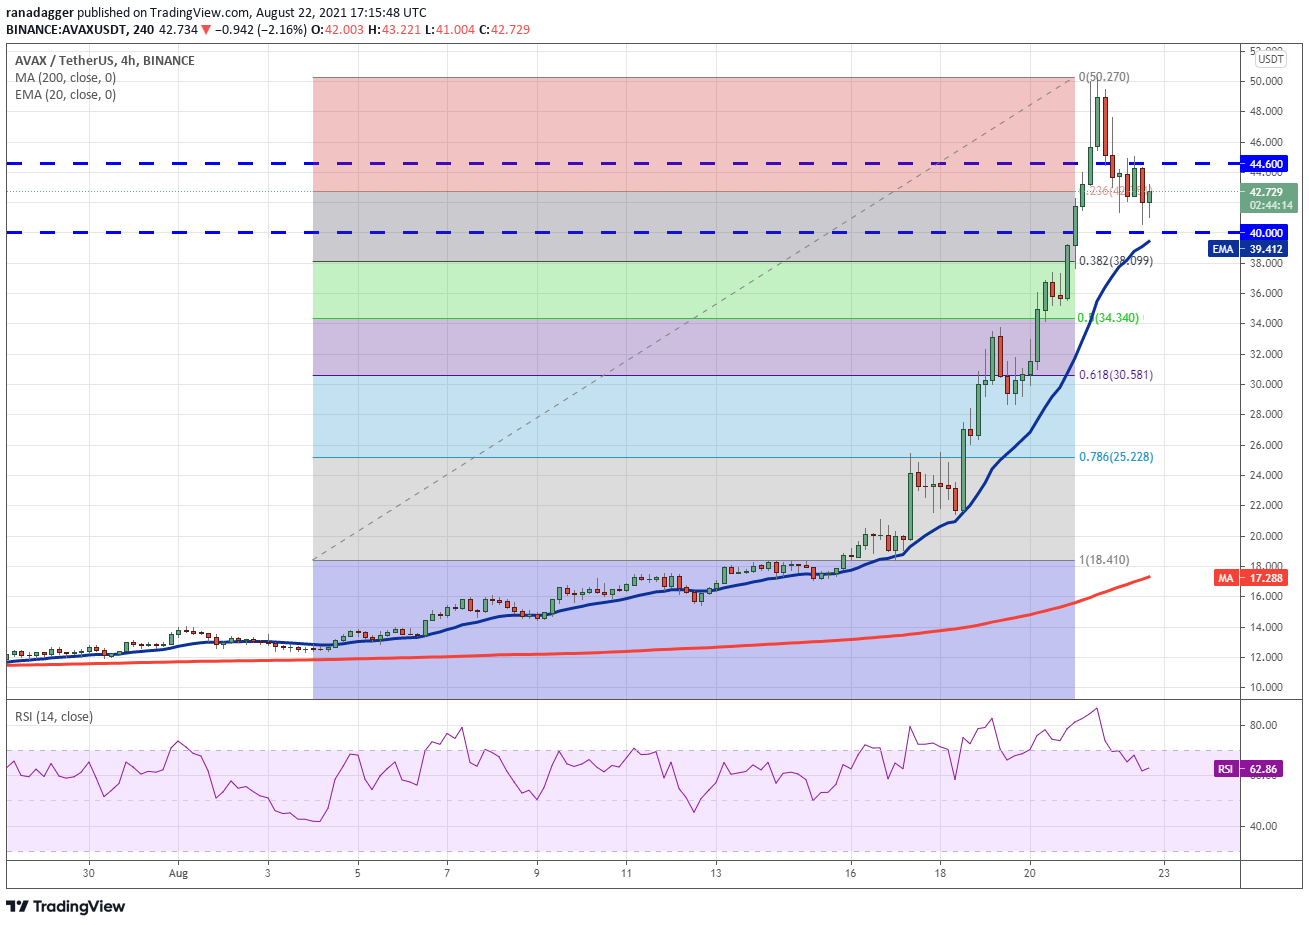
If the bulls drive the price above $44.60, the pair could rally to $50.27. A breakout and close above this level will signal the resumption of the uptrend. Conversely, a break below the 20-EMA will indicate that traders are booking profits and not buying the dips. That could signal the start of a deeper correction.
CAKE/USDT
PancakeSwap (CAKE) is currently in a strong recovery. Sustained buying by the bulls pushed the price above the 38.2% Fibonacci retracement level at $22.74 on Aug. 20.
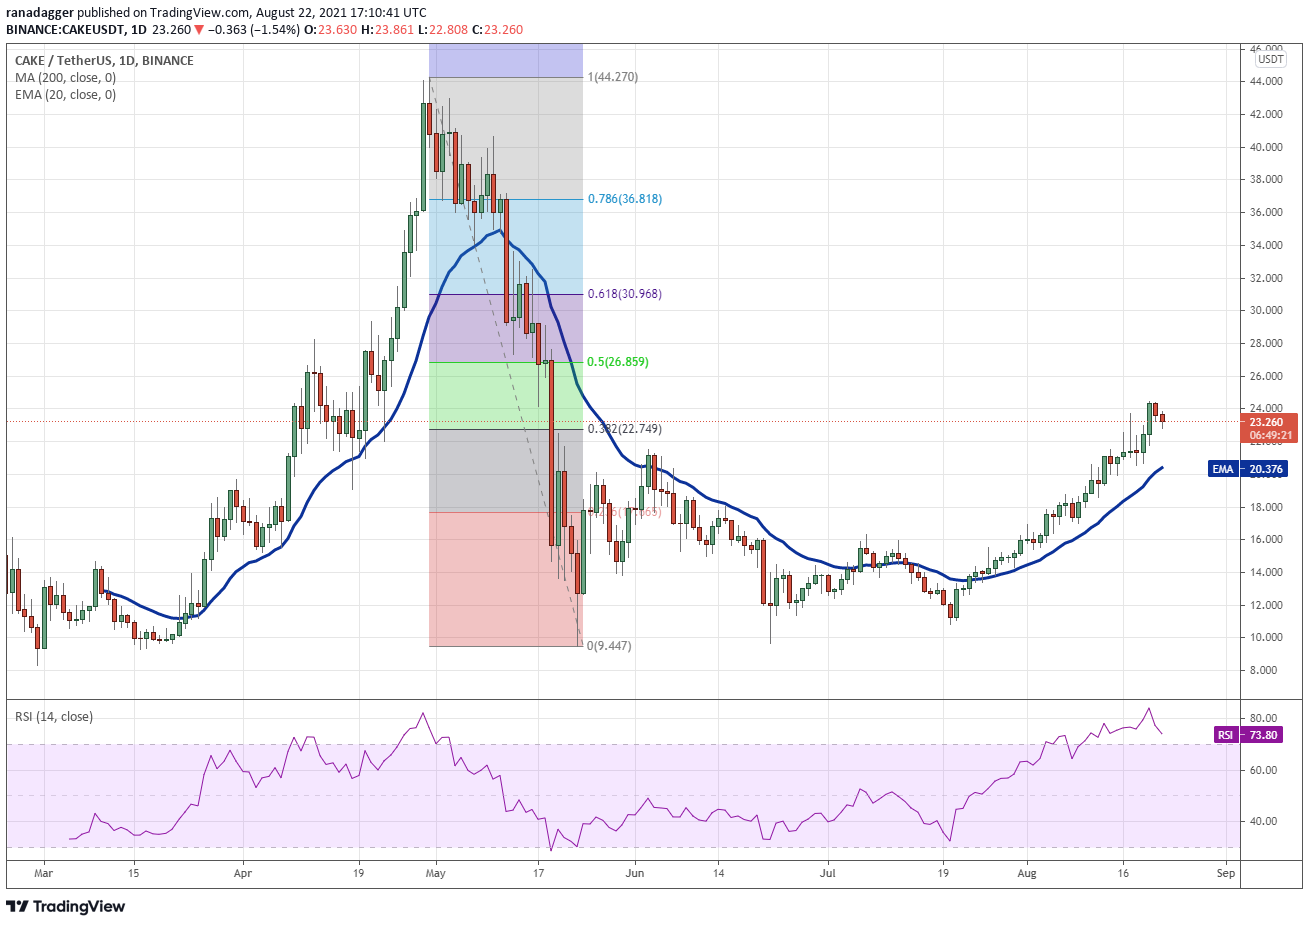
On the way down, the critical support to watch out for is the 20-day EMA ($20.37). If the price rebounds off this support, it will suggest that sentiment remains positive and traders are buying on dips. Conversely, a break below the 20-day EMA could open the doors for a further decline to $16.
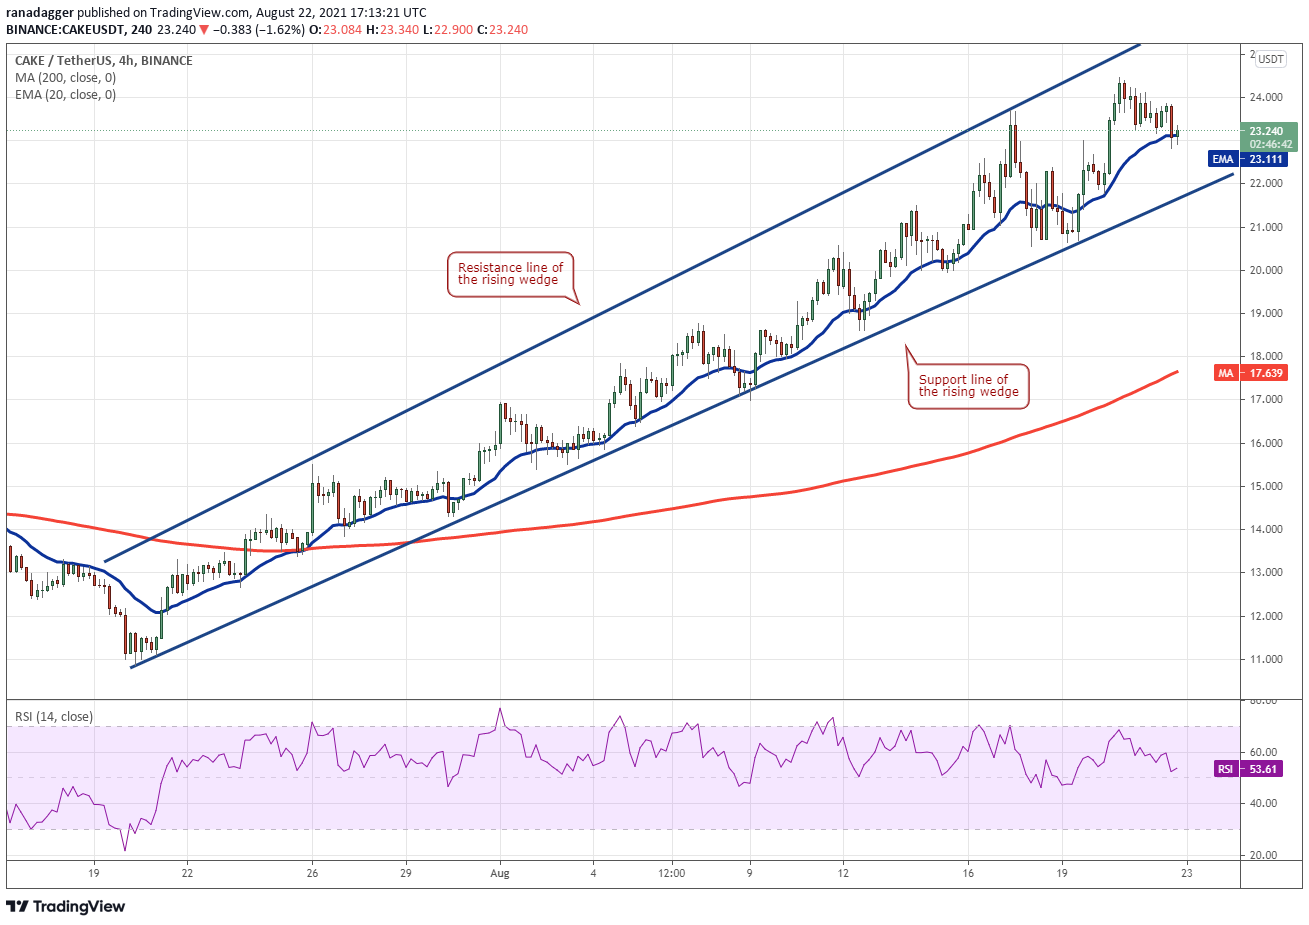
A breakout and close above $24.65 will suggest the resumption of the up-move. The next target objective on the upside is the resistance line of the wedge. The bullish momentum could pick up if bulls thrust the price above the wedge.
Related: Walmart seeks crypto product lead, Dogecoin Foundation returns, Coinbase amasses $4B war chest: Holder’s Digest, Aug. 15-21
ATOM/USD
Cosmos (ATOM) had been trading in a large range between $8.51 and $17.56 since late May. The bulls pushed the price above the resistance of the range on Aug. 18, clearing the path for a possible move to the pattern target at $26.61.
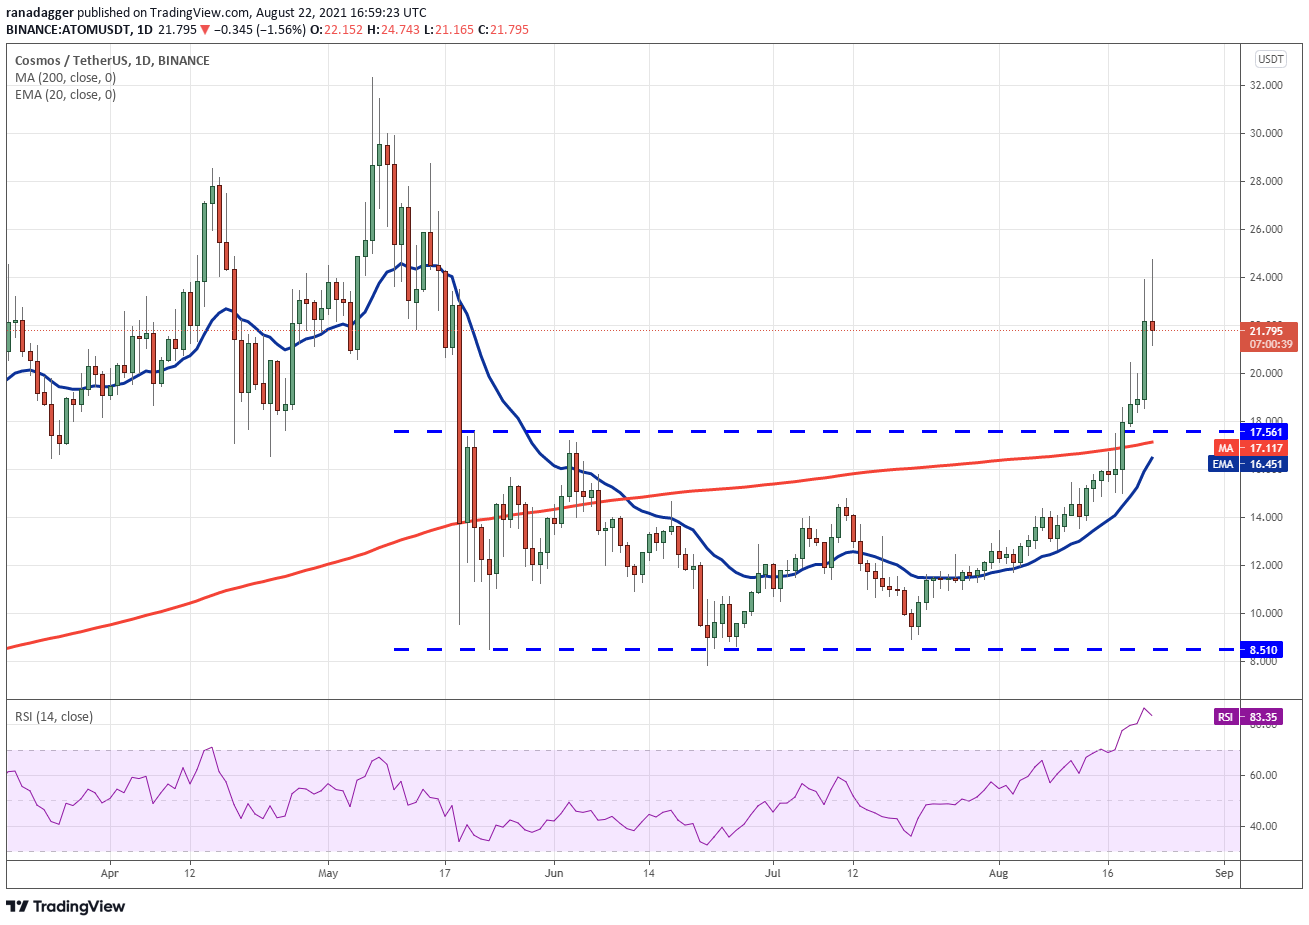
If bulls do not give up much ground and flip the $17.56 level into support, the ATOM/USDT pair will again try to resume the uptrend. A break above $26.61 could open the doors for a rally to $28 and then to $30.
The bears will have to pull and sustain the price below $17 to invalidate the bullish sentiment.
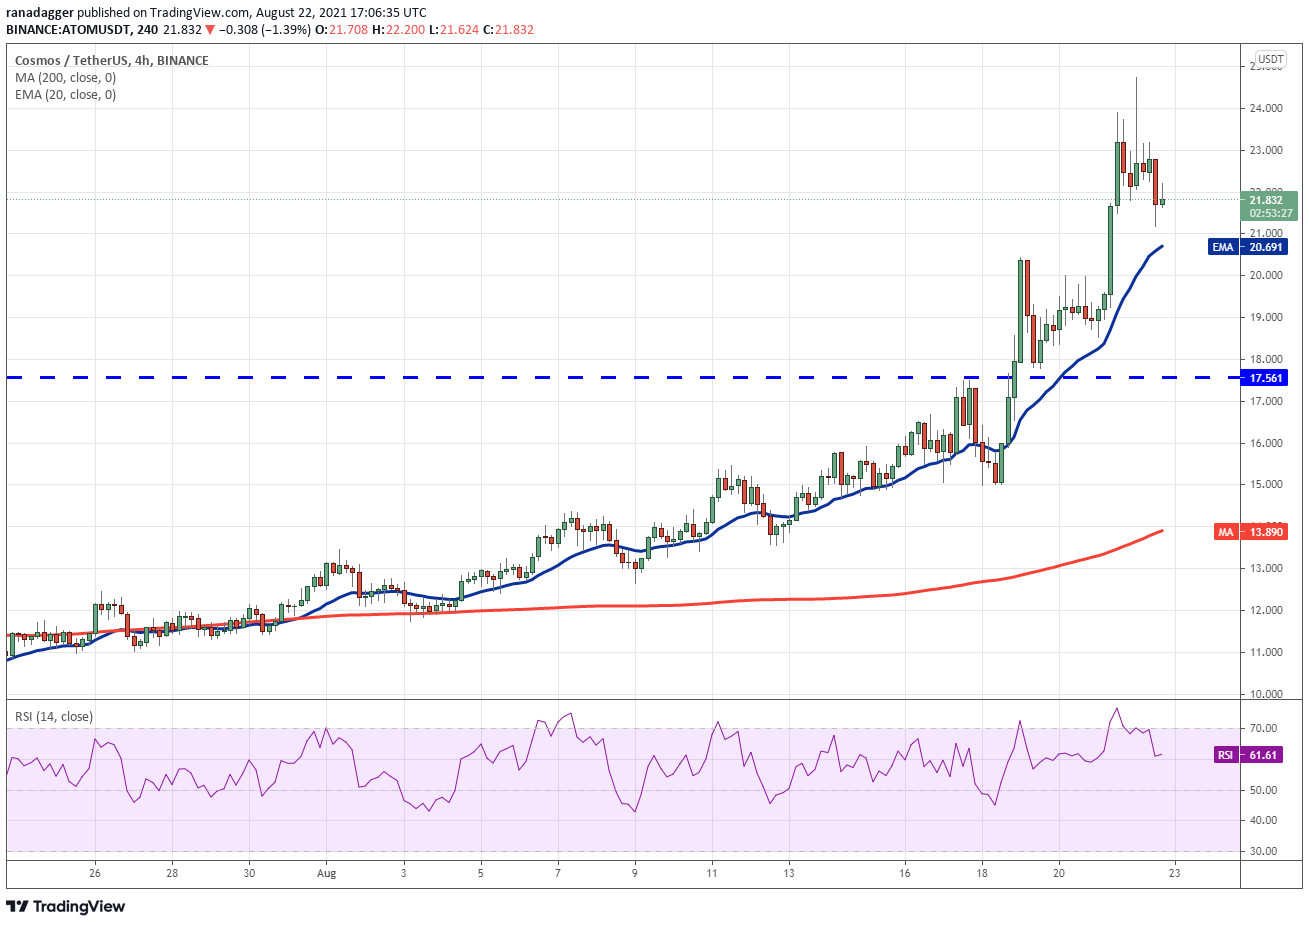
A positive sign is that buyers are not dumping their positions in a hurry. The pair could consolidate between $21 and $24 for some time. A breakout and close above $24 will indicate strength and signal the resumption of the up-move.
Alternatively, a break below the 20-EMA will indicate the start of a deeper correction to $17.56.
The views and opinions expressed here are solely those of the author and do not necessarily reflect the views of Cointelegraph. Every investment and trading move involves risk, you should conduct your own research when making a decision.

Leave A Comment