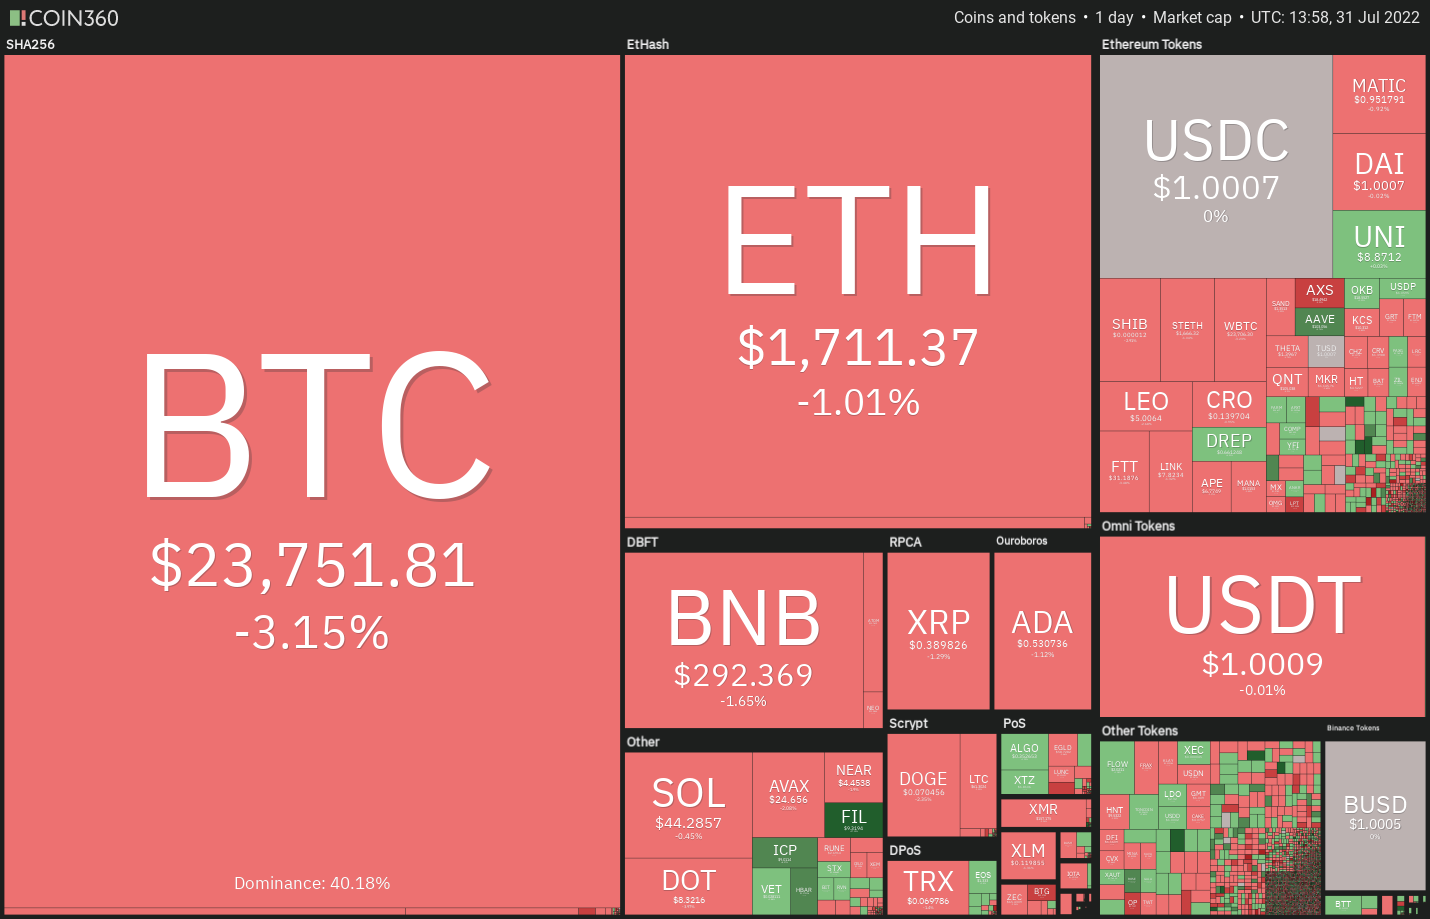
Bitcoin (BTC) has made a strong comeback in the month of July and is on track for its best monthly gains since October 2021. The sharp recovery in Bitcoin and several altcoins pushed the Crypto Fear and Greed Index to 42/100 on July 30, its highest level since April 6.
Investors seem to be making the most of the depressed levels in Bitcoin. Data from on-chain analytics firm Glassnode shows that Bitcoin in exchange wallets has dropped to 2.4 million Bitcoin in July, down from the March 2020 levels of 3.15 million Bitcoin. This has sent the metric to its lowest level since July 2018.
Could Bitcoin extend its rally in the short term and could that trigger buying in select altcoins? Let’s study the charts of the top-5 cryptocurrencies that may outperform in the near term.
BTC/USDT
Attempts by the bulls to sustain the price above $24,276 have failed in the past two days, indicating that the bears are defending the level with vigor. However, a minor positive is that the bulls have not ceded ground to the bears.
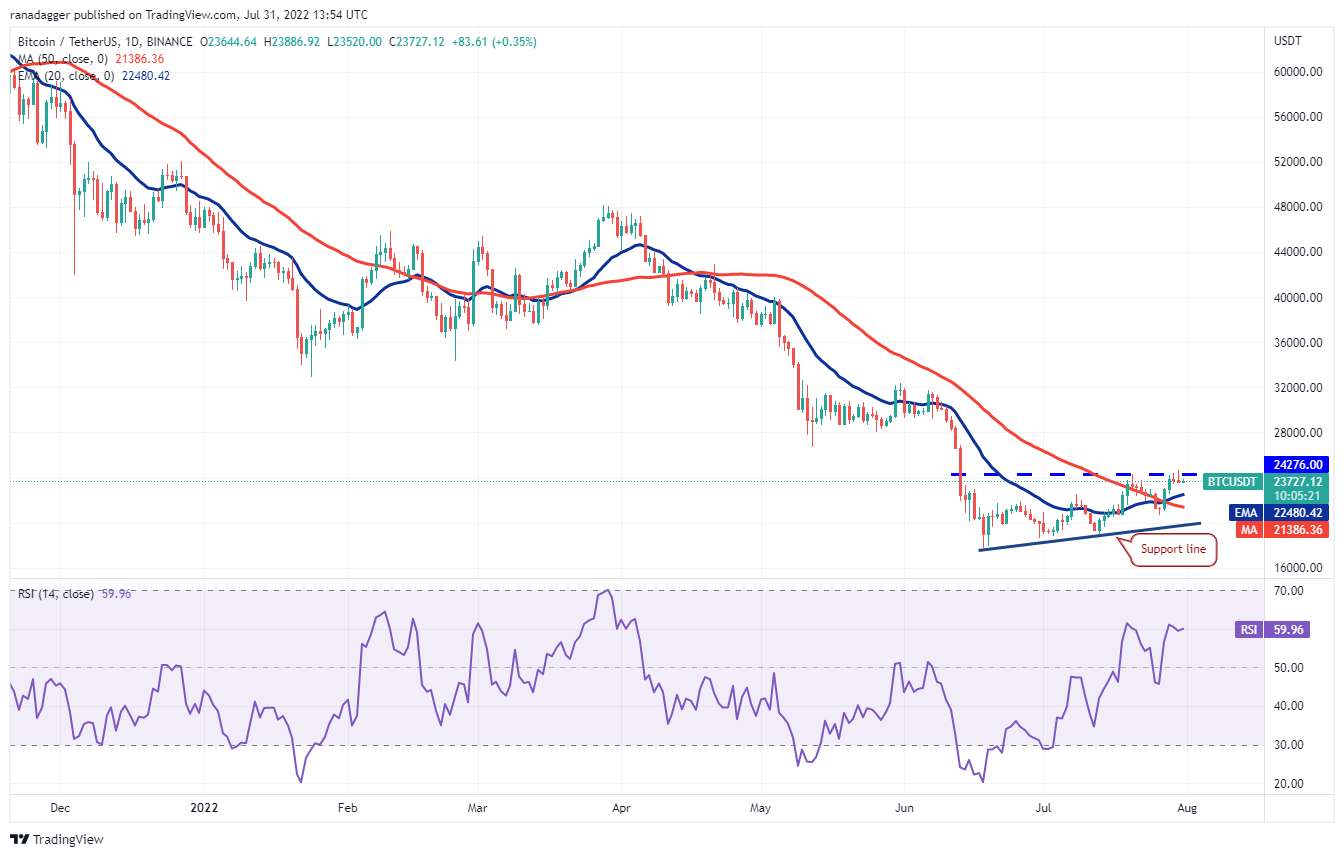
The upsloping 20-day exponential moving average ($22,480) and the relative strength index (RSI) in the positive territory indicate that bulls have the upper hand.
To invalidate this bullish view in the short term, the bears will have to sink the price below the 20-day EMA. That could clear the path for a possible drop to the 50-day simple moving average ($21,386) and then to the support line. A break below this level will suggest that bears are back in command.
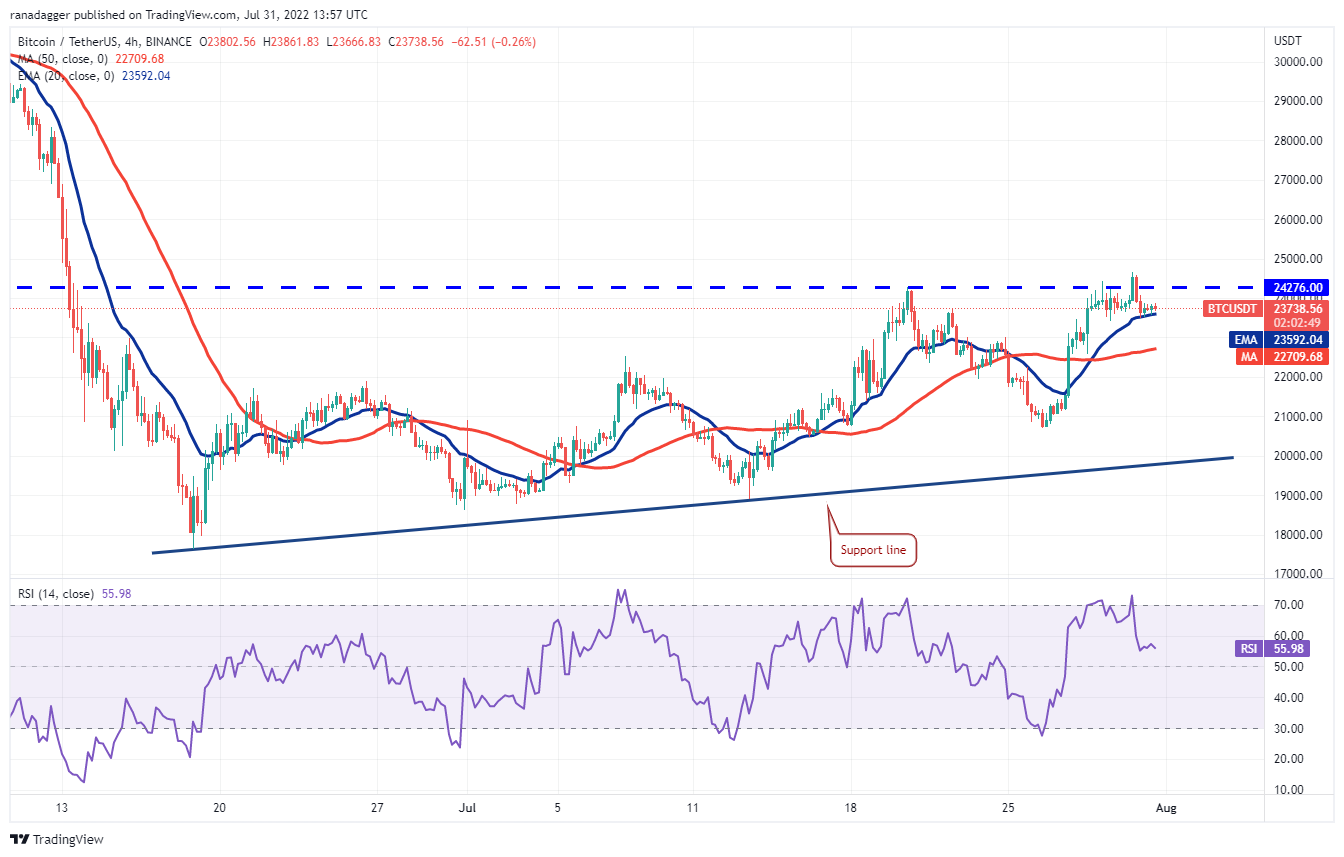
If the price rebounds off the current level, the bulls will have another shot at the overhead zone between $24,276 and $24,668. If this zone is scaled, the bullish momentum could pick up further. Conversely, if bears sink the price below the 20-EMA, the pair could drop to the 50-SMA.
BNB/USDT
Binance Coin (BNB) broke above the downtrend line on July 28, indicating a potential trend change. The up-move is facing resistance near the psychological level of $300 but a positive sign is that the buyers have not given up much ground. This suggests that the bulls are not hurrying to book profits.
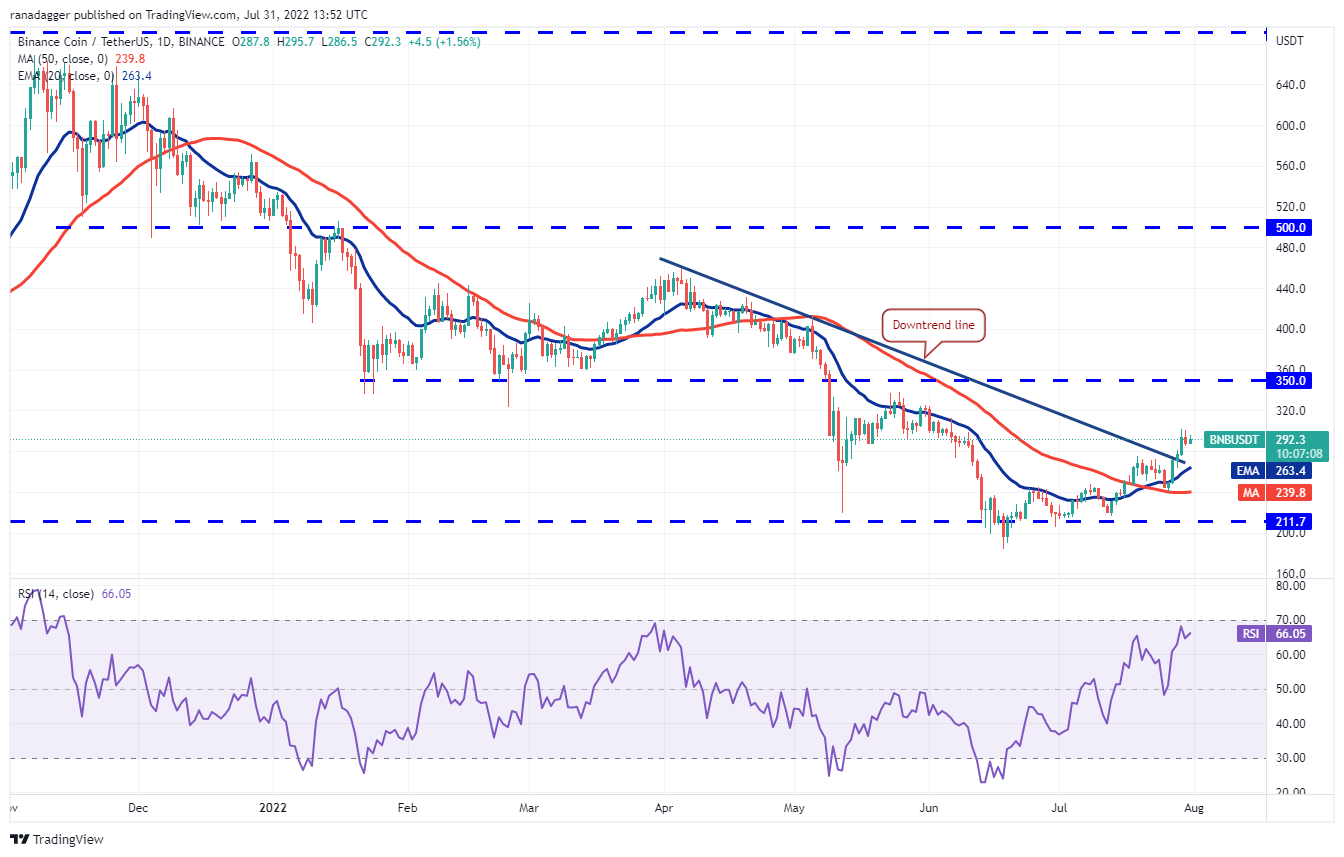
Alternatively, if the price turns down and breaks below $285, the pair could drop to the downtrend line. The 20-day EMA is placed close to this level, hence it becomes an important support to keep an eye on. If bears sink the price below the 20-day EMA, the pair could decline to the 50-day SMA ($239).
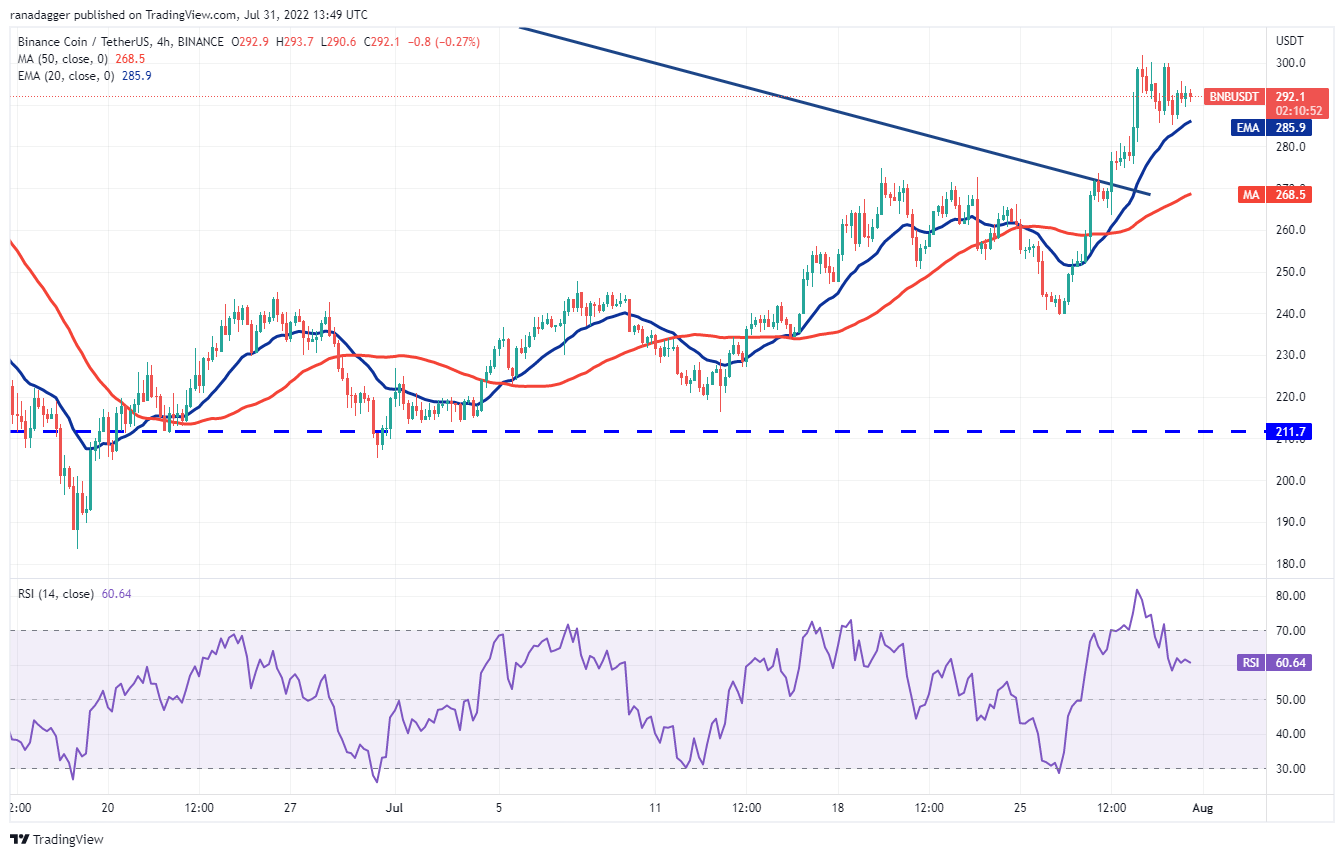
This positive view could invalidate in the short term if the price turns down and breaks below the 20-EMA. If that happens, the pair could slide to the 50-SMA. The buyers are expected to defend this level aggressively because a break and close below it could open the doors for a decline to $239.
UNI/USDT
Uniswap (UNI) rebounded off the breakout level of $6.08 on July 26, indicating strong buying on dips. The up-move reached near the psychological resistance at $10 on July 28 where the bears are mounting a strong defense.
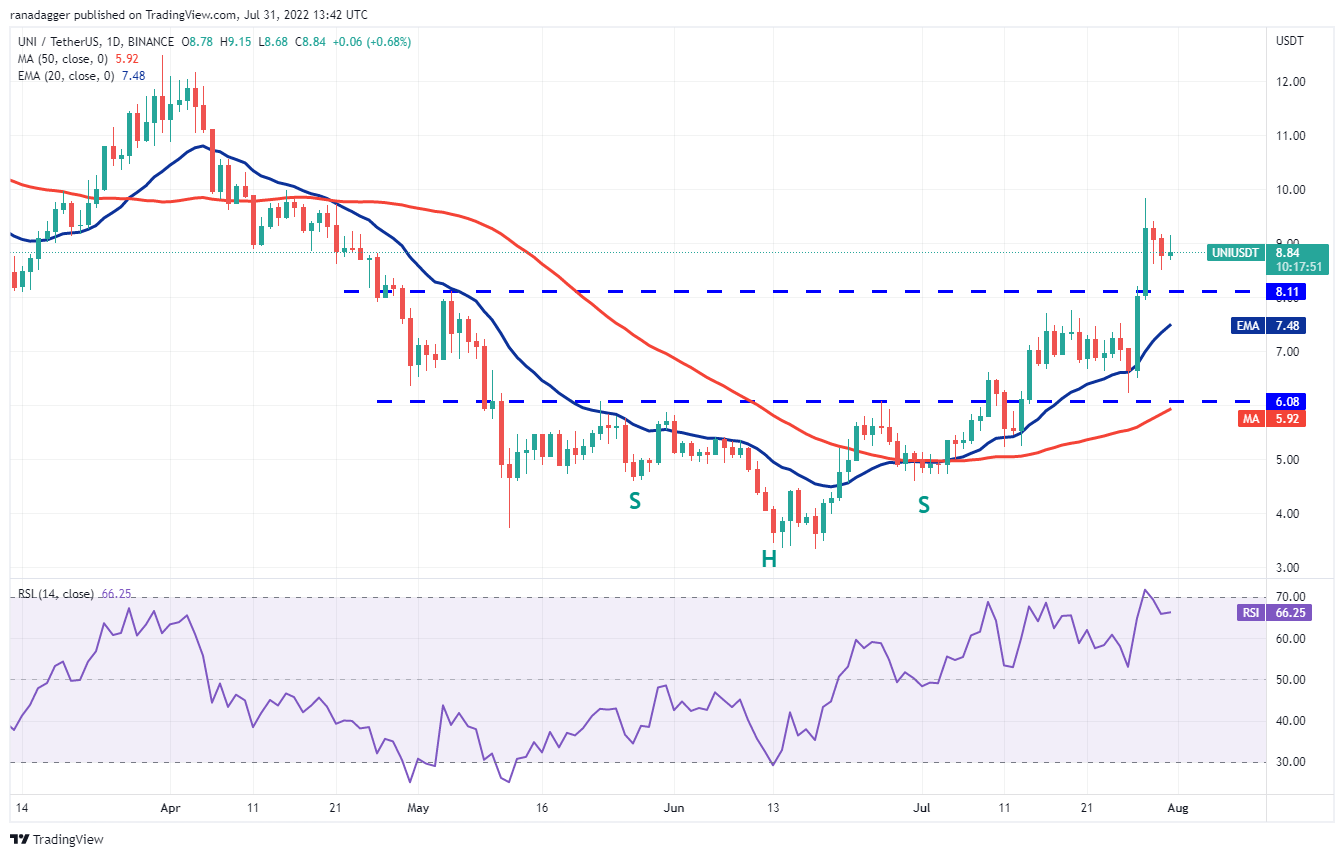
A strong rebound off $8.11 could open the doors for a retest at $10. The bulls will have to clear this overhead hurdle to indicate the start of the next leg of the up-move to $12.
Conversely, if the price turns down and breaks below $8.11, the UNI/USDT pair could drop to the 20-day EMA ($7.48). A break and close below this level will suggest that the bullish momentum has weakened.
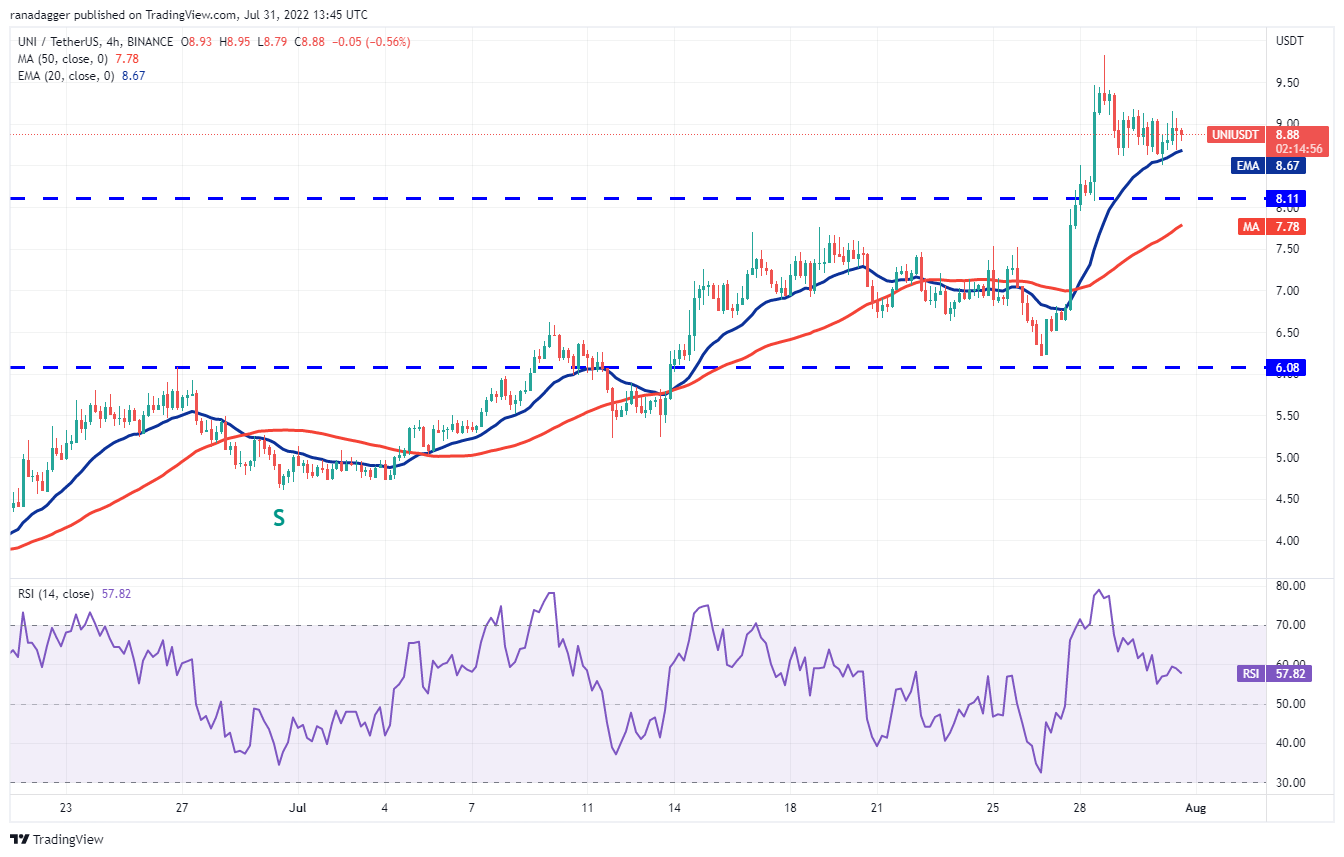
Alternatively, if the price breaks below the 20-EMA, it will suggest that supply exceeds demand. The pair could then drop to the zone between $8.11 and the 50-SMA. This is an important zone for the bulls to defend because if they fail to do that, the short-term momentum could tilt in favor of the bears.
Related: Hong Kong university to inaugurate mixed reality classroom in Metaverse
FIL/USDT
After staying in a tight range for several days, Filecoin (FIL) broke out sharply on July 30, signaling a potential trend change. The RSI has risen into the overbought territory which is another sign that the downtrend may be ending.
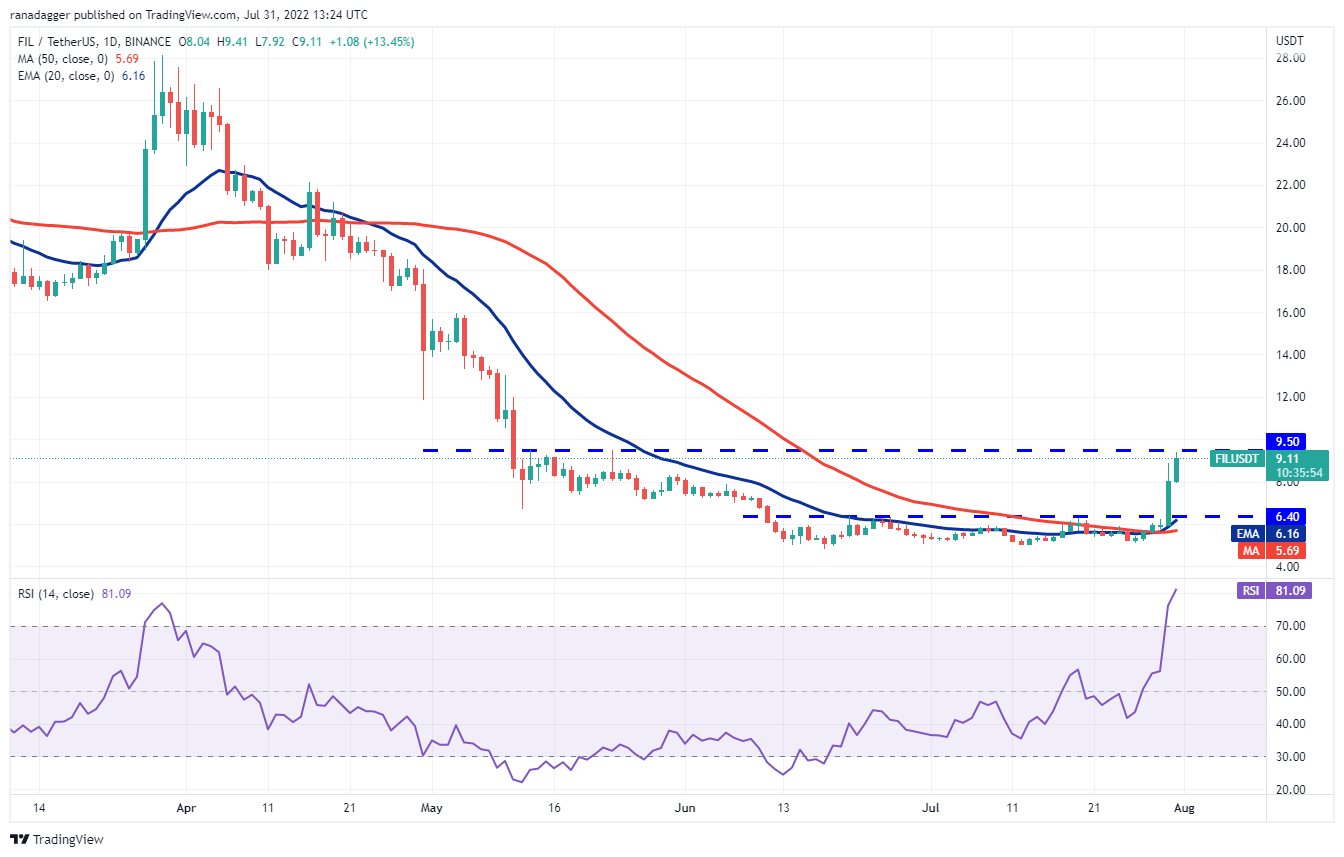
If the price turns down from the current level and breaks back below $6.55, it will suggest that bears are active at higher levels. The pair may thereafter oscillate in a large range between $5 and $9.50 for a few days.
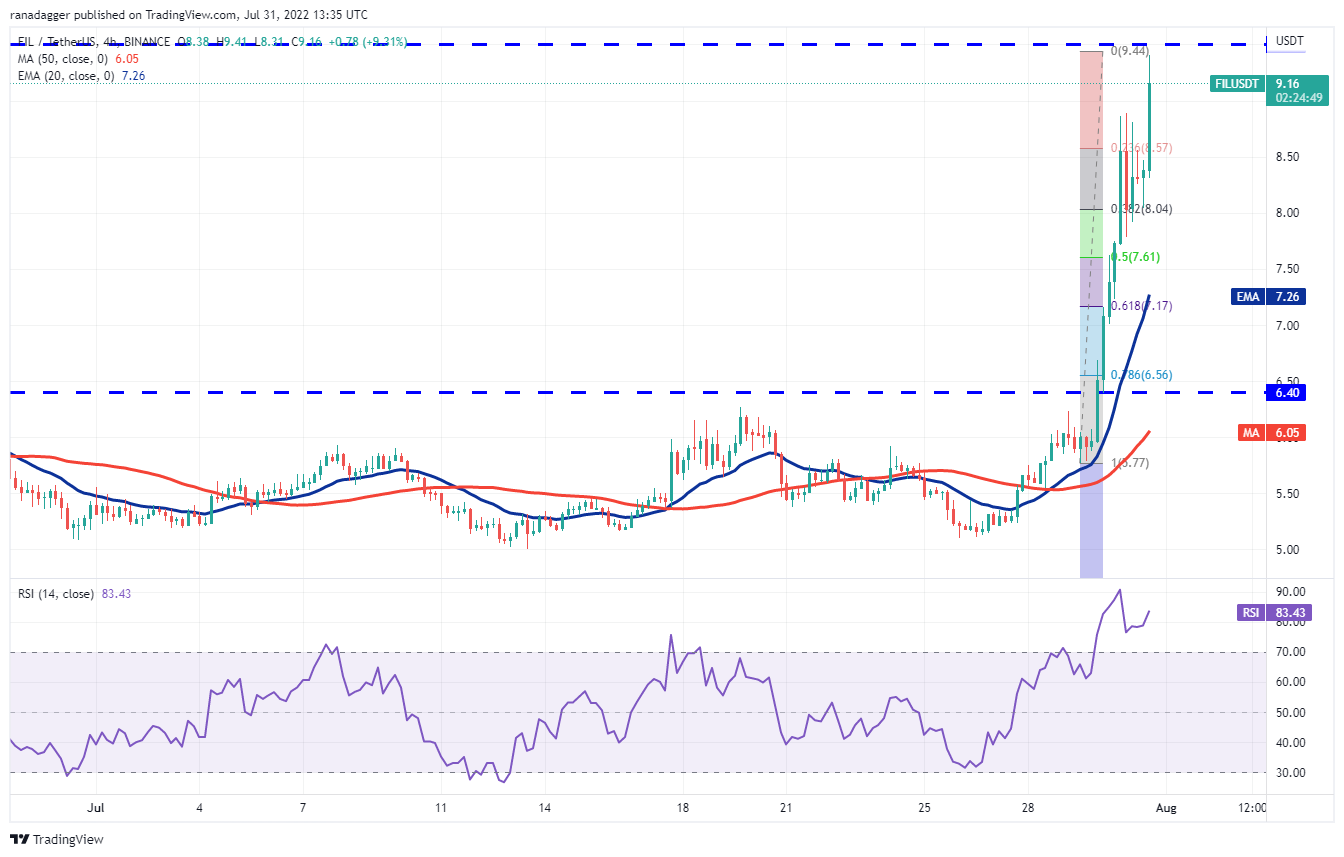
If the price turns down from the current level, the bulls will attempt to arrest the pullback at the 38.2% Fibonacci retracement level of $8.04. A strong bounce off this level will increase the possibility of a break above $9.50. If that happens, the pair could rally to $10.82. This bullish view could invalidate below $7.70.
THETA/USDT
Theta Network (THETA) has been consolidating between $1 and $1.55 for the past several days. The bulls tried to push the price above the overhead resistance on July 30 but the bears held their ground.
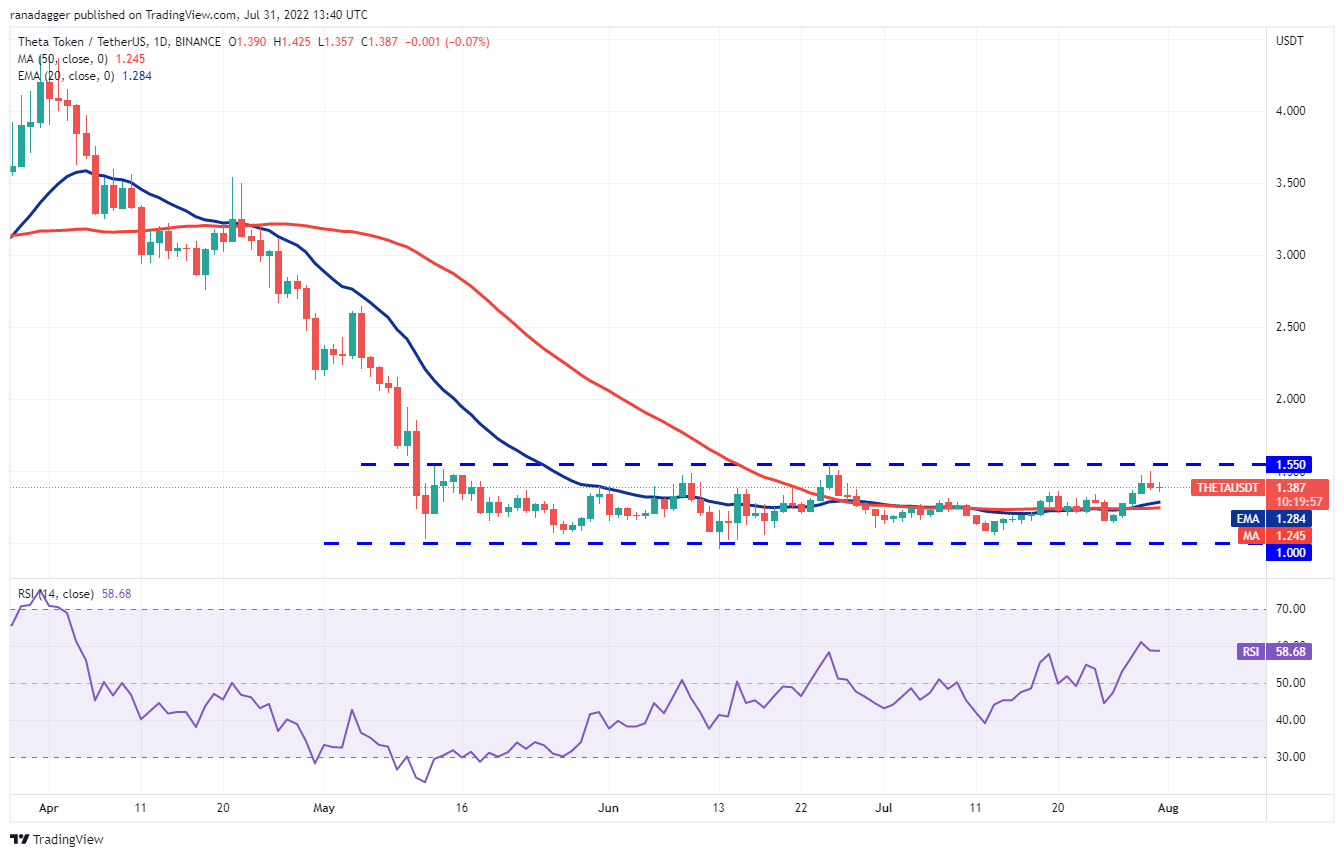
Contrary to this assumption, if the price breaks below the moving averages, the bears will try to pull the pair to $1. Such a move could indicate that the range-bound action may continue for a few more days.
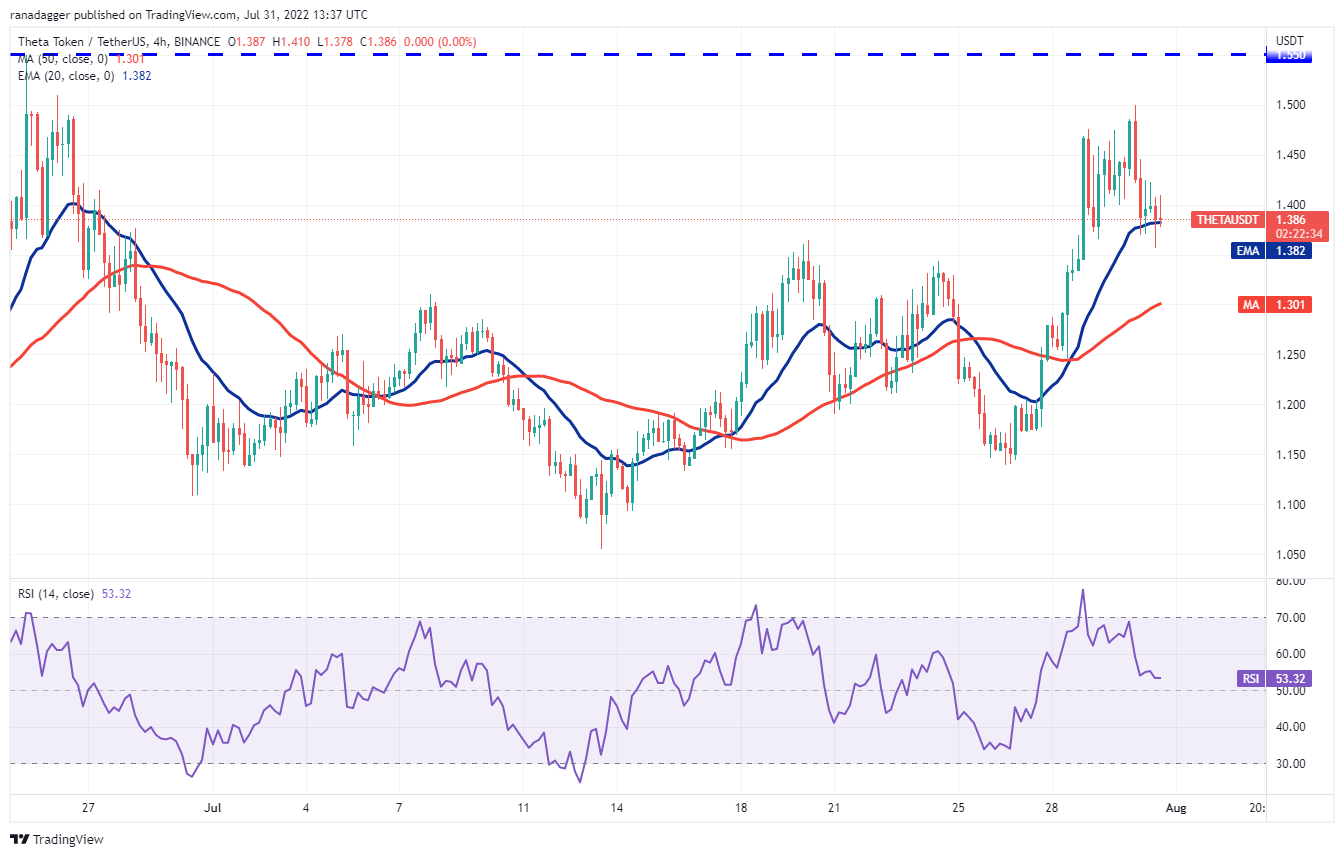
If the price sustains below the 20-EMA, the pair could drop to the 50-SMA. This is an important level for the bulls to defend because a break below it could sink the pair to $1.15.
Alternatively, if the price rebounds off the moving averages with strength, it will suggest that lower levels are attracting buyers. If bulls push the price above $1.42, a retest of the $1.50 to $1.55 resistance zone is possible.
The views and opinions expressed here are solely those of the author and do not necessarily reflect the views of Cointelegraph. Every investment and trading move involves risk, you should conduct your own research when making a decision.

Leave A Comment