Bitcoin (BTC) is struggling to sustain any price level during the current pullback, indicating a lack of demand at higher levels. Does this mean that the bull trend is over and the institutional investors are abandoning the crypto markets?
No! It is the other way around. Glassnode’s weekly newsletter pointed out that the Grayscale Bitcoin Trust (GBTC) premium is rising, suggesting that institutional investors are accumulating at lower levels.
GBTC is not alone, another popular vehicle for institutional investors, the Canadian Purpose Bitcoin exchange-traded fund has also witnessed strong capital inflows. According to analysts at Glassnode, this shows “early signs of renewed institutional interest.”
Now that the monthly options and futures expiry has passed, investors are likely wondering if Bitcoin could start a sharp recovery next week and which altcoins will rally if that happens.
Let’s look at 5 cryptocurrencies that could start trending moves this week.
BTC/USDT
Bitcoin’s brief breakout could not clear the hurdle at the 200-day simple moving average ($41,014) on May 26 and 27, indicating the bears are defending this level aggressively. The downsloping 20-day exponential moving average ($41,327) and the relative strength index (RSI) near the oversold zone suggest the bears are in control.
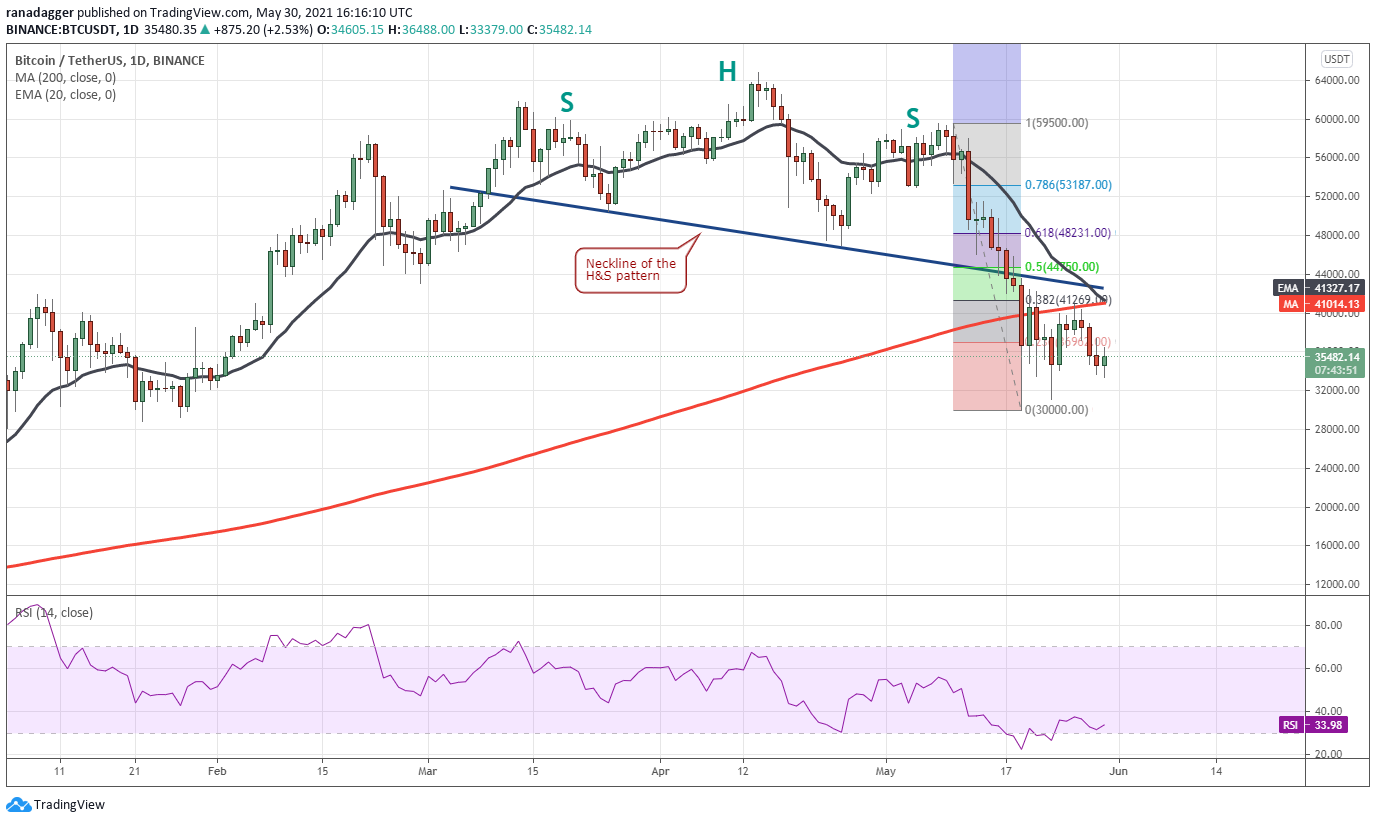
The longer the price stays below the 200-day SMA, the more difficult it will become for the bulls to start the next leg of the uptrend.
However, if the price turns up from the current level and rises above the 200-day SMA, it will suggest strong buying at lower levels. That could clear the path for a possible rally to the 61.8% Fibonacci retracement level at $48,231.
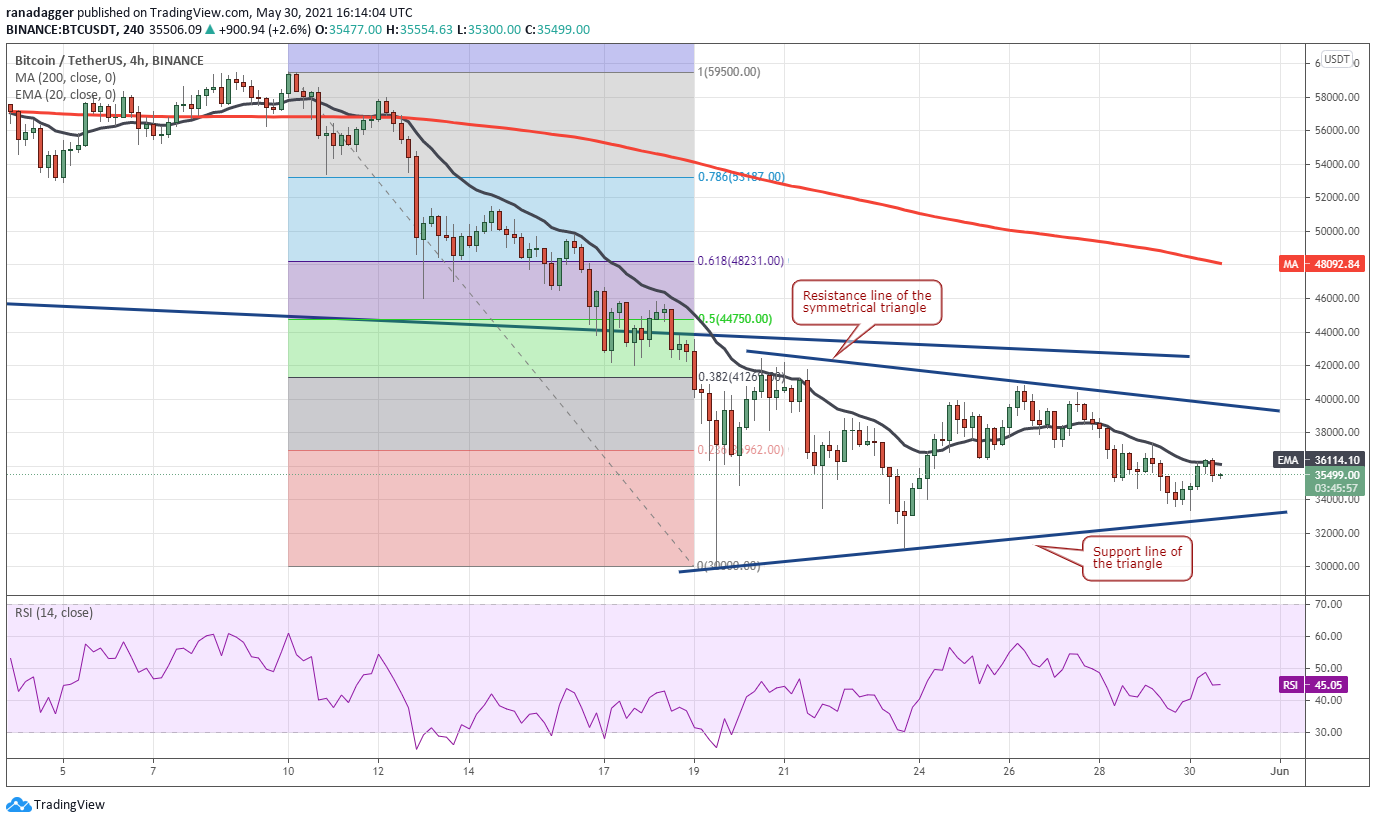
On the other hand, the setup may act as a reversal pattern if bulls push and sustain the price above the resistance line of the triangle. Such a move will suggest the downtrend is over and the pair could rally to the target objective at $51,951.
MATIC/USDT
Polygon (MATIC) has bounced off the 20-day EMA ($1.58) today, indicating that bulls are buying on dips to this support. The upsloping 20-day EMA and the RSI in the positive territory indicate the path of least resistance is to the upside.
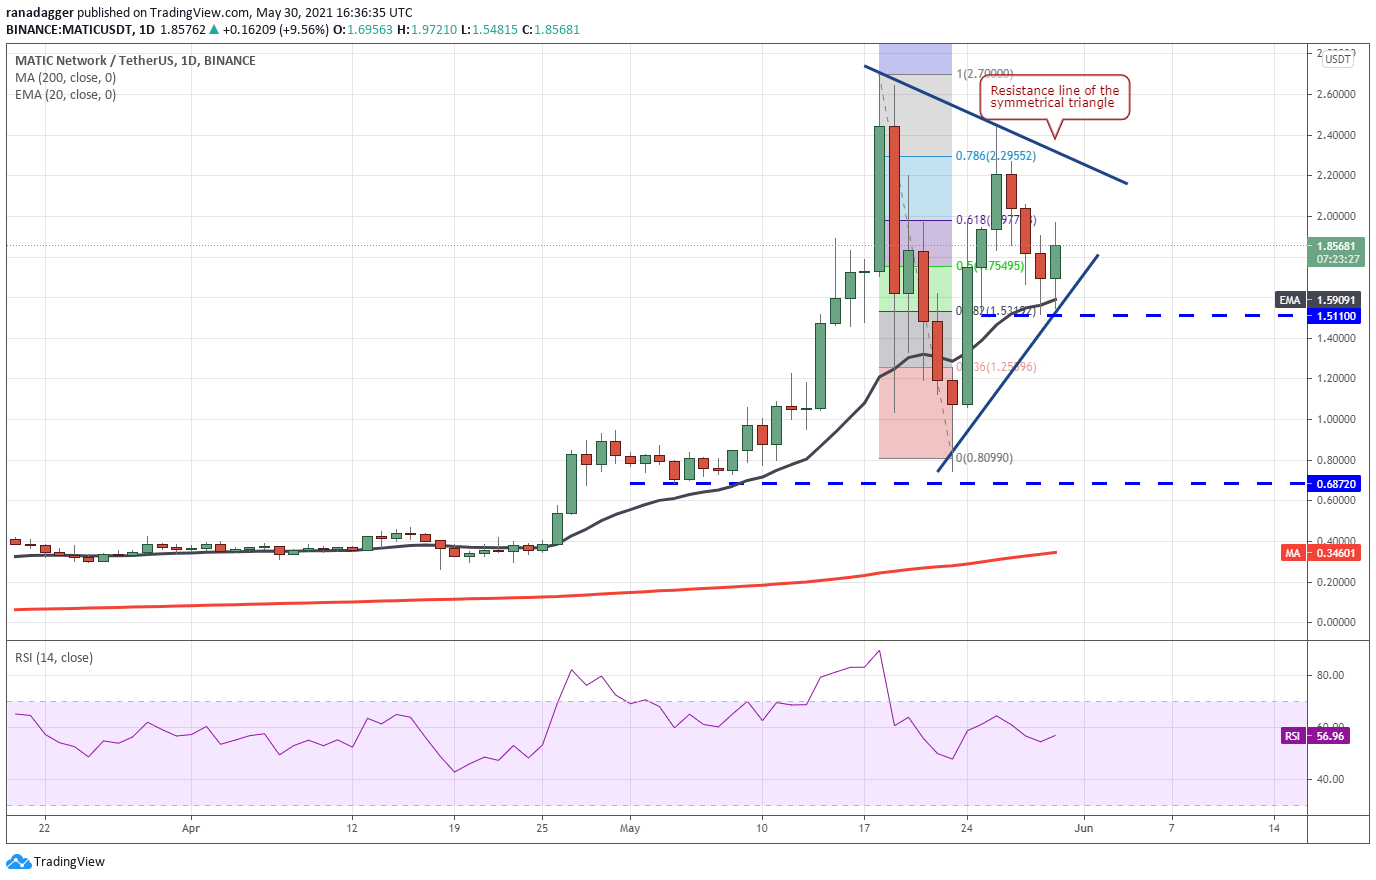
Contrary to this assumption, if the price turns down from the resistance line of the triangle, the pair could extend its stay inside the triangle. A break and close below the triangle will signal weakness and could result in a drop to $0.80.
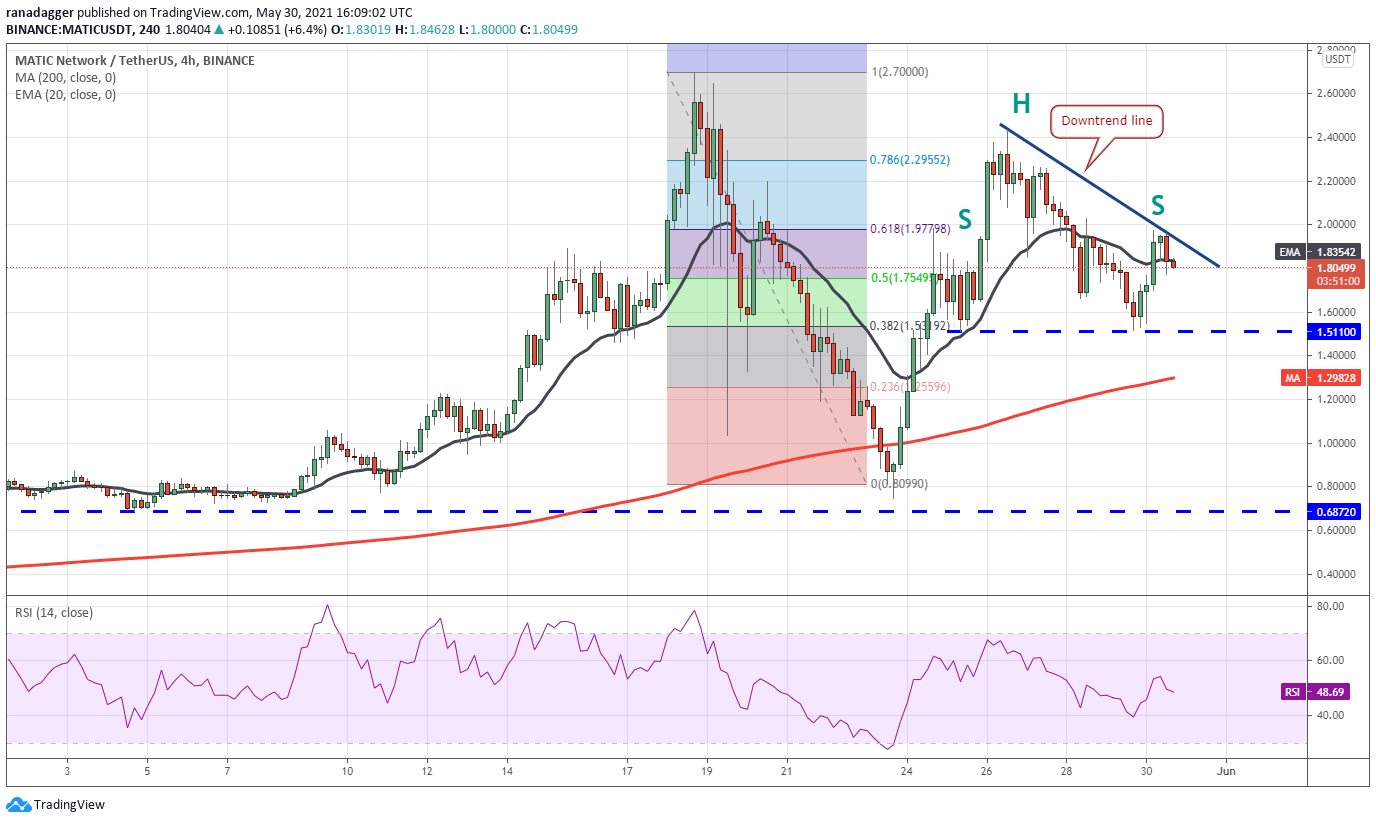
Conversely, if buyers propel the price above the downtrend line, the bullish momentum could pick up and the pair could challenge the $2.43 resistance. A break above this level could result in a rally to $2.70.
EOS/USDT
EOS attempted a recovery, which fizzled out at the 38.2% Fibonacci retracement level at $7.89 on May 27. However, the positive sign is that the bulls have not allowed the price to dip below the $5.60 support. This indicates that traders are not waiting for a deeper fall to buy.
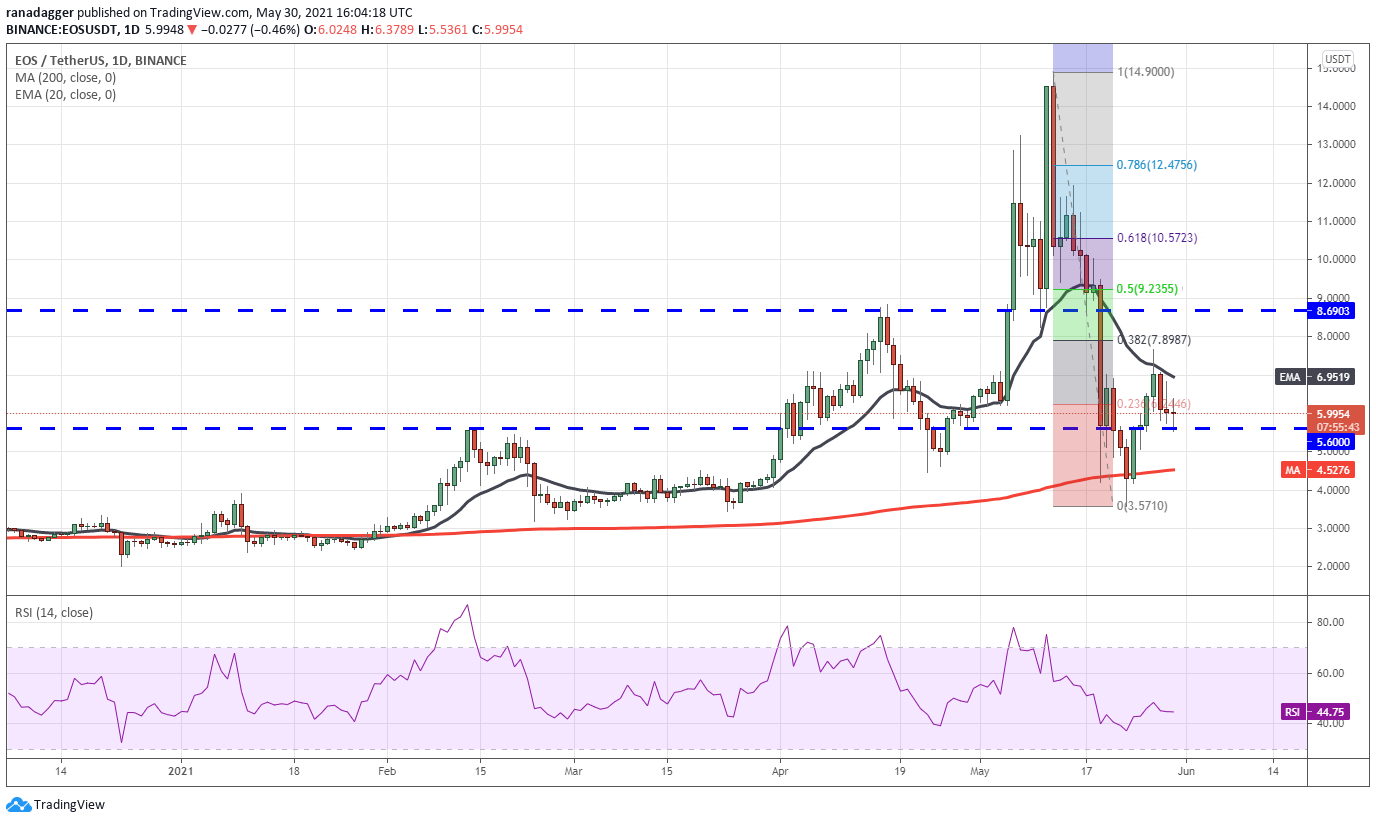
This bullish view will invalidate if the bears stall the next pullback attempt at the 20-day EMA or at $7.89. Such a move will increase the possibility of a break below $5.60. If that happens, the EOS/USDT pair could drop to the 200-day SMA ($4.52) and then to $3.57.
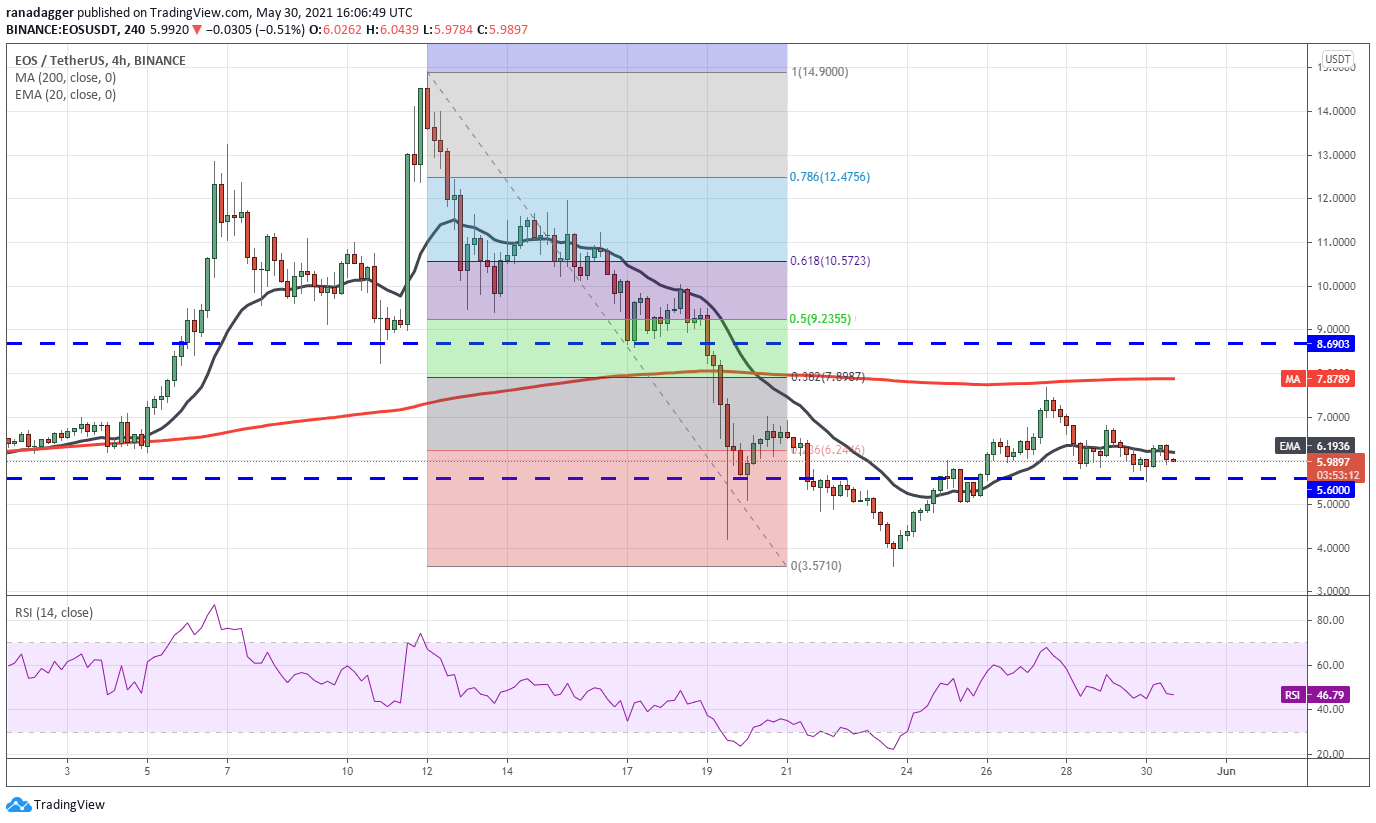
If bulls push the price above $6.81, the pair could rally to the 200-SMA and then to $8.69. A breakout and close above this resistance will signal that bulls are back in the game. Alternatively, if the bears sink the price below the $5.60 to $5 support zone, the pair could drop to $3.57.
XMR/USDT
Repeated attempts by the bears to sink Monero (XMR) below the 200-day SMA ($222) have failed in the past few days. This suggests that bulls are accumulating at the current levels.
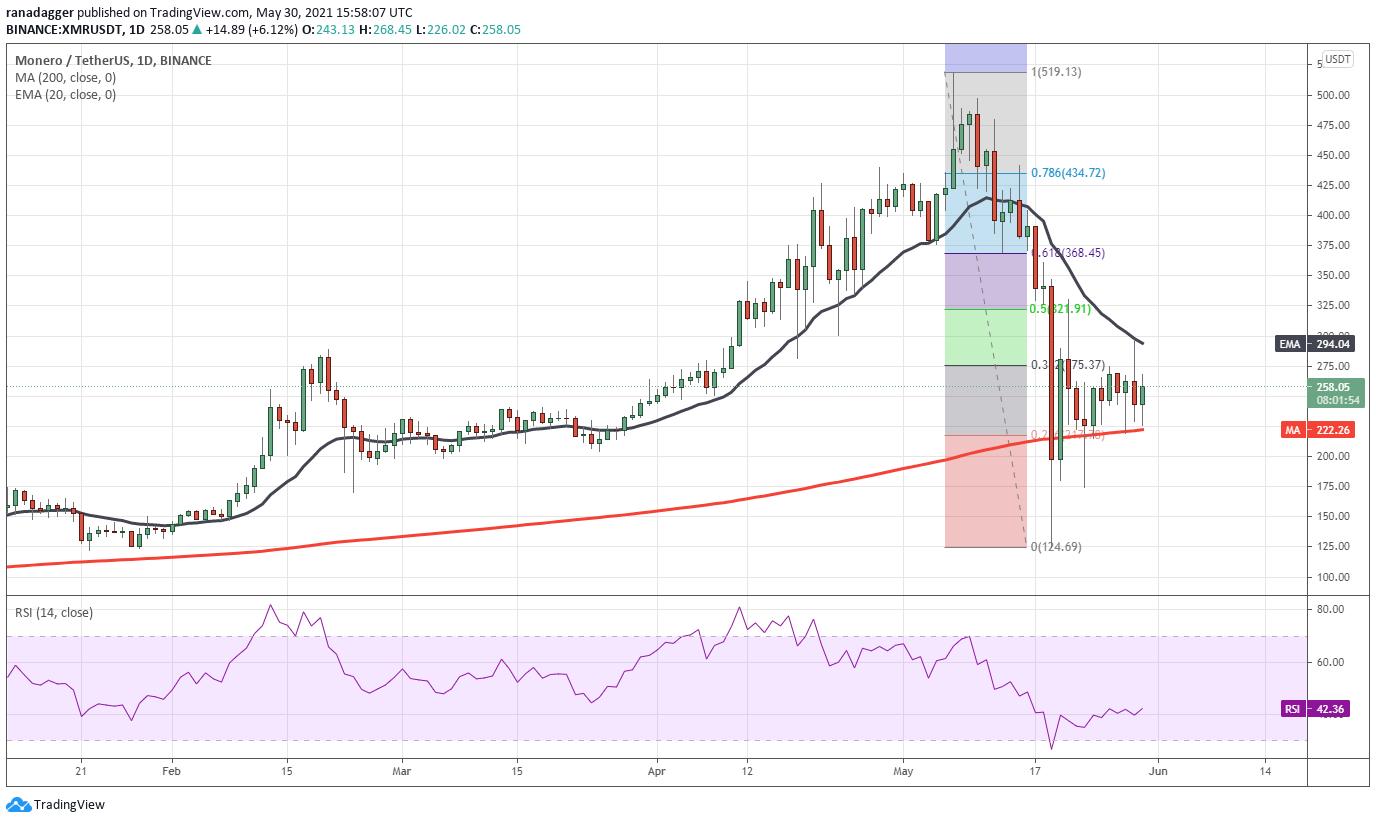
If they succeed, the XMR/USDT pair could start a relief rally that may reach the 61.8% Fibonacci retracement level at $368.45. This level may act as a stiff resistance because traders who had bought at higher levels may close their positions.
This positive view will nullify if the price turns down and plummets below the 200-day SMA. In such a case, the pair may drop to $175 and then to $124.69.
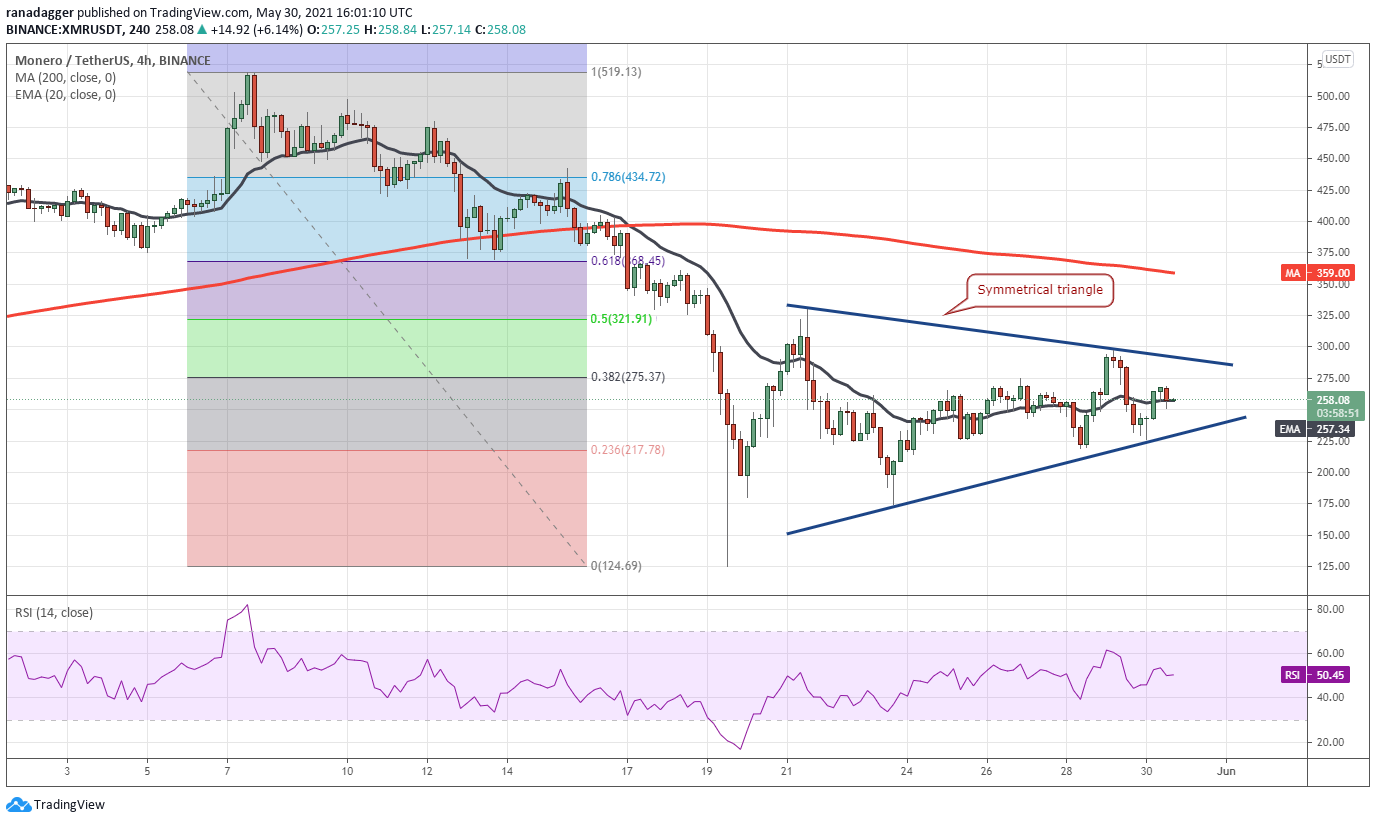
This advantage will tilt in favor of the bulls if they can push and sustain the price above the triangle. The price could then rally to the 200-SMA, which may act as a stiff resistance.
On the contrary, if the price turns down and breaks below the triangle, the pair could drop to $175 and then to $124.69.
AAVE/USDT
AAVE is attempting to rebound off the strong support at $280. This level has not been broken on a closing basis since Jan. 26, hence the bulls are likely to defend it aggressively. The 200-day SMA ($290) just above the level is an added advantage.
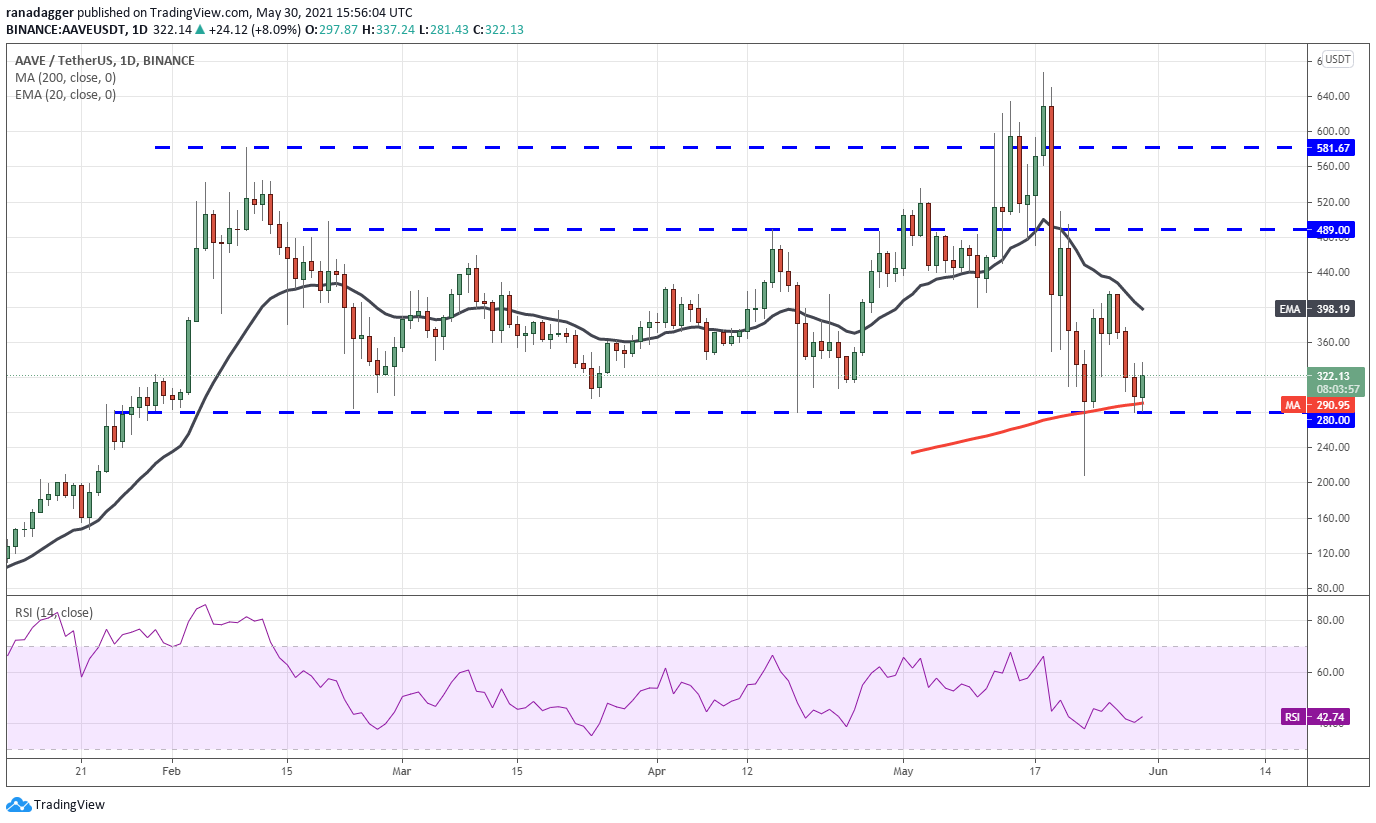
A break and close below this support could start a downtrend and the decline could extend to $160. Conversely, if the bulls drive the price above the 20-day EMA, the pair could rise to $489, which is likely to act as a stiff resistance.
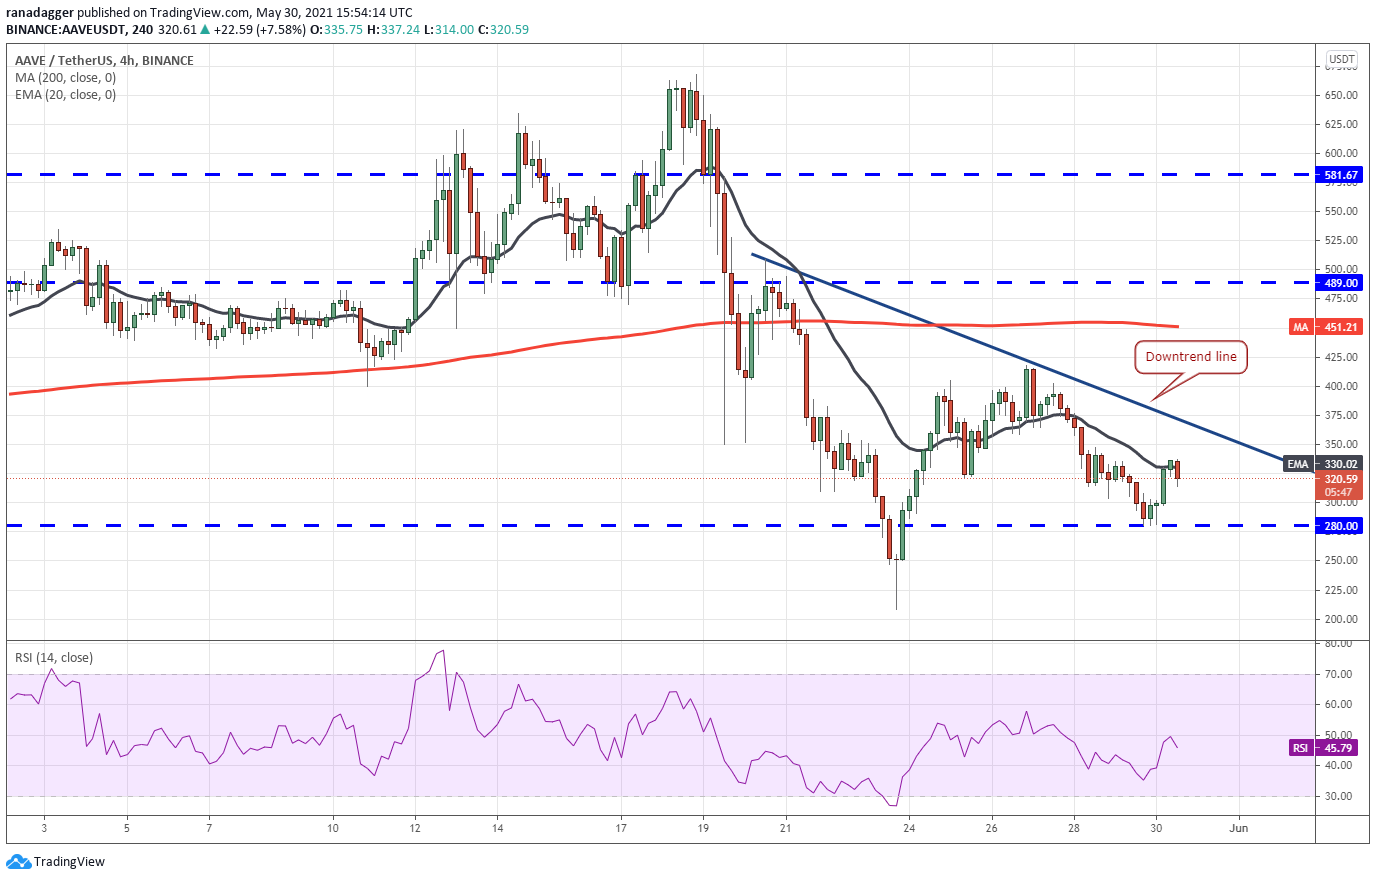
This positive view will invalidate if the price turns down from the 20-EMA or the downtrend line and plummets below $280. If that happens, the bears will try to pull the price below the May 23 low at $208.09 and start the downtrend.
The views and opinions expressed here are solely those of the author and do not necessarily reflect the views of Cointelegraph. Every investment and trading move involves risk, you should conduct your own research when making a decision.

Leave A Comment