
Bitcoin (BTC) plummeted to $17,622 on June 18. This marked the first time in Bitcoin’s history that it has fallen below its previous cycle high. The United States Federal Reserve’s aggressive monetary tightening, a crisis at crypto lending platform Celsius and liquidity issues at investment fund Three Arrows Capital are creating a sense of panic among traders.
Markets commentator Holger Zschaepitz said that Bitcoin has crashed more than 80% four times in history. That puts the current fall of about 74% within historical standards. Previous bear markets have bottomed out just below the 200-week moving average, according to market analyst Rekt Capital. If history repeats itself, Bitcoin is unlikely to stay at the current depressed levels for a long time.

Could bulls arrest the decline in Bitcoin in the short term? If that happens, let’s study the charts of the top-5 cryptocurrencies that may outperform the other coins.
BTC/USDT
Bitcoin plummeted below the crucial support of $20,111 on June 18, indicating the resumption of the downtrend. A minor positive is that the bulls purchased the dip as seen from the long tail on the day’s candlestick.
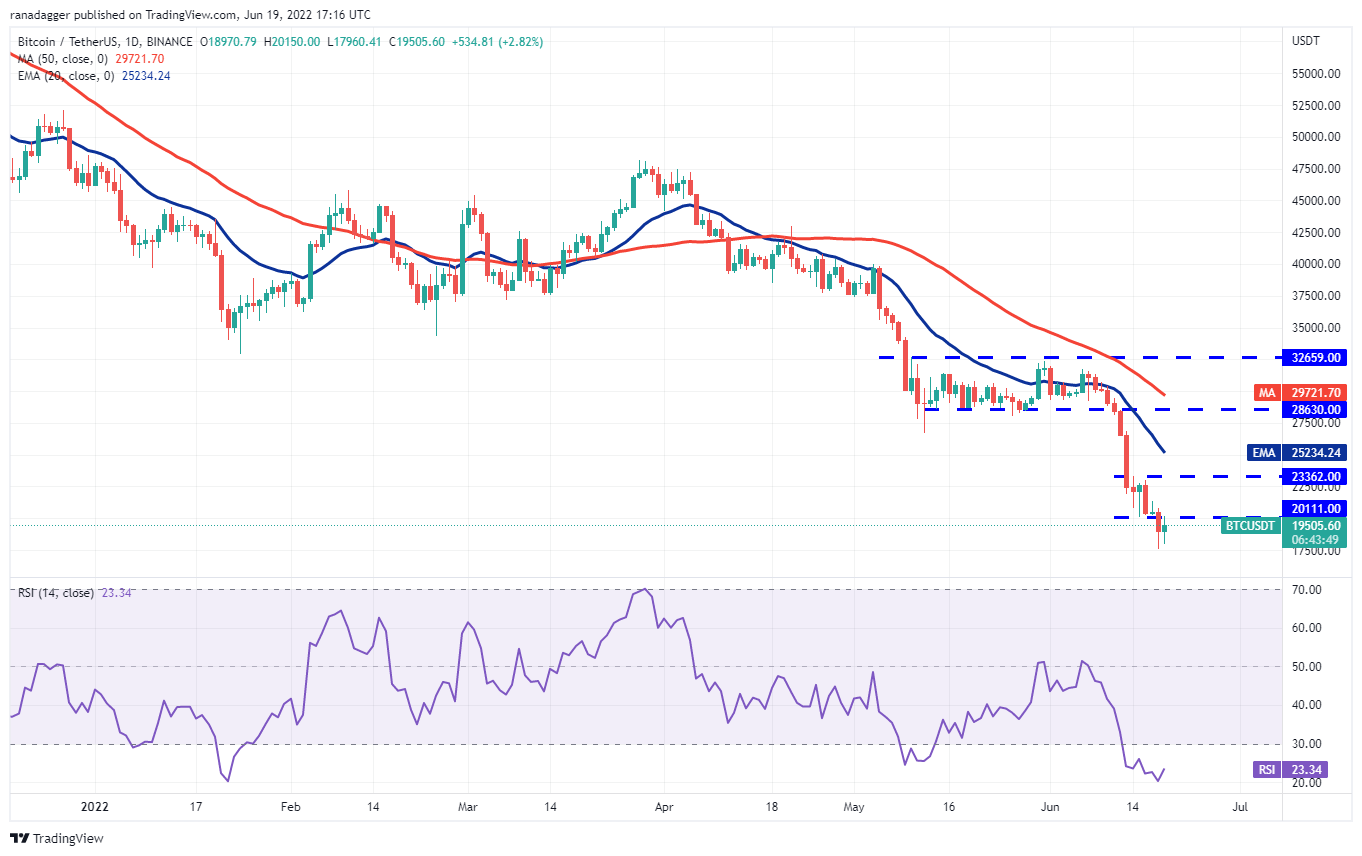
The relative strength index (RSI) has been trading in the oversold zone for the past few days which suggests a relief rally in the near term.
This positive view could invalidate if the price turns down from $20,111. That will suggest the bears have flipped the level into resistance and increase the possibility of a break below $17,622. The next support on the downside is $16,000.

This is an important level for the bears to watch out for because a break and close above it could push the pair to the overhead resistance zone between the 50-simple moving average and $23,362.
Conversely, if the price fails to sustain above the 20-EMA, it will suggest that bears are active at higher levels. The sellers will then again try to pull the pair to $17,622.
SOL/USDT
Solana (SOL) has been in a strong downtrend but the positive divergence on the RSI suggests that the bearish momentum could be weakening.

On the contrary, if the price turns down from the 20-day EMA, it will suggest that the bears are in no mood to surrender their advantage. The sellers will then again try to sink the price below $25 and start the next leg of the downtrend.

Conversely, if the price turns down from the current level or the downtrend line and breaks below the moving averages, it will suggest that bears continue to defend the overhead resistance aggressively. That could pull the price to $27.50 and later to $25.
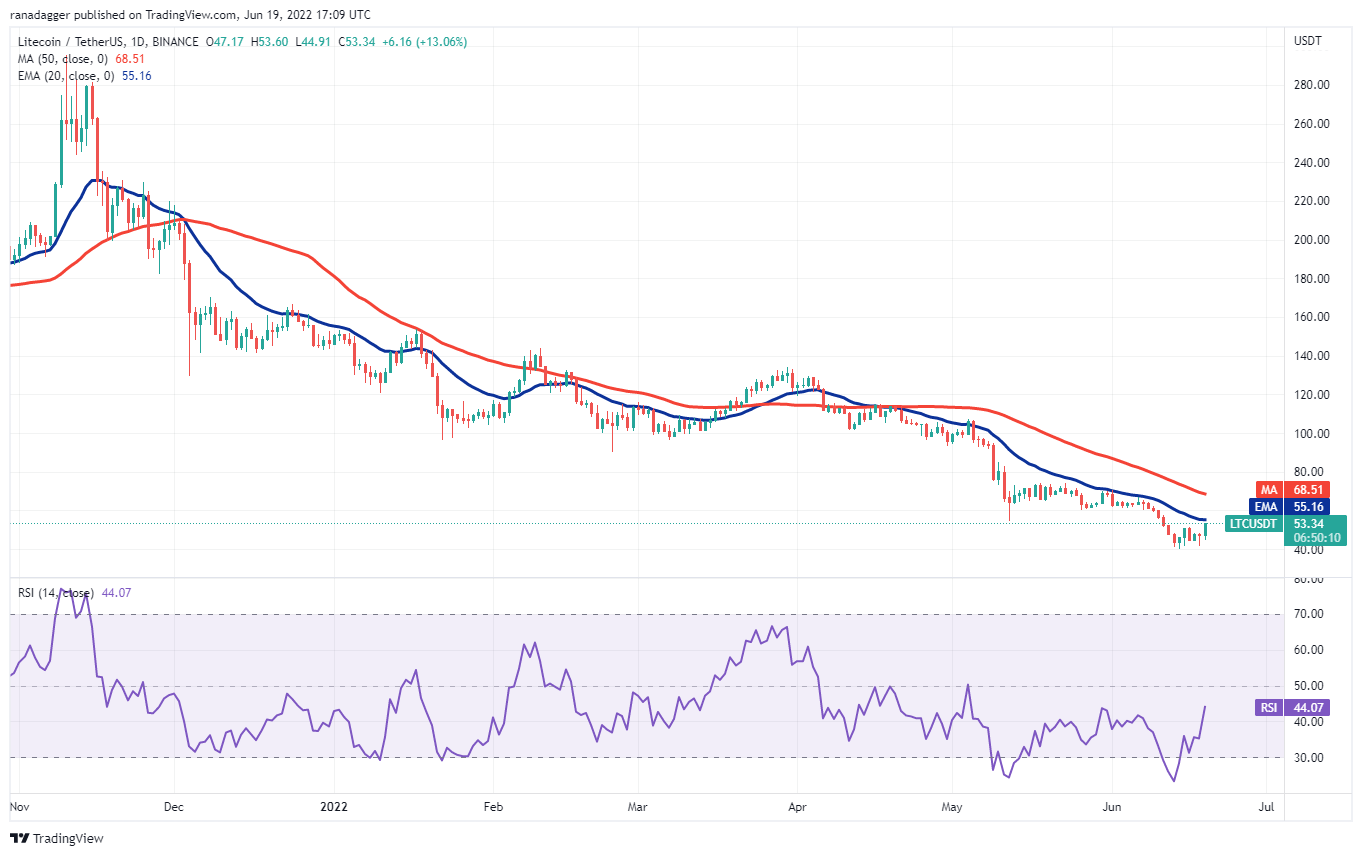
LTC/USDT
The bears attempted to sink Litecoin (LTC) below the strong support at $40 on June 18 but the long tail on the day’s candlestick suggests that the bulls are defending the level aggressively.
Contrary to this assumption, if the price turns down from the 20-day EMA, it will suggest that the trend remains negative and traders are selling on rallies. The bears will then make another attempt to sink the pair below $40 and resume the downtrend.
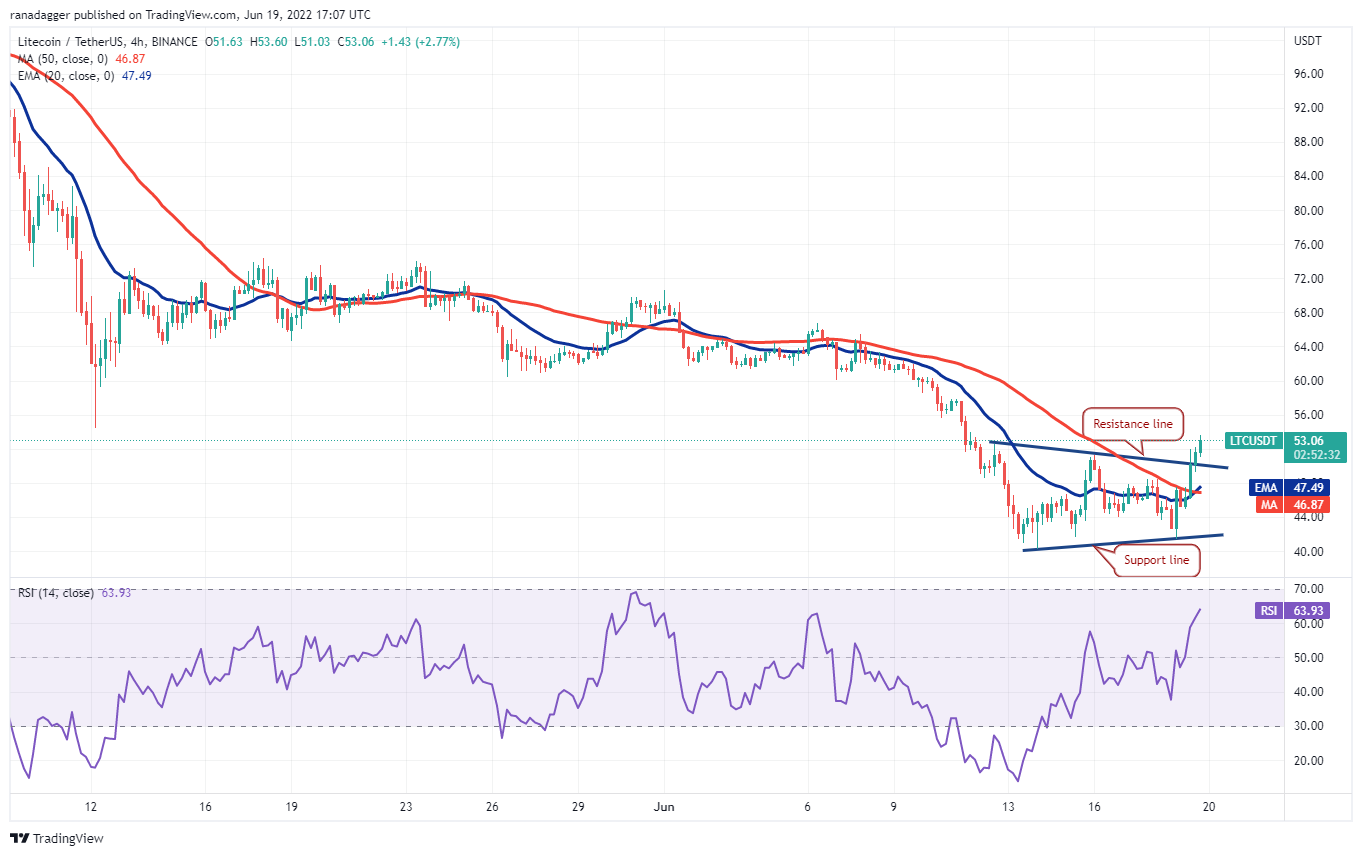
This positive view could invalidate in the short term if the price turns down and re-enters the triangle. Such a move will suggest that the break above the triangle may have been a bull trap.
Related: Elon Musk’s support for Dogecoin grows stronger following $258B lawsuit
LINK/USDT
Chainlink (LINK) is in a downtrend but it is trying to form a bottom near $5.50. The bears pulled the price below this level on June 13, June 14 and June 18 but they could not sustain the lower levels. This suggests that bulls are buying on dips.
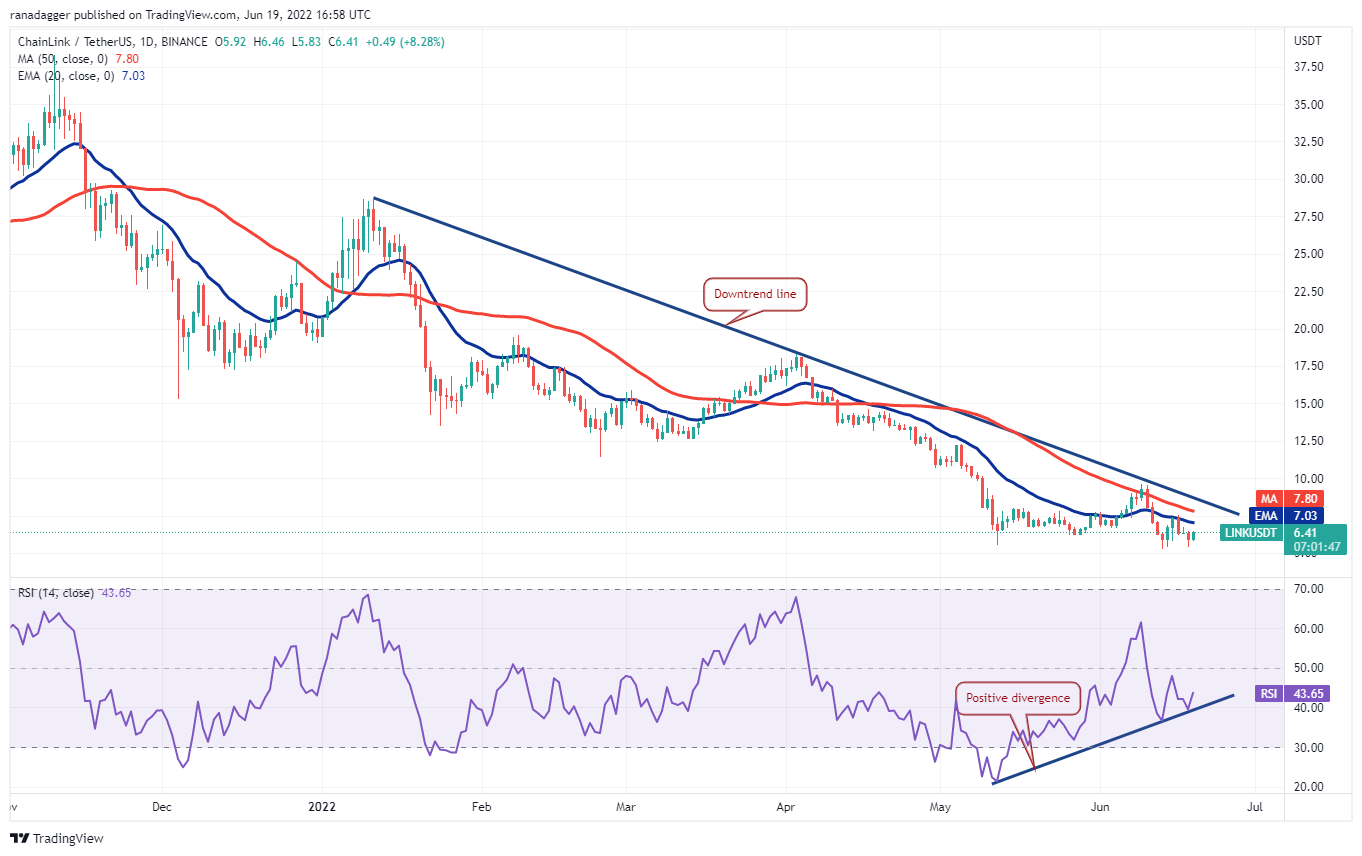
If the price turns down from the downtrend line, the bears will again attempt to sink and sustain the LINK/USDT pair below the $5.50 support. If that happens, it will suggest the resumption of the downtrend.
Alternatively, if buyers thrust the price above the downtrend line, it will suggest a potential trend change. The pair could then rise to $10 and later to $12.

If buyers push the price above the 50-SMA, the pair could rise to $7.51. A break and close above this resistance will complete a double bottom pattern in the short term. This reversal setup has a pattern target of $9.50.
To invalidate this bullish view, the bears will have to pull and sustain the price below the strong support at $5.50.
BSV/USD
Bitcoin SV (BSV) has formed a broadening pattern and the buyers are attempting to push the price above the resistance of the setup. The RSI is showing a positive divergence, indicating that the bearish momentum is weakening.
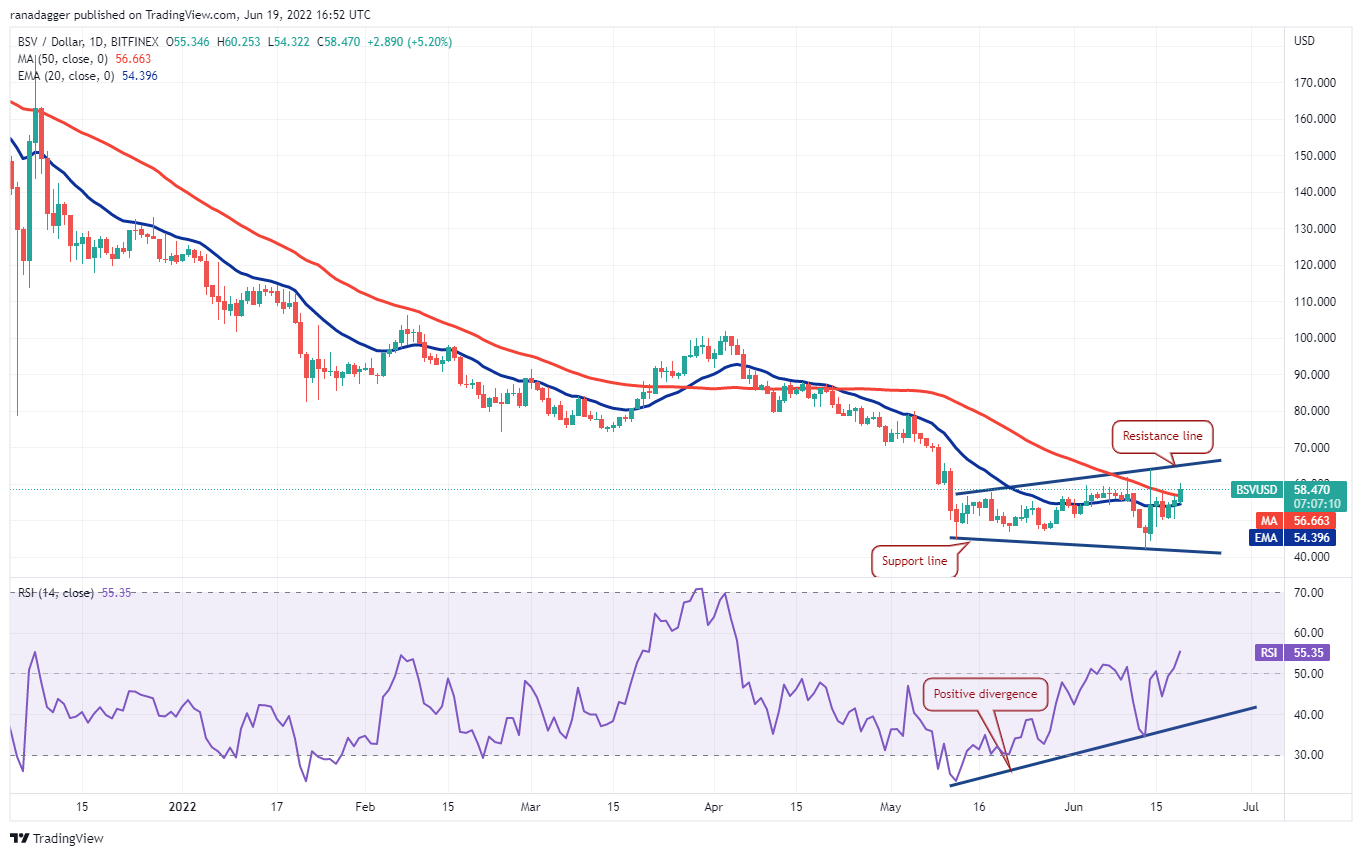
Conversely, if bulls drive the price above the resistance line, it will suggest that the pair may have bottomed out. The pair could then start a new up-move which could push the pair to $80 and then $87.
If they succeed, the pair could start a new up-move. The pattern target of this setup is $87. Another possibility is that the price turns down from $66. If that happens, it will suggest that the pair may remain range-bound for some more time.
The views and opinions expressed here are solely those of the author and do not necessarily reflect the views of Cointelegraph. Every investment and trading move involves risk, you should conduct your own research when making a decision.

Leave A Comment